330 W 4th St · Frostproof, FL
Flood risk 1/10 · Minimal
- FEMA flood zone
- X (unshaded)
- Chance of flooding over 30 yrs
- 0.0%
- Est. flood insurance / yr
- $507 – $1,088
Fire risk 3/10 · Minor
- Est. fire insurance / yr
- $947 – $1,759
Heat risk 8/10 · Major
- Hot days now (above 108°F)
- 7 days/yr
- Hot days in 30 yrs
- 22 days/yr
Wind risk 9/10 · Severe
- Chance of severe wind over 30 yrs
- 99.0%
Air-quality risk 2/10 · Minimal
- Unhealthy air days now
- 0 days/yr
- Unhealthy air days in 30 yrs
- 2 days/yr
Risk factors via First Street. Map © Google.
Why this score? — see what drove the C grade
The composite is a weighted blend of 9 inputs, each scored 0–100. Each bar is that input's sub-score; the figure is the points it added to the 100-point composite (weight × sub-score).
- Cash flow +19.4/30.0
- ARV discount +7.5/15.0
- DSCR +6.1/10.0
- 1% rule +5.9/10.0
- Appreciation +4.7/10.0
- Schools +3.5/10.0
- Livability +3.5/5.0
- Rent growth +2.5/5.0
- Condition / age +2.5/5.0
$124,900
🖨 Deal sheet 📄 Offer letter ✓ Due diligence
Listing remarks MLS
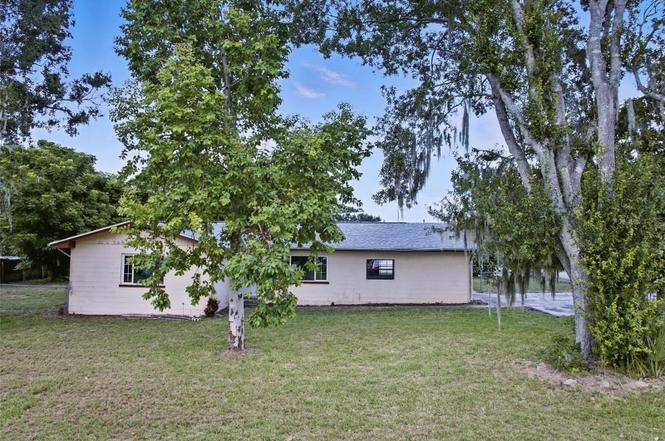
Spacious 3 bedroom, 2 bath block home built in 1970 sits upon a 0.32 acre corner lot with unobstructed views of Lake Clinch in Frostproof. 2064 SF under air, 2444 SF total under roof. Large Living Room and separate Family Room. Inside laundry room; wood cabinets, laminate counter tops in Kitchen. Covered lanai, additional screened rear porch plus detached block storage building. Master bedroom with additional sitting room attached. Ceramic tile flooring throughout. Fenced back yard.
Key facts
- Desirable corner lot
- Lake clinch views
- Fenced yard
Tags
Property features AI
Finance
- Other: Property type: Residential — Single family residence
- Financial info: No lease restrictions; Tax year 2024
- HOA & community: No HOA; Pets allowed
Exterior
- Parking: No parking details listed
- Security: No security features listed
- Utilities: Public water; Septic tank; Electricity connected
- Home design: Single family residence; One story; Home faces south
- Construction: Stucco construction; Shingle roof; Slab foundation; Built on 0.32-acre lot
- Exterior features: Other exterior features
Interior
- Kitchen: Dishwasher; Range; Refrigerator
- Bedrooms: 3 bedrooms
- Flooring: Tile
- Bathrooms: 2 full bathrooms
- Heating & cooling: Central heating (electric); Central air conditioning
- Interior features: Ceiling fans
- Laundry & utility: No laundry features listed
Neighborhood map
What this means for you Summary
Snapshot
- This is a 3-bed/1.0-bath single-family listed at $125k.
Deal economics
- At list price, monthly cash flow is $138 ($2k/yr) — positive.
- The deal already cash-flows at list — no discount required.
- Meets the 1% rule at list price ($1k rent vs $125k).
- Recommended offer: $110k (12.0% below list) — sets the bar for market timing.
Location & tenants
- Location reads 69/100 on livability (#456 in FL) — a middle-class / working-renter tenant base. Strengths: cost of living A+, housing A+, health & safety A+; Watch: amenities F, commute F, employment D-.
- Polk (suburban): math 39% / reading 43% proficiency, ranked #62 of 73 in FL (top 85%) — families likely to look elsewhere, expect single-tenant / working-renter base with shorter leases.
- Zoned schools: Frostproof Ben Hill Griffin Jr Elementary School (math 34% / reading 36%, grade F, #1,697 of 2,144 statewide, top 80%, 917 students, 66% FRL); Frostproof Middle/Senior High (math 34% / reading 34%, grade F, #394 of 667 statewide, top 60%, 1,150 students, 60% FRL) — zoned schools at 63% FRL track the district average.
- Market conditions: 437 active listings in the ZIP; 5 comparable units currently listed for rent nearby; rentals leasing fast (median 14d on market — plan ~1-2 weeks tenant-placement turnaround); 10,384 units permitted in Polk County in 2024 (1,716 in 5+ unit buildings).
Forward outlook
- In year one you build about $26 of equity ($864 loan paydown + $-838 appreciation (-0.7% local appreciation)).
- Polk County population projected at +33% by 2050 — long-run rental-demand tailwind backs the buy-and-hold thesis.
- At projected returns (-0.7% appreciation + 3.0% rent growth), your $35k cash investment doubles in ~10 years — after that, you're playing with house money.
Negotiation context
- It's been on market 246 days — a 12% lower offer ($110k) is reasonable based on typical stale-listing flexibility.
- 7 sale attempts since 5y ago; this cycle's ask has dropped $110k (47%) from the opening price — seller is motivated, your offer sets the floor, not the list.
Risks & watch-outs
- Climate carrying-cost: severe wind risk, 99% chance of damaging wind over 30y; extreme-heat days projected 7→22/yr by 2055 (HVAC capex compounding) — expect insurance premiums to compound above CPI over the hold.
Questions for the listing agent
- It's been on market 246 days. Have you received any prior offers? Is the seller open to a 12% concession, seller financing, or rate buy-down credit?
- Built in 1970 — when were the roof, HVAC, electrical panel, plumbing, and water heater last replaced?
- Why hasn't it sold? Are there any deal-killer items the seller is aware of (foundation, flood, title, zoning, code violations)?
- Is there a deadline driving the sale (1031 exchange, divorce, estate, relocation)? That informs how much negotiation room exists.
- Schools are D-rated, which usually means shorter tenancies and higher turnover. Who's the typical renter profile here, and what's been the actual vacancy rate?
- What's the average days-on-market for RENTAL listings here right now (not sales)? A rising rental-DOM trend means longer vacancies and softer asking-rent achievability than the comps imply.
- What's the recent tenant-quality profile in this submarket — average credit score on applications, eviction rate, late-payment / NSF rate, and stable-employment percentage? A property-management company in the area should have these aggregated.
- How much new for-sale + rental construction is in the pipeline within 1–3 miles? Heavy new supply typically softens prices + rents 12–24 months out; constrained supply supports both.
Investment metrics
- 1% rule
- 1.09% ✓
- Cap rate
- 7.62%
- Cash-on-cash
- 4.75%
- DSCR
- 1.21
- GRM
- 7.6
CMA / ARV
No comps found within radius.
Projected returns pro-forma
-0.67% appreciation · 3.0% rent growth · sell at horizon
- IRR
- 0.8%
- Equity multiple
- 1.04×
- Total profit
- $1,336
- Equity at exit
- $32,132
- IRR
- 7.1%
- Equity multiple
- 1.71×
- Total profit
- $24,904
- Equity at exit
- $35,461
Cash invested: $34,972 (down + closing). Projections, not guarantees.
Landlord ↔ Tenant lean methodology
- Overall (STATE)
- 87 Strongly Landlord-Friendly
- State Florida
- 87 Strongly Landlord-Friendly · R+3
- County
- — inherits STATE
- City
- — inherits STATE
ZIP-level market 33843
- Home prices YoY
- -0.2%
- Active inventory
- 437
- Price-to-rent
- 7.6×
Monthly cashflow live
- Estimated rent
- $1,363 high interval (Pro) →
- Mortgage (P&I)
- −$655
- Tax from tax record
- −$232 /mo · $2,781/yr
- Insurance
- −$52
- HOA
- −$0
- Vacancy / Maint / Mgmt
- −$286
- Net cashflow
- $138
Break-even live
UW: 25.0% down · 7.5% · 30yr · 1.5% tax · 5.0% vac · 8.0% maint · 8.0% mgmt
Financing live
Cash to close
- Down payment
- $31,225
- Closing costs
- $3,747
- Reserves months
- —
- Total cash needed
- —
Loan-product check · same deal, 3 products live
Conventional
25% down · 7.5% · 30yr
- Down + closing
- —
- Monthly P&I
- —
- Monthly cashflow
- —
- DSCR
- —
- Eligible?
- —
Personal DTI + credit; lowest rate.
DSCR
20% down · 8.5% · 30yr
- Down + closing
- —
- Monthly P&I
- —
- Monthly cashflow
- —
- DSCR
- —
- Eligible?
- —
No personal income docs; deal must DSCR.
Hard money
10% down · 12.0% · 12mo
- Down + closing
- —
- Monthly P&I
- —
- Monthly cashflow
- —
- DSCR
- —
- Eligible?
- —
Short-term bridge; refi at stabilization.
Rent comps 5 comps
| Address | Beds | Baths | Sqft | Rent | $/sqft | DOM | Units | Dist |
|---|---|---|---|---|---|---|---|---|
| 313 S Palm Ave Frostproof, FL | 3.0 | 1.0 | 896 | $1,300 | $1.45 | 14d | 1 | 0.10mi |
| 120 Chesney Blvd Frostproof, FL | 3.0 | 2.0 | 944 | $1,495 | $1.58 | 3d | 1 | 0.81mi |
| 58 Marshall Ln Frostproof, FL | 4.0 | 2.0 | 1435 | $1,356 | $0.94 | 3d | 1 | 1.11mi |
| 307 N Lake Reedy Blvd Frostproof, FL | 3.0 | 2.0 | 1254 | $1,550 | $1.24 | 13d | 1 | 1.15mi |
| 307 N Lake Reedy Blvd Frostproof, FL | 3.0 | 2.0 | 1254 | $1,550 | $1.24 | 14d | 1 | 1.15mi |
Listing history 23 events
-
2026-05-16status Pending
-
2026-04-09price $124,900
-
2026-03-06price $129,900
-
2026-03-01status Active
-
2026-02-27historical
-
2026-01-28status Active
-
2026-01-27historical
-
2026-01-08price $149,900
-
2025-12-07price $159,900
-
2025-11-24status Active
-
2025-11-01status Pending
-
2025-10-14price $179,900
-
2025-09-19price $199,900
-
2025-08-16$234,900 Active
-
2024-05-31historical
-
2024-05-03status Active
-
2024-05-03price $215,000
-
2024-03-23status Pending
-
2024-03-11price $225,000
-
2024-02-29$230,000 Active
-
2021-05-13soldstatus $199,000
-
2021-05-12soldstatus $199,000 487-char remark
Show marketing remark (487 chars)
Spacious 3 bedroom, 2 bath block home built in 1970 sits upon a 0.32 acre corner lot with unobstructed views of Lake Clinch in Frostproof. 2064 SF under air, 2444 SF total under roof. Large Living Room and separate Family Room. Inside laundry room; wood cabinets, laminate counter tops in Kitchen. Covered lanai, additional screened rear porch plus detached block storage building. Master bedroom with additional sitting room attached. Ceramic tile flooring throughout. Fenced back yard.
-
2021-05-12$199,000 487-char remark
Show marketing remark (487 chars)
Spacious 3 bedroom, 2 bath block home built in 1970 sits upon a 0.32 acre corner lot with unobstructed views of Lake Clinch in Frostproof. 2064 SF under air, 2444 SF total under roof. Large Living Room and separate Family Room. Inside laundry room; wood cabinets, laminate counter tops in Kitchen. Covered lanai, additional screened rear porch plus detached block storage building. Master bedroom with additional sitting room attached. Ceramic tile flooring throughout. Fenced back yard.
ⓘ Source: listings_history table (triggers on properties + properties_extension) + one-shot
backfill from property_details.listing_events for pre-trigger history.
Tax reassessment forecast FL · Resets to sale price
- Current annual tax
- $2,781 · $232/mo
- Projected year-2 tax
- $2,781 · $232/mo
- Expected delta
- $0/yr ($0/mo · 0.0%)
ⓘ Screening estimate from a state-policy table — verify with the county assessor before closing.
Climate risk First Street
- Flood 1/10 Low FEMA zone X (unshaded) · 0% chance over 30 yrs
- Wildfire 3/10 Moderate
- Heat 8/10 Severe 7 d/yr ≥108°F today · 22 d/yr by 30 yrs out
- Wind 9/10 Extreme 99% chance of damaging wind over 30 yrs
- Air quality 2/10 Low 0 unhealthy d/yr today · 2 by 30 yrs out
Nearby sold comps map
Loading sold comps map…
Walkable amenities ~0.75 mi
Loading nearby amenities…
Taxation est. · year 1
- Rental income
- $16,361
- − Mortgage interest
- −$6,996
- − Property taxes
- −$2,781
- − Insurance
- −$624
- − Repairs & maintenance
- −$1,309
- − Management
- −$1,309
- − Depreciation
- −$3,633
- Taxable loss
- −$292
- Est. tax savings @ 24.0%
- +$70
- After-tax cash flow
- $1,730/yr
For passive investors: Depreciation is non-cash, so a rental often shows a tax loss while cash-flowing — sheltering income. Rental losses are passive: they offset passive income freely, and up to $25,000/yr can offset ordinary (W-2) income if you actively participate and your MAGI is under $100k (phasing out to $0 by $150k); unused losses carry forward. On sale, claimed depreciation is recaptured at up to 25%, and gains may owe capital-gains tax (a 1031 exchange can defer both). Figures are a year-1 estimate at your 24.0% rate — not tax advice; consult a CPA.
Schools (NCES district)
- District
- Polk
- NCES district ID
- 1201590
- Math proficiency
- 39% ▼ -11.00%
- Reading proficiency
- 43% ▼ -4.00%
- Median HH income
- $43,979
- Composite
- 34.74/100
- National rank
- #5132
- State rank
- #62 of 73 in FL
Livability — Frostproof
- Score
- 69/100
- State rank
- #456
- US rank
- #8297
Category grades
Schools grade is shown separately in the Schools card above.
Census & demographics
- Census place
- Frostproof, FL
- Population (ZIP)
- 11,072
Population outlook (Polk County) Hauer SSP2
- Today (2025)
- 752,975 people
- By 2030
- 804,621 · +6.9%
- By 2040
- 906,117 · +20.3%
- By 2050
- 1,000,476 · +32.9%
- By 2075
- 1,197,520 · +59.0%
- By 2100
- 1,271,518 · +68.9%
Race, ethnicity, and origin ACS 2023
- Neighborhood character
- Majority White (65%)
- Race & ethnicity
- White 65% Hispanic / Latino 24% Two or more races 14% Black 8%
- Hispanic origin (detail)
- Mexican 12% Puerto Rican 9% Cuban 2%
- Common ancestry
- Slovak 3% Italian 1% Romanian 1%
- Foreign-born
- 8% · Canada, Jamaica
- Languages at home
- 78% English-only · Spanish 20%
Political lean MEDSL · Polk
- 2024 margin
- Strong R (+20.7) · D 39.2% · R 59.9%
- 2008→2024 swing
- -14.6pp toward R · 2008: -6.1pp · 2024: -20.7pp
- All cycles
- 2024: R+20.7 2020: R+14.4 2016: R+14.1 2012: R+6.8 2008: R+6.1
Not yet ingested
- Civics
- —
Market trends
- HPI YoY
- ▼ -0.67%
- Current HPI
- 311.1519
- Rent YoY
- —
- Metro
- —
- State GDP YoY
- ▲ 3.28%
- F500 in state
- 36
Industry mix (Fortune 500 HQ in FL)
| Industry | F500 HQs | Revenue |
|---|---|---|
| Industrial Technology | 2 | $29B |
|
||
| Insurance | 2 | $17B |
|
||
| Retail | 1 | $60B |
|
||
| Technology Distribution | 1 | $58B |
|
||
| Homebuilding | 1 | $35B |
|
||
| Technology Manufacturing | 1 | $35B |
|
||
Price history
-37.2% since first listed23 events — show timeline
- 2026-05-16 Pending — Stellar MLS as Distributed by MLS Grid
- 2026-04-09 Price Changed $124,900 Stellar MLS as Distributed by MLS Grid
- 2026-03-06 Price Changed $129,900 Stellar MLS as Distributed by MLS Grid
- 2026-03-01 Relisted — Stellar MLS as Distributed by MLS Grid
- 2026-02-27 Listing Removed — Stellar MLS as Distributed by MLS Grid
- 2026-01-28 Relisted — Stellar MLS as Distributed by MLS Grid
- 2026-01-27 Listing Removed — Stellar MLS as Distributed by MLS Grid
- 2026-01-08 Price Changed $149,900 Stellar MLS as Distributed by MLS Grid
- 2025-12-07 Price Changed $159,900 Stellar MLS as Distributed by MLS Grid
- 2025-11-24 Relisted — Stellar MLS as Distributed by MLS Grid
- 2025-11-01 Pending — Stellar MLS as Distributed by MLS Grid
- 2025-10-14 Price Changed $179,900 Stellar MLS as Distributed by MLS Grid
- 2025-09-19 Price Changed $199,900 Stellar MLS as Distributed by MLS Grid
- 2025-08-16 Listed $234,900 Stellar MLS as Distributed by MLS Grid
- 2024-05-31 Listing Removed — Stellar MLS as Distributed by MLS Grid
- 2024-05-03 Relisted — Stellar MLS as Distributed by MLS Grid
- 2024-05-03 Price Changed $215,000 Stellar MLS as Distributed by MLS Grid
- 2024-03-23 Pending — Stellar MLS as Distributed by MLS Grid
- 2024-03-11 Price Changed $225,000 Stellar MLS as Distributed by MLS Grid
- 2024-02-29 Listed $230,000 Stellar MLS as Distributed by MLS Grid
- 2021-05-13 Sold (Public Records) $199,000 Public Records
- 2021-05-12 Listed $199,000 Stellar MLS as Distributed by MLS Grid
- 2021-05-12 Sold (MLS) $199,000 Stellar MLS as Distributed by MLS Grid
Property tax history
+12.0%/yrLatest (2025): $2,781 · +3.1% YoY. Source: county tax records.
Cash-flow waterfall
monthlySold comps — $/sqft
last 12 mo · ≤1 miLoading sold comps…