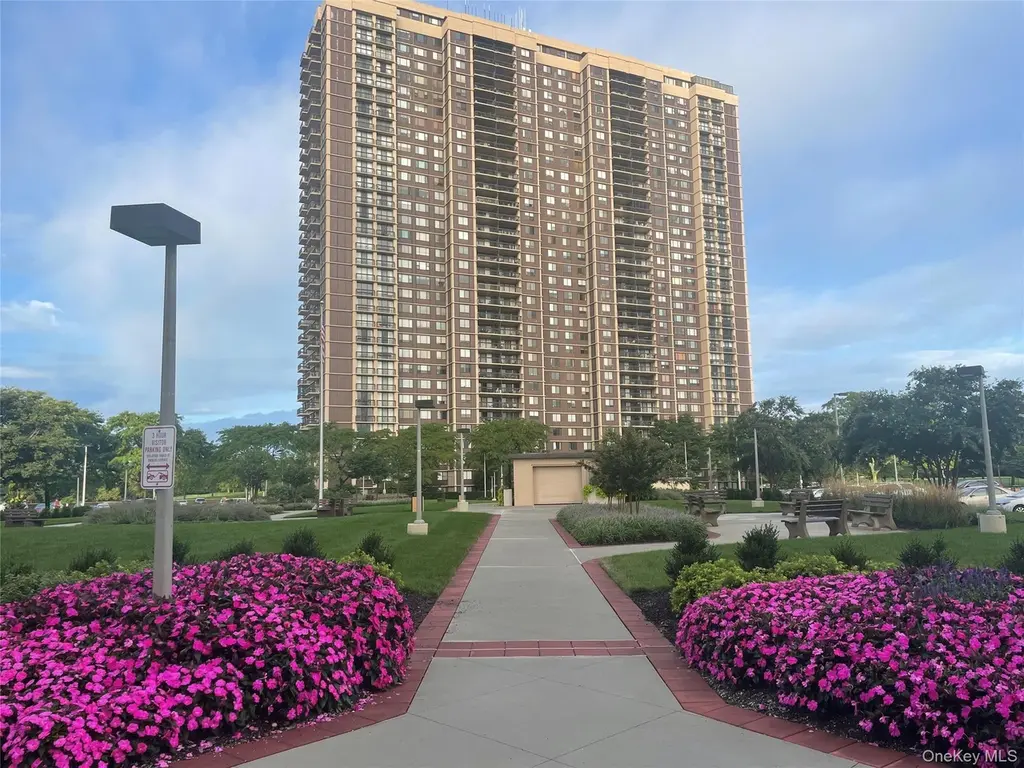
27010 Grand Central Pkwy Unit 4M · New York, NY
Flood risk 1/10 · Minimal
- FEMA flood zone
- X (unshaded)
- Chance of flooding over 30 yrs
- 0.0%
- Est. flood insurance / yr
- $507 – $1,088
Fire risk 2/10 · Minimal
- Est. fire insurance / yr
- $691 – $1,283
Heat risk 5/10 · Moderate
- Hot days now (above 97°F)
- 6 days/yr
- Hot days in 30 yrs
- 12 days/yr
Wind risk 6/10 · Moderate
- Chance of severe wind over 30 yrs
- 27.0%
Air-quality risk 4/10 · Minor
- Unhealthy air days now
- 6 days/yr
- Unhealthy air days in 30 yrs
- 7 days/yr
Risk factors via First Street. Map © Google.
Why this score? — see what drove the D grade
The composite is a weighted blend of 9 inputs, each scored 0–100. Each bar is that input's sub-score; the figure is the points it added to the 100-point composite (weight × sub-score).
- Cash flow +9.5/30.0
- ARV discount +7.5/15.0
- Appreciation +5.0/10.0
- Schools +5.0/10.0
- Livability +3.8/5.0
- 1% rule +3.2/10.0
- DSCR +2.7/10.0
- Rent growth +2.5/5.0
- Condition / age +2.5/5.0
$299,000
🖨 Deal sheet (PDF) 📄 Offer letter ✓ Due diligence
Listing remarks
"M"ust See 1 Bedroom. Magnificent layout with low maintenance. Located in building 2! Open kitchen with many exquisite features. Large bedroom with many closets. Designer stall shower! Call for an appointment today!
Key facts
- Garage
- Built 1975
- Listed 17 days
Property features AI
Finance
- Other: Living area reported from plans; Living area documented as 753 sq ft (source: plans)
- HOA & community: Monthly additional fee of $187 covering TCC, Spectrum, and metered electric
Exterior
- Parking: Assigned parking; Garage; 1 garage space; Parking fee applies
- Security: Secure gated entry (access via security gate to building)
- Utilities: Cable available; Electricity available; Natural gas available; Phone available; Sewer available (listed as Other for sewer type); Water available
- Home design: Stock cooperative; Entry level: 4; Property condition: Actual
- Construction: Aluminum siding construction; Insulated Concrete Forms (ICF) construction
- Exterior features: Aluminum siding; Insulated Concrete Forms (ICFs); Not waterfront
Interior
- Kitchen: Dishwasher; Gas oven; Microwave; Oven; Refrigerator
- Bedrooms: Bedroom on the first floor
- Bathrooms: 1 full bathroom
- Heating & cooling: Central air conditioning; Forced air heating
- Interior features: First-floor bedroom; First-floor full bathroom; No basement; Total of 4 rooms
- Laundry & utility: Washer
Neighborhood map
What this means for you Summary
Snapshot
- This is a 1-bed/1.0-bath condo listed at $299k.
Deal economics
- At list price, monthly cash flow is $-210 ($-3k/yr) — negative.
- To cash-flow at today's rent, offer at most $279k (6.7% below list).
- To meet the 1% rule (rent ≥ 1% of price), the offer needs to be $244k (18.4% below list).
- Recommended offer: $244k (18.4% below list) — sets the bar for 1% rule.
- Cap rate 5.4% vs local median 2.6% in New York — top-decile yield for the area; either an underpriced asset or a hidden risk that comps aren't pricing in. Stress-test before assuming the spread holds.
Location & tenants
- Location reads 75/100 on livability (#268 in NY, #4,188 nationally) — a middle-class / working-renter tenant base. Strengths: amenities A+, commute A+, health & safety A; Watch: crime F, cost of living F.
- Zoned schools: Elm Tree Elementary School (math 27% / reading 52%, grade F, #1,444 of 2,108 statewide, top 71%, 806 students, 94% FRL); Is 227 Louis Armstrong (math 52% / reading 69%, grade B+, #153 of 729 statewide, top 21%, 1,528 students, 68% FRL); Midwood High School (math 94% / reading 96%, grade A+, #83 of 1,100 statewide, top 8%, 4,062 students, 73% FRL).
- Market conditions: 82 active listings in the ZIP; 3 comparable units currently listed for rent nearby; rentals at typical pace (median 26d on market — plan ~3-4 weeks tenant-placement turnaround); 5,302 units permitted in Queens County in 2024 (4,918 in 5+ unit buildings).
Forward outlook
- In year one you build about $11k of equity ($2k loan paydown + $9k appreciation (3.0% local appreciation)).
- Queens County population projected at +16% by 2050 — long-run rental-demand tailwind backs the buy-and-hold thesis.
- By year 4, paydown + projected appreciation supports a ~$37k cash-out refi (75% LTV) — recoverable capital for the next deal without selling this one.
Negotiation context
- It's been on market 17 days — a 2% lower offer ($295k) is reasonable based on typical stale-listing flexibility.
Risks & watch-outs
- Climate carrying-cost: major wind risk, 27% chance of damaging wind over 30y; extreme-heat days projected 6→12/yr by 2055 (HVAC capex compounding) — expect insurance premiums to compound above CPI over the hold.
Questions for the listing agent
- What do current leases actually rent for vs. the listed asking? Can we see a recent rent roll and the last 12 months of T-12 income?
- Built in 1975 — when were the roof, HVAC, electrical panel, plumbing, and water heater last replaced?
- What does the HOA fee cover, when was the last increase, and are there any pending special assessments or reserve-fund shortfalls?
- Any open or pending special assessments — roof, HVAC, plumbing, elevator, façade? What's the per-unit balance and payoff schedule, and is the seller paying it off at close or rolling it to the buyer?
- Is there a deadline driving the sale (1031 exchange, divorce, estate, relocation)? That informs how much negotiation room exists.
- Schools are B-rated — typically a magnet for longer-tenancy family renters. What's the average tenant stay here, and is there a school-zone premium baked into asking?
- Crime grade is F in this area — have there been break-ins, vandalism, or insurance claims at this property in the last 3 years? What carrier currently insures it and at what premium?
- The area grade is low — what's the realistic commute time and amenity access for the typical tenant pool here? Any planned neighborhood developments (good or bad) we should know about?
- What's the average days-on-market for RENTAL listings here right now (not sales)? A rising rental-DOM trend means longer vacancies and softer asking-rent achievability than the comps imply.
- What's the recent tenant-quality profile in this submarket — average credit score on applications, eviction rate, late-payment / NSF rate, and stable-employment percentage? A property-management company in the area should have these aggregated.
- How much new apartment / multifamily construction is in the pipeline within 1–3 miles? Heavy new supply (>2% of stock underway) typically softens rents 12–24 months out; light construction supports rent growth.
Investment metrics
- 1% rule
- 0.82% ✗
- Cap rate
- 5.45%
- Cash-on-cash
- -3.01%
- DSCR
- 0.87
- GRM
- 10.2
CMA / ARV
No comps found within radius.
Projected returns pro-forma
3.0% appreciation · 3.0% rent growth · sell at horizon
- IRR
- 4.7%
- Equity multiple
- 1.27×
- Total profit
- $22,721
- Equity at exit
- $134,443
- IRR
- 7.9%
- Equity multiple
- 2.19×
- Total profit
- $99,792
- Equity at exit
- $207,193
Cash invested: $83,720 (down + closing). Projections, not guarantees.
Landlord ↔ Tenant lean methodology
- Overall (CITY)
- 0 Strongly Tenant-Friendly
- State New York
- 15 Strongly Tenant-Friendly · D+10
- County
- — inherits STATE
- City New York
- 0 Strongly Tenant-Friendly · D+34
ZIP-level market 11005
- Active inventory
- 82
- Price-to-rent
- 10.2×
Monthly cashflow live
- Estimated rent
- $2,440 medium interval (Pro) →
- Mortgage (P&I)
- −$1,568
- Tax est. 1.5%
- −$374 /mo · $4,485/yr
- Insurance
- −$125
- HOA est. from 1 same-building comp
- −$71
- Vacancy / Maint / Mgmt
- −$512
- Net cashflow
- $-210
Break-even live
Sensitivity live
| Price | -10% $-3 | -5% $-107 | +0% $-210 | +5% $-313 | +10% $-417 |
|---|---|---|---|---|---|
| Rent | -10% $-403 | -5% $-306 | +0% $-210 | +5% $-114 | +10% $-17 |
| Rate | -1.0pp $-59 | -0.5pp $-134 | base $-210 | +0.5pp $-288 | +1.0pp $-366 |
UW: 25.0% down · 7.5% · 30yr · 1.5% tax · 5.0% vac · 8.0% maint · 8.0% mgmt
Financing live
Cash to close
- Down payment
- $74,750
- Closing costs
- $8,970
- Reserves months
- —
- Total cash needed
- —
Loan-product check · same deal, 3 products live
Conventional
25% down · 7.5% · 30yr
- Down + closing
- —
- Monthly P&I
- —
- Monthly cashflow
- —
- DSCR
- —
- Eligible?
- —
Personal DTI + credit; lowest rate.
DSCR
20% down · 8.5% · 30yr
- Down + closing
- —
- Monthly P&I
- —
- Monthly cashflow
- —
- DSCR
- —
- Eligible?
- —
No personal income docs; deal must DSCR.
Hard money
10% down · 12.0% · 12mo
- Down + closing
- —
- Monthly P&I
- —
- Monthly cashflow
- —
- DSCR
- —
- Eligible?
- —
Short-term bridge; refi at stabilization.
Rent comps 3 comps
| Address | Beds | Baths | Sqft | Rent | $/sqft | DOM | Units | Dist |
|---|---|---|---|---|---|---|---|---|
| 245-24 77th Cres Jamaica, NY | 2.0 | 1.0 | 785 | $2,600 | $3.31 | 20d | 1 | 1.03mi |
| 76-37 Commonwealth Blvd Unit 2 Jamaica, NY | 1.0 | 1.0 | 641 | $2,200 | $3.43 | 26d | 1 | 1.07mi |
| 240-53 68th Ave Unit 1st Floor Douglaston, NY | 2.0 | 1.0 | 900 | $2,500 | $2.78 | 26d | 1 | 1.22mi |
HOA detail condo
- Monthly dues
- $0 · $0/yr
- Assessments
- None detected in remarks — confirm with the listing agent.
Listing history 10 events
-
2026-06-21days on market $299,000 Active 17 DOM
-
2026-06-18days on market $299,000 Active 14 DOM
-
2026-06-17days on market $299,000 Active 13 DOM
-
2026-06-16days on market $299,000 Active 12 DOM
-
2026-06-15days on market $299,000 Active 11 DOM
-
2026-06-13days on market $299,000 Active 9 DOM
-
2026-06-09days on market $299,000 Active 5 DOM
-
2026-06-08days on market $299,000 Active 4 DOM
-
2026-06-07remarks 215-char remark
-
2026-06-07$299,000 Active 3 DOM
ⓘ Source: listings_history table (triggers on properties + properties_extension) + one-shot
backfill from property_details.listing_events for pre-trigger history.
Climate risk First Street
- Flood 1/10 Low FEMA zone X (unshaded) · 0% chance over 30 yrs
- Wildfire 2/10 Low
- Heat 5/10 Major 6 d/yr ≥97°F today · 12 d/yr by 30 yrs out
- Wind 6/10 Major 27% chance of damaging wind over 30 yrs
- Air quality 4/10 Moderate 6 unhealthy d/yr today · 7 by 30 yrs out
Nearby sold comps map
Loading sold comps map…
Walkable amenities ~0.75 mi
Loading nearby amenities…
Taxation est. · year 1
- Rental income
- $29,275
- − Mortgage interest
- −$16,749
- − Property taxes
- −$4,485
- − Insurance
- −$1,495
- − Repairs & maintenance
- −$2,342
- − Management
- −$2,342
- − HOA
- −$852
- − Depreciation
- −$8,698
- Taxable loss
- −$7,688
- Est. tax savings @ 24.0%
- +$1,845
- After-tax cash flow
- $-675/yr
For passive investors: Depreciation is non-cash, so a rental often shows a tax loss while cash-flowing — sheltering income. Rental losses are passive: they offset passive income freely, and up to $25,000/yr can offset ordinary (W-2) income if you actively participate and your MAGI is under $100k (phasing out to $0 by $150k); unused losses carry forward. On sale, claimed depreciation is recaptured at up to 25%, and gains may owe capital-gains tax (a 1031 exchange can defer both). Figures are a year-1 estimate at your 24.0% rate — not tax advice; consult a CPA.
Schools (NCES district)
No district data.
Livability — New York
- Score
- 75/100
- State rank
- #268
- US rank
- #4188
Category grades
Schools grade is shown separately in the Schools card above.
Census & demographics
- Census place
- New York, NY
- City population
- 7,731,280
- Population (ZIP)
- 2,195
Population outlook (Queens County) Hauer SSP2
- Today (2025)
- 2,546,320 people
- By 2030
- 2,643,059 · +3.8%
- By 2040
- 2,815,563 · +10.6%
- By 2050
- 2,944,423 · +15.6%
- By 2075
- 3,123,338 · +22.7%
- By 2100
- 3,098,688 · +21.7%
Race, ethnicity, and origin ACS 2023
- Neighborhood character
- Predominantly White (95%)
- Race & ethnicity
- White 95% Asian 3% Native American 1%
- Common ancestry
- Scotch-Irish 23% Romanian 11% Italian 7%
- Foreign-born
- 11% · Canada, Jamaica, South Korea
- Languages at home
- 89% English-only · Other Indo-European 5% German/W. Germanic 3% Chinese 1%
Political lean MEDSL · Queens
- 2024 margin
- Strong D (+24.6) · D 62.3% · R 37.7%
- 2008→2024 swing
- -26.2pp toward R · 2008: 50.8pp · 2024: 24.6pp
- All cycles
- 2024: D+24.6 2020: D+45.2 2016: D+53.4 2012: D+58.5 2008: D+50.8
Not yet ingested
- Civics
- —
Market trends
- HPI YoY
- —
- Current HPI
- —
- Rent YoY
- —
- Metro
- —
- State GDP YoY
- ▲ 2.60%
- F500 in state
- 92
Industry mix (Fortune 500 HQ in NY)
| Industry | F500 HQs | Revenue |
|---|---|---|
| Financial Services | 10 | $950B |
|
||
| Consumer Goods | 9 | $162B |
|
||
| Insurance | 4 | $225B |
|
||
| Telecommunications | 2 | $144B |
|
||
| Pharmaceuticals | 2 | $112B |
|
||
| Media / Entertainment | 2 | $69B |
|
||
Price history
1 event — show timeline
- 2026-06-04 Listed $299,000 OneKey® MLS as Distributed by MLS Grid
Cash-flow waterfall
monthlySold comps — $/sqft
last 12 mo · ≤1 miLoading sold comps…