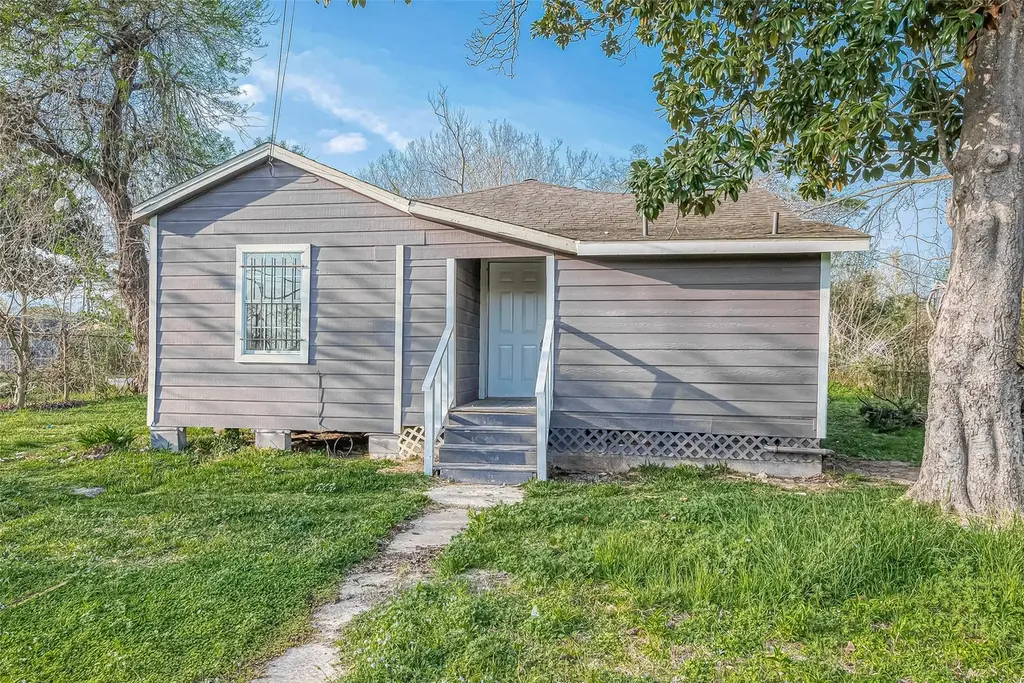
8304 Darien St · Houston, TX
Flood risk No data
- FEMA flood zone
- —
- Chance of flooding over 30 yrs
- —
- Est. flood insurance / yr
- —
Fire risk No data
- Est. fire insurance / yr
- —
Heat risk No data
- Hot days now (above threshold)
- —
- Hot days in 30 yrs
- —
Wind risk No data
- Chance of severe wind over 30 yrs
- —
Air-quality risk No data
- Unhealthy air days now
- —
- Unhealthy air days in 30 yrs
- —
Risk factors via First Street. Map © Google.
Why this score? — see what drove the C+ grade
The composite is a weighted blend of 9 inputs, each scored 0–100. Each bar is that input's sub-score; the figure is the points it added to the 100-point composite (weight × sub-score).
- Cash flow +19.2/30.0
- ARV discount +14.3/15.0
- Appreciation +7.6/10.0
- DSCR +6.1/10.0
- 1% rule +5.2/10.0
- Condition / age +4.0/5.0
- Livability +3.7/5.0
- Schools +2.7/10.0
- Rent growth +2.1/5.0
$159,000
🖨 Deal sheet 📄 Offer letter ✓ Due diligence
Listing remarks
Located in the growing 77028 area, 8304 Darien St offers a prime opportunity in a neighborhood seeing steady revitalization and increased investor activity. With convenient access to major highways including U. S. Highway 90 (Crosby Freeway), Loop 610, and I-10, commuting to Downtown Houston, the East End, and surrounding areas is quick and efficient. The area continues to experience redevelopment and rising demand, making it an ideal option for both first-time homebuyers and investors looking to secure property in an appreciating market. Whether you’re looking to live in or add to your portfolio, this is a strong opportunity in a transitioning and promising location.
Key facts
- Quick commuting
- Convenient access
- Major highways
Tags
Property features AI
Finance
- Other: Lot size about 4,788 square feet (0.11 acres)
- Financial info: Lease considered
- HOA & community: Information not provided
Exterior
- Parking: Information not provided
- Security: Information not provided
- Utilities: Public water; Public sewer; Electric service; Gas service
- Home design: Residential property; One-story (information about stories not provided); Entry level not specified; Facing direction not specified
- Construction: Built in 1945; Slab foundation; Composition roof; Construction materials: Unknown
- Exterior features: Subdivision lot
Interior
- Kitchen: Information not provided
- Bedrooms: Information not provided
- Flooring: Information not provided
- Bathrooms: 2 full bathrooms
- Heating & cooling: Central heating (electric and gas); Central cooling (electric and gas)
- Interior features: 3 total rooms
- Laundry & utility: Information not provided
Neighborhood map
What this means for you Summary
Snapshot
- This is a 2-bed/1.0-bath single-family listed at $159k. Condition is rated good.
Deal economics
- At list price, monthly cash flow is $171 ($2k/yr) — positive.
- The deal already cash-flows at list — no discount required.
- Meets the 1% rule at list price ($2k rent vs $159k).
- Recommended offer: $154k (3.0% below list) — sets the bar for market timing.
- Cap rate 7.6% vs local median 3.2% in Houston — top-decile yield for the area; either an underpriced asset or a hidden risk that comps aren't pricing in. Stress-test before assuming the spread holds.
Location & tenants
- Location reads 74/100 on livability (#184 in TX, #4,771 nationally) — a middle-class / working-renter tenant base. Strengths: amenities A+, cost of living A+, housing A+; Watch: crime F.
- Houston ISD (urban): math 27% / reading 35% proficiency, ranked #593 of 826 in TX (top 72%) — families likely to look elsewhere, expect single-tenant / working-renter base with shorter leases; 71% free/reduced lunch — lower-income household profile, screen leases tightly.
- Zoned schools: Key Middle (math 10% / reading 20%, grade F, #1,569 of 1,662 statewide, top 95%, 615 students, 100% FRL); Kashmere H S (math 14% / reading 22%, grade F, #1,445 of 1,632 statewide, top 89%, 725 students, 96% FRL) — zoned schools average 98% FRL vs 71% district-wide (27 pts higher); higher-poverty schools than district average — tighter screening recommended.
- Zoned-school proficiency averages 16% at this address vs 31% district-wide (-14 pts) — the specific schools serving this property underperform the Houston ISD average; the district grade overstates school quality for this exact location.
- Market conditions: Rents soft (-1.6%/yr); 353 active listings in the ZIP; 26 comparable units currently listed for rent nearby; rentals lingering (median 44d on market — plan ~5-8 weeks vacancy on turnover, expect pricing pressure); 58% of comp listings sitting > 30 days — soft ceiling on asking rent; lower-income renter base — watch delinquency; 29,883 units permitted in Harris County in 2024 (8,621 in 5+ unit buildings).
Forward outlook
- In year one you build about $9k of equity ($1k loan paydown + $8k appreciation (5.2% local appreciation)).
- Harris County population projected at +47% by 2050 — long-run rental-demand tailwind backs the buy-and-hold thesis.
- At projected returns (5.2% appreciation + 0.0% rent growth), your $45k cash investment doubles in ~4 years — after that, you're playing with house money.
- By year 4, paydown + projected appreciation supports a ~$32k cash-out refi (75% LTV) — recoverable capital for the next deal without selling this one.
Negotiation context
- It's been on market 36 days — a 3% lower offer ($154k) is reasonable based on typical stale-listing flexibility.
- 3 sale attempts; this cycle's ask is 10680% above the opening price — seller raised mid-cycle; expect resistance to lowballs.
Risks & watch-outs
- Watch-outs: built in 1945 — expect roof / HVAC / electrical / plumbing capex.
Questions for the listing agent
- It's been on market 36 days. Have you received any prior offers? Is the seller open to a 3% concession, seller financing, or rate buy-down credit?
- Built in 1945 — when were the roof, HVAC, electrical panel, plumbing, and water heater last replaced?
- Is there a deadline driving the sale (1031 exchange, divorce, estate, relocation)? That informs how much negotiation room exists.
- Schools are D-rated, which usually means shorter tenancies and higher turnover. Who's the typical renter profile here, and what's been the actual vacancy rate?
- Crime grade is F in this area — have there been break-ins, vandalism, or insurance claims at this property in the last 3 years? What carrier currently insures it and at what premium?
- What's the average days-on-market for RENTAL listings here right now (not sales)? A rising rental-DOM trend means longer vacancies and softer asking-rent achievability than the comps imply.
- What's the recent tenant-quality profile in this submarket — average credit score on applications, eviction rate, late-payment / NSF rate, and stable-employment percentage? A property-management company in the area should have these aggregated.
- How much new for-sale + rental construction is in the pipeline within 1–3 miles? Heavy new supply typically softens prices + rents 12–24 months out; constrained supply supports both.
Investment metrics
- 1% rule
- 1.02% ✓
- Cap rate
- 7.58%
- Cash-on-cash
- 4.61%
- DSCR
- 1.21
- GRM
- 8.2
CMA / ARV
- ARV (median comp)
- $187,332
- List price
- $159,000
- Delta
- -15.12%
- Verdict
- UNDERPRICED
- Comps
- 20 within 1.0 mi
Show comp detail 11 sales within ~0.75 mi
| Address | Dist | Beds/Ba | Sqft | Sold | Price | $/sf | Match |
|---|---|---|---|---|---|---|---|
| 9009 Compton St | 0.63mi | 2/1.0 | 1,040 (+2%) | 4mo | $130,000 | $125 | 64 |
| 7534 Bywood St | 0.36mi | 3/1.0 (+1) | 1,107 (+8%) | 10mo | $179,000 | $162 | 56 |
| 7410 Glen Manor Dr | 0.30mi | 3/2.0 (+1) | 1,140 (+11%) | 6mo | $225,000 | $197 | 53 |
| 6916 Orville St | 0.45mi | 2/1.0 | 928 (-9%) | 13mo | $154,999 | $167 | 53 |
| 7406 Weyburn St | 0.14mi | 3/1.5 (+1) | 1,143 (+12%) | 18mo | $200,000 | $175 | 52 |
| 7625 Delavan Dr | 0.56mi | 3/1.0 (+1) | 1,092 (+7%) | 12mo | $145,000 | $133 | 48 |
| 7622 Delavan Dr | 0.57mi | 3/1.0 (+1) | 1,120 (+9%) | 6mo | $132,000 | $118 | 48 |
| 7516 Weyburn St | 0.32mi | 3/1.0 (+1) | 888 (-13%) | 15mo | $98,000 | $110 | 45 |
| 7502 Fawnridge Dr | 0.42mi | 3/1.0 (+1) | 1,105 (+8%) | 21mo | $175,000 | $158 | 45 |
| 6717 Larkstone St | 0.60mi | 3/1.0 (+1) | 1,060 (+4%) | 20mo | $95,000 | $90 | 45 |
| 7518 S Finch Cir | 0.73mi | 2/1.5 | 1,176 (+15%) | 14mo | $129,000 | $110 | 28 |
Match score weights: distance 35% · size 25% · config 20% · recency 20%. Top-matched comps best support the ARV.
Projected returns pro-forma
5.25% appreciation · 0.0% rent growth · sell at horizon
- IRR
- 15.9%
- Equity multiple
- 2.01×
- Total profit
- $45,046
- Equity at exit
- $92,479
- IRR
- 15.1%
- Equity multiple
- 3.64×
- Total profit
- $117,678
- Equity at exit
- $161,606
Cash invested: $44,520 (down + closing). Projections, not guarantees.
Landlord ↔ Tenant lean methodology
- Overall (STATE)
- 87 Strongly Landlord-Friendly
- State Texas
- 87 Strongly Landlord-Friendly · R+5
- County
- — inherits STATE
- City
- — inherits STATE
ZIP-level market 77028
- Home prices YoY
- 2.0%
- Rents YoY
- -1.6%
- Active inventory
- 353
- Price-to-rent
- 8.2×
Monthly cashflow live
- Estimated rent
- $1,625 high interval (Pro) →
- Mortgage (P&I)
- −$834
- Tax from tax record
- −$213 /mo · $2,552/yr
- Insurance
- −$66
- HOA
- −$0
- Vacancy / Maint / Mgmt
- −$341
- Net cashflow
- $171
Break-even live
UW: 25.0% down · 7.5% · 30yr · 1.5% tax · 5.0% vac · 8.0% maint · 8.0% mgmt
Financing live
Cash to close
- Down payment
- $39,750
- Closing costs
- $4,770
- Reserves months
- —
- Total cash needed
- —
Loan-product check · same deal, 3 products live
Conventional
25% down · 7.5% · 30yr
- Down + closing
- —
- Monthly P&I
- —
- Monthly cashflow
- —
- DSCR
- —
- Eligible?
- —
Personal DTI + credit; lowest rate.
DSCR
20% down · 8.5% · 30yr
- Down + closing
- —
- Monthly P&I
- —
- Monthly cashflow
- —
- DSCR
- —
- Eligible?
- —
No personal income docs; deal must DSCR.
Hard money
10% down · 12.0% · 12mo
- Down + closing
- —
- Monthly P&I
- —
- Monthly cashflow
- —
- DSCR
- —
- Eligible?
- —
Short-term bridge; refi at stabilization.
Rent comps 26 comps
| Address | Beds | Baths | Sqft | Rent | $/sqft | DOM | Units | Dist |
|---|---|---|---|---|---|---|---|---|
| 7418 Bywood St Houston, TX | 3.0 | 2.0 | 1300 | $1,800 | $1.38 | 24d | 1 | 0.16mi |
| 7119 Bywood St Unit A Houston, TX | 3.0 | 2.5 | 1150 | $1,795 | $1.56 | 43d | 1 | 0.21mi |
| 8015 Elbert St Unit A Houston, TX | 2.0 | 2.0 | 1021 | $1,650 | $1.62 | 7d | 1 | 0.30mi |
| 7601 Springdale St Houston, TX | 3.0 | 2.0 | 1224 | $1,200 | $0.98 | 15d | 1 | 0.42mi |
| 9410 Firnat St Unit B Houston, TX | 3.0 | 2.5 | 1500 | $1,900 | $1.27 | 43d | 1 | 0.68mi |
| 7804 Crestview Dr Unit A Houston, TX | 3.0 | 2.0 | 1150 | $1,550 | $1.35 | 22d | 1 | 0.68mi |
| 7914 Laura Koppe Rd Houston, TX | 3.0 | 2.0 | 1400 | $1,850 | $1.32 | 43d | 1 | 0.89mi |
| 7201 Hallshire Dr Houston, TX | 2.0 | 1.0 | 985 | $740 | $0.75 | 43d | 1 | 0.97mi |
| 7201 Hallshire Dr Unit 235 Houston, TX | 3.0 | 1.0 | 1100 | $850 | $0.77 | 43d | 1 | 0.97mi |
| 7201 Hallshire Dr Unit 222 Houston, TX | 2.0 | 1.0 | 985 | $700 | $0.71 | 43d | 1 | 0.97mi |
| 5609 Denmark St Unit A Houston, TX | 3.0 | 2.0 | 1410 | $1,595 | $1.13 | 43d | 1 | 1.01mi |
| 8639 Peachtree St Unit A Houston, TX | 3.0 | 2.5 | 1150 | $1,750 | $1.52 | 43d | 1 | 1.07mi |
| 8006 Lynette St Houston, TX | 3.0 | 1.0 | 1400 | $1,475 | $1.05 | 24d | 1 | 1.07mi |
| 9422 Sandra St Unit B Houston, TX | 3.0 | 2.5 | 1461 | $1,875 | $1.28 | 43d | 1 | 1.15mi |
| 7740 Wileyvale Rd Unit B Houston, TX | 3.0 | 2.0 | 1500 | $3,000 | $2.00 | 43d | 1 | 1.20mi |
| 9550 N Wayside Dr Houston, TX | 1.0–3.0 | 1.0–2.0 | 896 | $1,199 | $1.34 | 1d | 5 | 1.21mi |
| 7830 Nashville St Houston, TX | 3.0 | 2.0 | 1175 | $1,800 | $1.53 | 7d | 1 | 1.22mi |
| 7973 Ritz St Houston, TX | 3.0 | 2.0 | 1076 | $2,250 | $2.09 | 7d | 1 | 1.24mi |
| 8113 Denton St Houston, TX | 3.0 | 2.0 | 1150 | $1,750 | $1.52 | 43d | 1 | 1.26mi |
| 8213 Linda Vista Rd Houston, TX | 3.0 | 2.0 | 1298 | $1,625 | $1.25 | 24d | 1 | 1.31mi |
| 8216 Richland Dr Unit B Houston, TX | 3.0 | 2.0 | 1150 | $1,750 | $1.52 | 43d | 1 | 1.31mi |
| 7945 Henson St Houston, TX | 3.0 | 2.0 | 1300 | $1,699 | $1.31 | 5d | 1 | 1.37mi |
| 7947 Henson St Houston, TX | 3.0 | 2.0 | 1090 | $1,349 | $1.24 | 5d | 1 | 1.37mi |
| 7252 Parker Rd Houston, TX | 3.0 | 1.0 | 916 | $1,650 | $1.80 | 43d | 1 | 1.39mi |
| 8309 Carolwood Dr Houston, TX | 3.0 | 1.0 | 938 | $1,350 | $1.44 | 43d | 1 | 1.41mi |
| 4679 Weaver Rd Houston, TX | 2.0 | 1.0 | 856 | $990 | $1.16 | 43d | 1 | 1.46mi |
Listing history 16 events
-
2026-06-18days on market $159,000 Active 36 DOM
-
2026-06-17days on market $159,000 Active 35 DOM
-
2026-06-16days on market $159,000 Active 34 DOM
-
2026-06-15days on market $159,000 Active 33 DOM
-
2026-06-13days on market $159,000 Active 31 DOM
-
2026-06-10days on market $159,000 Active 27 DOM
-
2026-06-08days on market $159,000 Active 26 DOM
-
2026-06-07days on market $159,000 Active 25 DOM
-
2026-06-04days on market $159,000 Active 22 DOM
-
2026-06-01days on market $159,000 Active 19 DOM
-
2026-05-31days on market $159,000 Active 18 DOM
-
2026-05-14$1,475
-
2026-05-13historical
-
2026-05-13$162,000 Active 681-char remark
-
2026-05-09price $162,000
-
2026-04-08$165,000 Active
ⓘ Source: listings_history table (triggers on properties + properties_extension) + one-shot
backfill from property_details.listing_events for pre-trigger history.
Tax reassessment forecast TX · Resets to sale price
- Current annual tax
- $2,552 · $213/mo
- Projected year-2 tax
- $2,910 · $242/mo
- Expected delta
- +$358/yr (+$30/mo · 14.0%)
ⓘ Screening estimate from a state-policy table — verify with the county assessor before closing.
Nearby sold comps map
Loading sold comps map…
Walkable amenities ~0.75 mi
Loading nearby amenities…
Taxation est. · year 1
- Rental income
- $19,500
- − Mortgage interest
- −$8,906
- − Property taxes
- −$2,552
- − Insurance
- −$795
- − Repairs & maintenance
- −$1,560
- − Management
- −$1,560
- − Depreciation
- −$4,625
- Taxable loss
- −$499
- Est. tax savings @ 24.0%
- +$120
- After-tax cash flow
- $2,172/yr
For passive investors: Depreciation is non-cash, so a rental often shows a tax loss while cash-flowing — sheltering income. Rental losses are passive: they offset passive income freely, and up to $25,000/yr can offset ordinary (W-2) income if you actively participate and your MAGI is under $100k (phasing out to $0 by $150k); unused losses carry forward. On sale, claimed depreciation is recaptured at up to 25%, and gains may owe capital-gains tax (a 1031 exchange can defer both). Figures are a year-1 estimate at your 24.0% rate — not tax advice; consult a CPA.
Condition & rehab AI · 13 photos
This home is in good condition with fresh paint and updated fixtures. It's a great opportunity for investors looking to add to their portfolio in a growing area.
Value-add opportunities
- Resale paint exterior — Fresh paint can enhance curb appeal and property value
- Both update landscaping — Landscaping can improve curb appeal and attract potential buyers
- Both install new windows — New windows can improve energy efficiency and increase property value
Renovation cost estimate screening
Value-add ROI direction
- Resale paint exterior — Fresh paint can enhance curb appeal and property value ↑
- Both update landscaping — Landscaping can improve curb appeal and attract potential buyers ↑
- Both install new windows — New windows can improve energy efficiency and increase property value ↑
ⓘ Cost ranges are severity-bucket heuristics (US national rule-of-thumb). Get contractor quotes + a written scope before underwriting a rehab budget.
Schools (NCES district)
- District
- Houston ISD
- NCES district ID
- 4823640
- Math proficiency
- 27% ▼ -18.00%
- Reading proficiency
- 35% ▼ -6.00%
- Median HH income
- $46,054
- Composite
- 26.63/100
- National rank
- #7173
- State rank
- #593 of 826 in TX
Livability — Houston
- Score
- 74/100
- State rank
- #184
- US rank
- #4771
Category grades
Schools grade is shown separately in the Schools card above.
Census & demographics
- Census place
- Houston, TX
- County
- Harris County · 4,702,590 people
- City population
- 3,226,434
- Metro
- Houston-The Woodlands-Sugar Land, TX
- Population (ZIP)
- 19,109
- Household income
- $38,357
- Rent vs Own
- Severe rent burden
- 1177.0
Population outlook (Harris County) Hauer SSP2
- Today (2025)
- 5,571,493 people
- By 2030
- 6,089,821 · +9.3%
- By 2040
- 7,142,806 · +28.2%
- By 2050
- 8,185,864 · +46.9%
- By 2075
- 10,574,329 · +89.8%
- By 2100
- 12,109,958 · +117.4%
Race, ethnicity, and origin ACS 2023
- Neighborhood character
- Majority Black (57%)
- Race & ethnicity
- Black 57% Hispanic / Latino 41% Two or more races 15% White 2%
- Hispanic origin (detail)
- Mexican 36%
- Foreign-born
- 13% · Canada
- Languages at home
- 61% English-only · Spanish 38%
Political lean MEDSL · Harris
- 2024 margin
- Lean D (+5.5) · D 52.0% · R 46.4% · Other 1.6%
- 2008→2024 swing
- +3.9pp toward D · 2008: 1.6pp · 2024: 5.5pp
- All cycles
- 2024: D+5.5 2020: D+13.3 2016: D+12.4 2012: D+0.1 2008: D+1.6
Not yet ingested
- Civics
- —
Market trends
- HPI YoY
- ▲ 5.25%
- Current HPI
- 267.7798
- Rent YoY
- ▼ -1.55%
- Metro
- Houston-The Woodlands-Sugar Land, TX
- State GDP YoY
- ▲ 3.95%
- F500 in state
- 110
Industry mix (Fortune 500 HQ in TX)
| Industry | F500 HQs | Revenue |
|---|---|---|
| Energy | 16 | $1,198B |
|
||
| Technology | 5 | $198B |
|
||
| Engineering / Construction | 4 | $72B |
|
||
| Energy Services | 3 | $60B |
|
||
| Utilities | 3 | $41B |
|
||
| Healthcare | 2 | $330B |
|
||
Price history
-3.6% since first listed6 events — show timeline
- 2026-05-19 Price Changed $159,000 HARMLS
- 2026-05-14 Listed for Rent $1,475 HARMLS
- 2026-05-13 Listing Removed — HARMLS
- 2026-05-13 Listed $162,000 HARMLS
- 2026-05-09 Price Changed $162,000 HARMLS
- 2026-04-08 Listed $165,000 HARMLS
Cash-flow waterfall
monthlySold comps — $/sqft
last 12 mo · ≤1 miLoading sold comps…