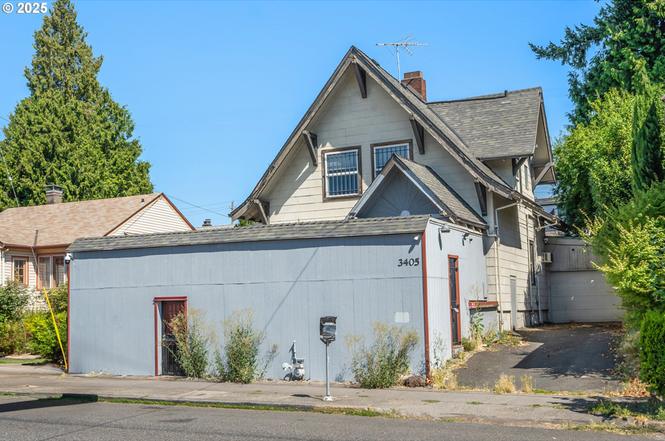
3403 NE Broadway St · Portland, OR
Flood risk No data
- FEMA flood zone
- —
- Chance of flooding over 30 yrs
- —
- Est. flood insurance / yr
- —
Fire risk No data
- Est. fire insurance / yr
- —
Heat risk 3/10 · Minor
- Hot days now (above threshold)
- 7 days/yr
- Hot days in 30 yrs
- 14 days/yr
Wind risk No data
- Chance of severe wind over 30 yrs
- —
Air-quality risk 10/10 · Severe
- Unhealthy air days now
- 19 days/yr
- Unhealthy air days in 30 yrs
- 21 days/yr
Risk factors via First Street. Map © Google.
Why this score? — see what drove the C- grade
The composite is a weighted blend of 9 inputs, each scored 0–100. Each bar is that input's sub-score; the figure is the points it added to the 100-point composite (weight × sub-score).
- ARV discount +15.0/15.0
- Cash flow +13.9/30.0
- Schools +4.7/10.0
- DSCR +4.2/10.0
- 1% rule +3.9/10.0
- Livability +3.9/5.0
- Rent growth +3.3/5.0
- Condition / age +2.5/5.0
- Appreciation +0.0/10.0
$399,900
🖨 Deal sheet (PDF) 📄 Offer letter ✓ Due diligence
Listing remarks
Located in the vibrant NE Broadway business district, this unique fixer property is filled with potential & versatility. Create your ideal live/work space, finish for a duplex (buyer to verify), or live in the historic 1910 house and rent the other areas to a small business. The main residence features living & dining rooms with original hardwood floors and built-ins, three bedrooms on the upper level, plus an unfinished lower level with a separate entrance—perfect for expansion or conversion. A rare 4+ car garage provides secure off-street parking & shop space. Zoned CM2 with incredible visibility, this is a prime spot for buyers & investors alike. Bring your
Key facts
- Separate entrance
- Historic 1910 house
- 4+ car garage
Tags
Neighborhood map
What this means for you Summary
Snapshot
- This is a 3-bed/2.0-bath single-family listed at $400k.
Deal economics
- At list price, monthly cash flow is $42 ($503/yr) — positive.
- The deal already cash-flows at list — no discount required.
- To meet the 1% rule (rent ≥ 1% of price), the offer needs to be $355k (11.2% below list).
- Recommended offer: $355k (11.2% below list) — sets the bar for 1% rule.
- Cap rate 6.4% vs local median 2.2% in Portland — top-decile yield for the area; either an underpriced asset or a hidden risk that comps aren't pricing in. Stress-test before assuming the spread holds.
Location & tenants
- Location reads 77/100 on livability (#72 in OR, #3,256 nationally) — a middle-class / working-renter tenant base. Strengths: amenities A+, commute A+, health & safety A+; Watch: crime F, cost of living F.
- Portland SD 1J (urban): math 46% / reading 58% proficiency, ranked #23 of 183 in OR (top 13%) — acceptable for families but not a draw, mixed tenant base, ~2y average lease.
- Zoned schools: Beverly Cleary School (604 students, 8% FRL); Da Vinci Middle School (434 students, 34% FRL); Grant High School (2,156 students, 14% FRL) — zoned schools average 19% FRL vs 37% district-wide (18 pts lower); this property's tenant base skews higher-income than the district average.
- Market conditions: Rents rising (+3.3%/yr); 57 active listings in the ZIP; 20 comparable units currently listed for rent nearby; rentals at typical pace (median 26d on market — plan ~3-4 weeks tenant-placement turnaround); 2,041 units permitted in Multnomah County in 2024 (905 in 5+ unit buildings).
- At $3,551/mo this rent would consume 60% of the median local household income ($71k/yr) (locally 1846% of renters already pay >50% of income on rent) — very limited rent-growth headroom before tenants either downsize or default.
Forward outlook
- Local home prices are declining (-3.0%/yr); year-one equity from $3k of loan paydown is wiped out by about $12k of value loss. Plan a longer hold.
- Multnomah County population projected at +33% by 2050 — long-run rental-demand tailwind backs the buy-and-hold thesis.
Negotiation context
- It's been on market 68 days — a 6% lower offer ($376k) is reasonable based on typical stale-listing flexibility.
- 2 sale attempts; this cycle's ask has dropped $200k (33%) from the opening price — seller is motivated, your offer sets the floor, not the list.
Risks & watch-outs
- Watch-outs: built in 1910 — expect roof / HVAC / electrical / plumbing capex.
Questions for the listing agent
- It's been on market 68 days. Have you received any prior offers? Is the seller open to a 11% concession, seller financing, or rate buy-down credit?
- Built in 1910 — when were the roof, HVAC, electrical panel, plumbing, and water heater last replaced?
- Why hasn't it sold? Are there any deal-killer items the seller is aware of (foundation, flood, title, zoning, code violations)?
- Is there a deadline driving the sale (1031 exchange, divorce, estate, relocation)? That informs how much negotiation room exists.
- Crime grade is F in this area — have there been break-ins, vandalism, or insurance claims at this property in the last 3 years? What carrier currently insures it and at what premium?
- What's the average days-on-market for RENTAL listings here right now (not sales)? A rising rental-DOM trend means longer vacancies and softer asking-rent achievability than the comps imply.
- What's the recent tenant-quality profile in this submarket — average credit score on applications, eviction rate, late-payment / NSF rate, and stable-employment percentage? A property-management company in the area should have these aggregated.
- How much new for-sale + rental construction is in the pipeline within 1–3 miles? Heavy new supply typically softens prices + rents 12–24 months out; constrained supply supports both.
Investment metrics
- 1% rule
- 0.89% ✗
- Cap rate
- 6.42%
- Cash-on-cash
- 0.45%
- DSCR
- 1.02
- GRM
- 9.4
CMA / ARV
- ARV (on-the-fly)
- $631,680
- Comps found
- 12
Show comp detail 12 sales within ~0.75 mi
| Address | Dist | Beds/Ba | Sqft | Sold | Price | $/sf | Match |
|---|---|---|---|---|---|---|---|
| 3444 NE Schuyler St | 0.04mi | 3/1.0 | 1,981 (+5%) | 7mo | $543,000 | $274 | 79 |
| 2801 NE 35th Pl | 0.53mi | 3/2.0 | 1,932 (+3%) | 2mo | $650,000 | $336 | 69 |
| 3366 NE Oregon St | 0.47mi | 3/2.0 | 1,972 (+5%) | 2mo | $721,000 | $366 | 69 |
| 2109 NE 27th Ave | 0.46mi | 2/2.0 (-1) | 1,698 (-10%) | 1mo | $800,000 | $471 | 57 |
| 2536 NE 37th Ave | 0.46mi | 3/2.0 | 2,054 (+9%) | 8mo | $635,000 | $309 | 56 |
| 2344 NE 42nd Ave | 0.56mi | 2/1.0 (-1) | 1,812 (-4%) | 6mo | $495,000 | $273 | 54 |
| 2924 NE 35th Ave | 0.60mi | 3/2.0 | 2,092 (+11%) | 4mo | $590,000 | $282 | 50 |
| 2545 NE 37th Ave | 0.45mi | 2/2.0 (-1) | 2,094 (+11%) | 6mo | $550,000 | $263 | 50 |
| 2603 NE 44th Ave | 0.69mi | 3/2.0 | 2,012 (+7%) | 9mo | $745,000 | $370 | 49 |
| 2951 NE 35th Ave | 0.62mi | 3/2.0 | 2,110 (+12%) | 5mo | $606,250 | $287 | 46 |
| 3564 NE Mathison Pl | 0.52mi | 4/3.0 (+1) | 2,118 (+13%) | 3mo | $850,000 | $401 | 43 |
| 3126 NE 31st Ave | 0.74mi | 4/2.0 (+1) | 1,634 (-13%) | 10mo | $798,000 | $488 | 30 |
Match score weights: distance 35% · size 25% · config 20% · recency 20%. Top-matched comps best support the ARV.
Projected returns pro-forma
-3.0% appreciation · 3.32% rent growth · sell at horizon
- IRR
- -15.2%
- Equity multiple
- 0.46×
- Total profit
- $-60,932
- Equity at exit
- $59,626
- IRR
- -6.1%
- Equity multiple
- 0.60×
- Total profit
- $-44,668
- Equity at exit
- $34,576
Cash invested: $111,972 (down + closing). Projections, not guarantees.
Landlord ↔ Tenant lean methodology
- Overall (CITY)
- 0 Strongly Tenant-Friendly
- State Oregon
- 28 Tenant-Leaning · D+6
- County
- — inherits STATE
- City Portland
- 0 Strongly Tenant-Friendly · D+39
ZIP-level market 97232
- Rents YoY
- 3.3%
- Active inventory
- 57
- Price-to-rent
- 9.4×
Monthly cashflow live
- Estimated rent
- $3,551 high interval (Pro) →
- Mortgage (P&I)
- −$2,097
- Tax est. 1.5%
- −$500 /mo · $5,998/yr
- Insurance
- −$167
- HOA
- −$0
- Vacancy / Maint / Mgmt
- −$746
- Net cashflow
- $42
Break-even live
Sensitivity live
| Price | -10% $318 | -5% $180 | +0% $42 | +5% $-96 | +10% $-234 |
|---|---|---|---|---|---|
| Rent | -10% $-239 | -5% $-98 | +0% $42 | +5% $182 | +10% $322 |
| Rate | -1.0pp $243 | -0.5pp $144 | base $42 | +0.5pp $-62 | +1.0pp $-167 |
UW: 25.0% down · 7.5% · 30yr · 1.5% tax · 5.0% vac · 8.0% maint · 8.0% mgmt
Financing live
Cash to close
- Down payment
- $99,975
- Closing costs
- $11,997
- Reserves months
- —
- Total cash needed
- —
Loan-product check · same deal, 3 products live
Conventional
25% down · 7.5% · 30yr
- Down + closing
- —
- Monthly P&I
- —
- Monthly cashflow
- —
- DSCR
- —
- Eligible?
- —
Personal DTI + credit; lowest rate.
DSCR
20% down · 8.5% · 30yr
- Down + closing
- —
- Monthly P&I
- —
- Monthly cashflow
- —
- DSCR
- —
- Eligible?
- —
No personal income docs; deal must DSCR.
Hard money
10% down · 12.0% · 12mo
- Down + closing
- —
- Monthly P&I
- —
- Monthly cashflow
- —
- DSCR
- —
- Eligible?
- —
Short-term bridge; refi at stabilization.
Rent comps 20 comps
| Address | Beds | Baths | Sqft | Rent | $/sqft | DOM | Units | Dist |
|---|---|---|---|---|---|---|---|---|
| 3556 NE Sandy Blvd Portland, OR | 3.0 | 2.5 | 1700 | $2,995 | $1.76 | 9d | 1 | 0.17mi |
| 502 NE 29th Ave Unit 1309818P Portland, OR | 3.0 | 1.0 | 2012 | $5,376 | $2.67 | 9d | 1 | 0.66mi |
| 875 NE 27th Ave Portland, OR | 3.0 | 1.0–2.0 | 1462 | $4,900 | $3.35 | 0d | 14 | 0.67mi |
| 348 NE 20th Ave Portland, OR | 3.0 | 2.0 | 1800 | $6,000 | $3.33 | 45d | 1 | 1.03mi |
| 3620-3628 NE 45th Ave Unit 3620 Portland, OR | 3.0 | 1.0 | 1450 | $2,595 | $1.79 | 16d | 1 | 1.16mi |
| 3523 SE Alder St Portland, OR | 4.0 | 2.5 | 2200 | $4,600 | $2.09 | 15d | 1 | 1.17mi |
| 5506 NE Hoyt St Unit A Portland, OR | 4.0 | 2.0 | 1352 | $4,995 | $3.69 | 19d | 1 | 1.19mi |
| 1902 E Burnside St Portland, OR | 3.0 | 2.0 | 2000 | $3,300 | $1.65 | 45d | 1 | 1.20mi |
| 514 SE 42nd Ave Portland, OR | 3.0 | 2.0 | 2176 | $6,500 | $2.99 | 9d | 1 | 1.20mi |
| 3044 NE 53rd Ave Portland, OR | 3.0 | 2.0 | 2236 | $4,250 | $1.90 | 45d | 1 | 1.23mi |
| 3736 SE Belmont St Portland, OR | 3.0 | 1.0 | 1440 | $3,149 | $2.19 | 45d | 1 | 1.31mi |
| 3820 SE Belmont St Unit 1309865P Portland, OR | 4.0 | 2.0 | 1679 | $11,567 | $6.89 | 45d | 1 | 1.32mi |
| 80 NE 14th Ave Portland, OR | 2.0 | 1.0–2.0 | 854 | $2,701 | $3.16 | 0d | 15 | 1.34mi |
| 1937 SE Stark St Unit 2 Portland, OR | 3.0 | 2.0 | 1400 | $3,145 | $2.25 | 25d | 1 | 1.34mi |
| 915 SE 29th Ave Unit 1309869P Portland, OR | 3.0 | 2.0 | 1399 | $8,187 | $5.85 | 25d | 1 | 1.35mi |
| 2605 NE 9th Ave Portland, OR | 3.0 | 2.0 | 2537 | $3,435 | $1.35 | 25d | 1 | 1.42mi |
| 1204 NE 62nd Ave Portland, OR | 4.0 | 2.0 | 1680 | $2,999 | $1.79 | 6d | 1 | 1.42mi |
| 26 NE 11th Ave Unit 1309845P Portland, OR | 3.0 | 2.0 | 2411 | $6,580 | $2.73 | 0d | 1 | 1.47mi |
| 1327 SE Pine St Unit A Portland, OR | 4.0 | 1.5 | 2000 | $3,480 | $1.74 | 45d | 1 | 1.48mi |
| 604 NE San Rafael St Portland, OR | 2.0 | 1.0 | 1335 | $2,185 | $1.64 | 25d | 1 | 1.48mi |
Listing history 8 events
-
2025-10-03status Pending
-
2025-09-15price $399,900
-
2025-08-26price $450,000
-
2025-08-18price $499,900
-
2025-08-11status Active
-
2025-07-31status Pending
-
2025-07-28price $549,500
-
2025-07-16$599,500 Active
ⓘ Source: listings_history table (triggers on properties + properties_extension) + one-shot
backfill from property_details.listing_events for pre-trigger history.
Climate risk First Street
- Heat 3/10 Moderate
- Air quality 10/10 Extreme 19 unhealthy d/yr today · 21 by 30 yrs out
Nearby sold comps map
Loading sold comps map…
Walkable amenities ~0.75 mi
Loading nearby amenities…
Taxation est. · year 1
- Rental income
- $42,615
- − Mortgage interest
- −$22,401
- − Property taxes
- −$5,998
- − Insurance
- −$2,000
- − Repairs & maintenance
- −$3,409
- − Management
- −$3,409
- − Depreciation
- −$11,633
- Taxable loss
- −$6,235
- Est. tax savings @ 24.0%
- +$1,496
- After-tax cash flow
- $1,999/yr
For passive investors: Depreciation is non-cash, so a rental often shows a tax loss while cash-flowing — sheltering income. Rental losses are passive: they offset passive income freely, and up to $25,000/yr can offset ordinary (W-2) income if you actively participate and your MAGI is under $100k (phasing out to $0 by $150k); unused losses carry forward. On sale, claimed depreciation is recaptured at up to 25%, and gains may owe capital-gains tax (a 1031 exchange can defer both). Figures are a year-1 estimate at your 24.0% rate — not tax advice; consult a CPA.
Schools (NCES district)
- District
- Portland SD 1J
- NCES district ID
- 4110040
- Math proficiency
- 46% ▼ -2.00%
- Reading proficiency
- 58% ▼ -3.00%
- Median HH income
- $57,851
- Composite
- 47.1/100
- National rank
- #5112
- State rank
- #23 of 183 in OR
Livability — Portland
- Score
- 77/100
- State rank
- #72
- US rank
- #3256
Category grades
Schools grade is shown separately in the Schools card above.
Census & demographics
- Census place
- Portland, OR
- County
- Multnomah County · 786,692 people
- City population
- 774,334
- Metro
- Portland-Vancouver-Hillsboro, OR-WA
- Population (ZIP)
- 15,615
- Household income
- $70,895
- Rent vs Own
- Severe rent burden
- 1846.0
Population outlook (Multnomah County) Hauer SSP2
- Today (2025)
- 930,825 people
- By 2030
- 996,904 · +7.1%
- By 2040
- 1,121,379 · +20.5%
- By 2050
- 1,242,124 · +33.4%
- By 2075
- 1,464,431 · +57.3%
- By 2100
- 1,576,181 · +69.3%
Race, ethnicity, and origin ACS 2023
- Neighborhood character
- Predominantly White (68%)
- Race & ethnicity
- White 68% Hispanic / Latino 14% Two or more races 13% Black 5% Asian 5%
- Hispanic origin (detail)
- Mexican 8% Cuban 1%
- Common ancestry
- Portuguese 4% Italian 3% Lithuanian 3%
- Foreign-born
- 7% · Canada, China, Vietnam
- Languages at home
- 84% English-only · Spanish 8% Other Asian/Pacific 2% Vietnamese 1%
Political lean MEDSL · Multnomah
- 2024 margin
- Solid D (+62.1) · D 79.3% · R 17.2% · Other 3.5%
- 2008→2024 swing
- +6.0pp toward D · 2008: 56.1pp · 2024: 62.1pp
- All cycles
- 2024: D+62.1 2020: D+61.3 2016: D+58.3 2012: D+54.9 2008: D+56.1
Not yet ingested
- Civics
- —
Market trends
- HPI YoY
- ▼ -397.84%
- Current HPI
- 327.3744
- Rent YoY
- ▲ 3.32%
- Metro
- Portland-Vancouver-Hillsboro, OR-WA
- State GDP YoY
- ▲ 2.05%
- F500 in state
- 2
Industry mix (Fortune 500 HQ in OR)
| Industry | F500 HQs | Revenue |
|---|---|---|
| Consumer Goods | 1 | $51B |
|
||
Price history
-33.3% since first listed8 events — show timeline
- 2025-10-03 Pending — RMLS
- 2025-09-15 Price Changed $399,900 RMLS
- 2025-08-26 Price Changed $450,000 RMLS
- 2025-08-18 Price Changed $499,900 RMLS
- 2025-08-11 Relisted — RMLS
- 2025-07-31 Pending — RMLS
- 2025-07-28 Price Changed $549,500 RMLS
- 2025-07-16 Listed $599,500 RMLS
Cash-flow waterfall
monthlySold comps — $/sqft
last 12 mo · ≤1 miLoading sold comps…