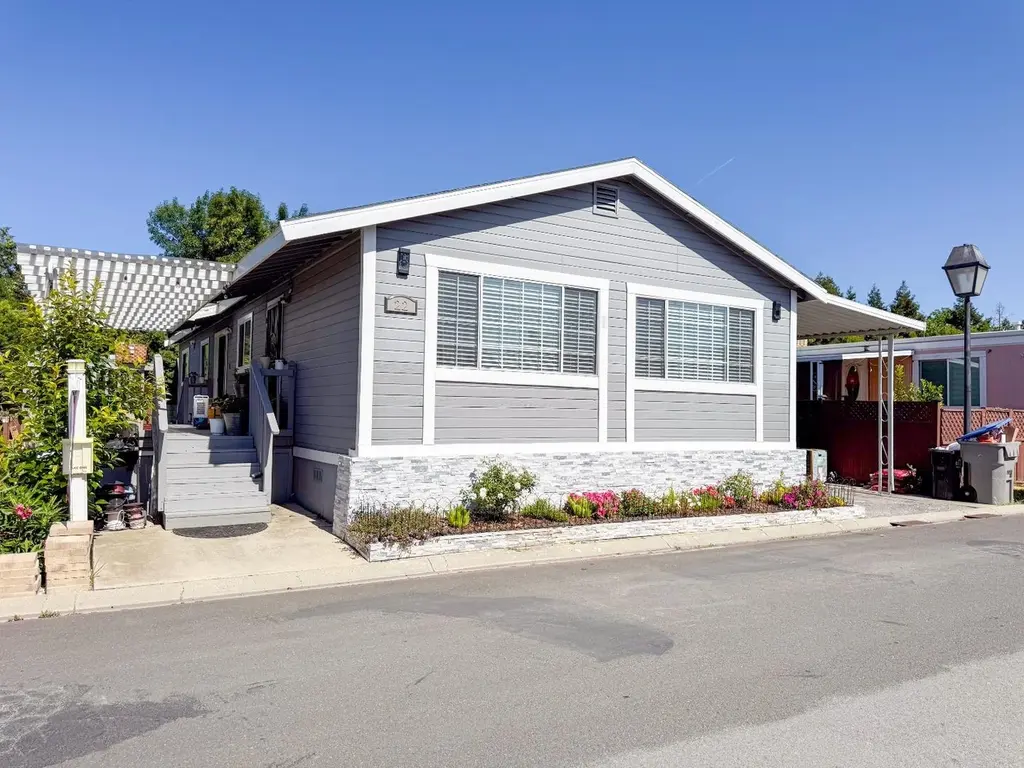
6130 Monterey Rd #22 · San Jose, CA
Flood risk 3/10 · Minor
- FEMA flood zone
- D
- Chance of flooding over 30 yrs
- 0.18%
- Est. flood insurance / yr
- $544 – $1,084
Fire risk 7/10 · Major
- Est. fire insurance / yr
- $659 – $1,223
Heat risk 5/10 · Moderate
- Hot days now (above 96°F)
- 7 days/yr
- Hot days in 30 yrs
- 15 days/yr
Wind risk 1/10 · Minimal
- Chance of severe wind over 30 yrs
- —
Air-quality risk 8/10 · Major
- Unhealthy air days now
- 15 days/yr
- Unhealthy air days in 30 yrs
- 16 days/yr
Risk factors via First Street. Map © Google.
Why this score? — see what drove the C- grade
The composite is a weighted blend of 9 inputs, each scored 0–100. Each bar is that input's sub-score; the figure is the points it added to the 100-point composite (weight × sub-score).
- Cash flow +22.3/30.0
- DSCR +7.1/10.0
- 1% rule +5.8/10.0
- Schools +4.9/10.0
- Condition / age +4.0/5.0
- Livability +3.9/5.0
- Rent growth +2.5/5.0
- ARV discount +0.7/15.0
- Appreciation +0.0/10.0
$395,000
🖨 Deal sheet (PDF) 📄 Offer letter ✓ Due diligence
Listing remarks MLS
Great opportunity mobile home located in the desirable Monterey Oaks park. This remodeled 1972 home has 3 bedrooms, 2 bathrooms with laminate flooring throughout, Marble countertops, plus spacious side yard and backyard space. Covered carport fits 3 vehicles. Reasonable space rent of $1,319. Monterey Oaks offers amenities such as pool, hot tub, gym, tennis court, clubhouse, basketball hoop, children's playground, barbecue area, laundry room, plus security patrol!
Key facts
- Laminate flooring
- Marble countertops
- Covered carport
Tags
Property features AI
Finance
- HOA & community: Community amenities: billiard room, club house, community pool, gym/exercise facility, playground, recreation room, RV/boat storage, sauna/spa/hot tub, tennis court/facility
Exterior
- Parking: Space number 22 (assigned/numbered); Space rent $1,320
- Utilities: Public water; Public sewer; Other utilities (see remarks)
- Home design: Manufactured home on leased land; Entry level information not provided
- Construction: Living area approximately 1,400 (source: assessor)
- Exterior features: Shingle roof
Interior
- Bedrooms: 3 bedrooms
- Bathrooms: 2 full bathrooms
- Heating & cooling: Central forced air heating; Central forced air cooling
- Interior features: Separate family room; Dining area (see remarks); Pets allowed with number restrictions
Neighborhood map
What this means for you Summary
Snapshot
- This is a 3-bed/2.0-bath manufactured listed at $395k. Condition is rated good.
Deal economics
- At list price, monthly cash flow is $650 ($8k/yr) — positive.
- The deal already cash-flows at list — no discount required.
- Meets the 1% rule at list price ($4k rent vs $395k).
- Recommended offer: $383k (3.0% below list) — sets the bar for market timing.
- Cap rate 8.3% vs local median 1.6% in San Jose — top-decile yield for the area; either an underpriced asset or a hidden risk that comps aren't pricing in. Stress-test before assuming the spread holds.
Location & tenants
- Location reads 78/100 on livability (#68 in CA, #2,559 nationally) — a middle-class / working-renter tenant base. Strengths: amenities A+, commute A+, employment A+; Watch: crime F, cost of living F.
- Oak Grove Elementary (urban): math 47% / reading 54% proficiency, ranked #339 of 1,400 in CA (top 24%) — acceptable for families but not a draw, mixed tenant base, ~2y average lease.
- Market conditions: 31 active listings in the ZIP; 9 comparable units currently listed for rent nearby; rentals leasing fast (median 2d on market — plan ~1-2 weeks tenant-placement turnaround); high-income renter base; 3,838 units permitted in Santa Clara County in 2024 (1,886 in 5+ unit buildings).
Forward outlook
- Local home prices are declining (-3.0%/yr); year-one equity from $3k of loan paydown is wiped out by about $12k of value loss. Plan a longer hold.
- Santa Clara County population projected at +24% by 2050 — long-run rental-demand tailwind backs the buy-and-hold thesis.
Negotiation context
- It's been on market 41 days — a 3% lower offer ($383k) is reasonable based on typical stale-listing flexibility.
- 2 sale attempts with the ask held roughly flat each time — persistent listings suggest the price (not the market) is what's stuck; bring a comps-based counter.
Risks & watch-outs
- Climate carrying-cost: major wildfire risk; extreme-heat days projected 7→15/yr by 2055 (HVAC capex compounding) — expect insurance premiums to compound above CPI over the hold.
Questions for the listing agent
- It's been on market 41 days. Have you received any prior offers? Is the seller open to a 3% concession, seller financing, or rate buy-down credit?
- Built in 1972 — when were the roof, HVAC, electrical panel, plumbing, and water heater last replaced?
- Is there a deadline driving the sale (1031 exchange, divorce, estate, relocation)? That informs how much negotiation room exists.
- Crime grade is F in this area — have there been break-ins, vandalism, or insurance claims at this property in the last 3 years? What carrier currently insures it and at what premium?
- What's the average days-on-market for RENTAL listings here right now (not sales)? A rising rental-DOM trend means longer vacancies and softer asking-rent achievability than the comps imply.
- What's the recent tenant-quality profile in this submarket — average credit score on applications, eviction rate, late-payment / NSF rate, and stable-employment percentage? A property-management company in the area should have these aggregated.
- How much new for-sale + rental construction is in the pipeline within 1–3 miles? Heavy new supply typically softens prices + rents 12–24 months out; constrained supply supports both.
Investment metrics
- 1% rule
- 1.08% ✓
- Cap rate
- 8.27%
- Cash-on-cash
- 7.05%
- DSCR
- 1.31
- GRM
- 7.7
CMA / ARV
- ARV (on-the-fly)
- $343,000
- Comps found
- 12
Show comp detail 12 sales within ~0.75 mi
| Address | Dist | Beds/Ba | Sqft | Sold | Price | $/sf | Match |
|---|---|---|---|---|---|---|---|
| 6130 Monterey Rd #260 | 0.20mi | 3/2.0 | 1,344 (-4%) | 8mo | $405,000 | $301 | 78 |
| 6130 Monterey Rd #237 | 0.03mi | 3/2.0 | 1,440 (+3%) | 22mo | $350,000 | $243 | 76 |
| 6130 Monterey Rd #99 | 0.11mi | 3/2.0 | 1,560 (+11%) | 5mo | $378,000 | $242 | 72 |
| 6130 Monterey Hwy #189 | 0.20mi | 3/2.0 | 1,238 (-12%) | 2mo | $400,000 | $323 | 70 |
| 6130 Monterey Rd #25 | 0.20mi | 2/2.0 (-1) | 1,368 (-2%) | 14mo | $290,000 | $212 | 70 |
| 6130 Monterey Rd #174 | 0.20mi | 3/2.0 | 1,440 (+3%) | 19mo | $330,000 | $229 | 70 |
| 6130 Monterey Hwy #217 | 0.20mi | 3/2.0 | 1,503 (+7%) | 16mo | $403,500 | $268 | 66 |
| 6130 Monterey Rd #316 | 0.20mi | 3/2.0 | 1,600 (+14%) | 7mo | $345,000 | $216 | 61 |
| 6130 Monterey Hwy #266 | 0.20mi | 3/2.0 | 1,534 (+10%) | 18mo | $400,000 | $261 | 60 |
| 6130 Monterey Rd #46 | 0.20mi | 3/2.0 | 1,560 (+11%) | 21mo | $382,000 | $245 | 54 |
| 6130 Monterey Rd #215 | 0.20mi | 3/2.0 | 1,582 (+13%) | 20mo | $390,000 | $247 | 52 |
| 6130 Monterey Hwy #136 | 0.20mi | 3/2.0 | 1,200 (-14%) | 20mo | $250,000 | $208 | 50 |
Match score weights: distance 35% · size 25% · config 20% · recency 20%. Top-matched comps best support the ARV.
Projected returns pro-forma
-3.0% appreciation · 3.0% rent growth · sell at horizon
- IRR
- -5.5%
- Equity multiple
- 0.80×
- Total profit
- $-22,574
- Equity at exit
- $58,896
- IRR
- 4.2%
- Equity multiple
- 1.31×
- Total profit
- $33,873
- Equity at exit
- $34,152
Cash invested: $110,600 (down + closing). Projections, not guarantees.
Landlord ↔ Tenant lean methodology
- Overall (CITY)
- 0 Strongly Tenant-Friendly
- State California
- 18 Strongly Tenant-Friendly · D+13
- County
- — inherits STATE
- City San Jose
- 0 Strongly Tenant-Friendly · D+24
ZIP-level market 95138
- Home prices YoY
- -6.5%
- Active inventory
- 31
- Price-to-rent
- 7.7×
Monthly cashflow live
- Estimated rent
- $4,278 high interval (Pro) →
- Mortgage (P&I)
- −$2,071
- Tax est. 1.5%
- −$494 /mo · $5,925/yr
- Insurance
- −$165
- HOA
- −$0
- Vacancy / Maint / Mgmt
- −$898
- Net cashflow
- $650
Break-even live
Sensitivity live
| Price | -10% $922 | -5% $786 | +0% $650 | +5% $513 | +10% $377 |
|---|---|---|---|---|---|
| Rent | -10% $312 | -5% $481 | +0% $650 | +5% $818 | +10% $987 |
| Rate | -1.0pp $848 | -0.5pp $750 | base $650 | +0.5pp $547 | +1.0pp $443 |
UW: 25.0% down · 7.5% · 30yr · 1.5% tax · 5.0% vac · 8.0% maint · 8.0% mgmt
Financing live
Cash to close
- Down payment
- $98,750
- Closing costs
- $11,850
- Reserves months
- —
- Total cash needed
- —
Loan-product check · same deal, 3 products live
Conventional
25% down · 7.5% · 30yr
- Down + closing
- —
- Monthly P&I
- —
- Monthly cashflow
- —
- DSCR
- —
- Eligible?
- —
Personal DTI + credit; lowest rate.
DSCR
20% down · 8.5% · 30yr
- Down + closing
- —
- Monthly P&I
- —
- Monthly cashflow
- —
- DSCR
- —
- Eligible?
- —
No personal income docs; deal must DSCR.
Hard money
10% down · 12.0% · 12mo
- Down + closing
- —
- Monthly P&I
- —
- Monthly cashflow
- —
- DSCR
- —
- Eligible?
- —
Short-term bridge; refi at stabilization.
Rent comps 9 comps
| Address | Beds | Baths | Sqft | Rent | $/sqft | DOM | Units | Dist |
|---|---|---|---|---|---|---|---|---|
| 6100 Monterey Rd San Jose, CA | 1.0–3.0 | 1.0–3.0 | 950 | $4,445 | $4.68 | 2d | 12 | 0.26mi |
| 1075 Esparanza Way San Jose, CA | 3.0 | 3.0 | 1439 | $4,300 | $2.99 | 3d | 1 | 0.32mi |
| 7011 Rodling Dr Unit E San Jose, CA | 2.0 | 2.5 | 1093 | $3,400 | $3.11 | 44d | 1 | 0.40mi |
| 6818 Chroma Ct San Jose, CA | 3.0 | 3.0 | 1563 | $4,295 | $2.75 | 11d | 1 | 1.04mi |
| 206 Martinvale Ln San Jose, CA | 3.0 | 2.0 | 1300 | $4,300 | $3.31 | 2d | 1 | 1.06mi |
| 7060 Cypress Point Ct San Jose, CA | 3.0 | 3.0 | 1850 | $4,000 | $2.16 | 3d | 1 | 1.08mi |
| 6670 Emergent Way San Jose, CA | 1.0–3.0 | 1.0–2.0 | 1024 | $4,953 | $4.83 | 2d | 4 | 1.15mi |
| 6809 Canine Ct San Jose, CA | 3.0 | 3.0 | 1822 | $4,375 | $2.40 | 2d | 1 | 1.16mi |
| 6568 Vision Ct San Jose, CA | 2.0 | 2.0 | 1096 | $4,200 | $3.83 | 2d | 1 | 1.17mi |
Listing history 18 events
-
2026-06-18days on market $395,000 Active 41 DOM
-
2026-06-17days on market $395,000 Active 40 DOM
-
2026-06-16days on market $395,000 Active 39 DOM
-
2026-06-15days on market $395,000 Active 38 DOM
-
2026-06-13days on market $395,000 Active 36 DOM
-
2026-06-13days on market $395,000 Active 35 DOM
-
2026-06-09days on market $395,000 Active 32 DOM
-
2026-06-08days on market $395,000 Active 31 DOM
-
2026-06-07days on market $395,000 Active 30 DOM
-
2026-06-05days on market $395,000 Active 27 DOM
-
2026-06-03days on market $395,000 Active 26 DOM
-
2026-06-02days on market $395,000 Active 25 DOM
-
2026-06-01days on market $395,000 Active 24 DOM
-
2026-05-31days on market $395,000 Active 23 DOM
-
2026-05-12status Pending 467-char remark
Show marketing remark (467 chars)
Great opportunity mobile home located in the desirable Monterey Oaks park. This remodeled 1972 home has 3 bedrooms, 2 bathrooms with laminate flooring throughout, Marble countertops, plus spacious side yard and backyard space. Covered carport fits 3 vehicles. Reasonable space rent of $1,319. Monterey Oaks offers amenities such as pool, hot tub, gym, tennis court, clubhouse, basketball hoop, children's playground, barbecue area, laundry room, plus security patrol!
-
2026-05-12status Pending (Do Not Show) 467-char remark
Show marketing remark (467 chars)
Great opportunity mobile home located in the desirable Monterey Oaks park. This remodeled 1972 home has 3 bedrooms, 2 bathrooms with laminate flooring throughout, Marble countertops, plus spacious side yard and backyard space. Covered carport fits 3 vehicles. Reasonable space rent of $1,319. Monterey Oaks offers amenities such as pool, hot tub, gym, tennis court, clubhouse, basketball hoop, children's playground, barbecue area, laundry room, plus security patrol!
-
2026-04-21$395,000 Active 467-char remark
Show marketing remark (467 chars)
Great opportunity mobile home located in the desirable Monterey Oaks park. This remodeled 1972 home has 3 bedrooms, 2 bathrooms with laminate flooring throughout, Marble countertops, plus spacious side yard and backyard space. Covered carport fits 3 vehicles. Reasonable space rent of $1,319. Monterey Oaks offers amenities such as pool, hot tub, gym, tennis court, clubhouse, basketball hoop, children's playground, barbecue area, laundry room, plus security patrol!
ⓘ Source: listings_history table (triggers on properties + properties_extension) + one-shot
backfill from property_details.listing_events for pre-trigger history.
Climate risk First Street
- Flood 3/10 Moderate FEMA zone D · 18% chance over 30 yrs
- Wildfire 7/10 Severe
- Heat 5/10 Major 7 d/yr ≥96°F today · 15 d/yr by 30 yrs out
- Wind 1/10 Low
- Air quality 8/10 Severe 15 unhealthy d/yr today · 16 by 30 yrs out
Nearby sold comps map
Loading sold comps map…
Walkable amenities ~0.75 mi
Loading nearby amenities…
Taxation est. · year 1
- Rental income
- $51,331
- − Mortgage interest
- −$22,126
- − Property taxes
- −$5,925
- − Insurance
- −$1,975
- − Repairs & maintenance
- −$4,106
- − Management
- −$4,106
- − Depreciation
- −$11,491
- Taxable income
- $1,601
- Est. tax owed @ 24.0%
- −$384
- After-tax cash flow
- $7,410/yr
For passive investors: Depreciation is non-cash, so a rental often shows a tax loss while cash-flowing — sheltering income. Rental losses are passive: they offset passive income freely, and up to $25,000/yr can offset ordinary (W-2) income if you actively participate and your MAGI is under $100k (phasing out to $0 by $150k); unused losses carry forward. On sale, claimed depreciation is recaptured at up to 25%, and gains may owe capital-gains tax (a 1031 exchange can defer both). Figures are a year-1 estimate at your 24.0% rate — not tax advice; consult a CPA.
Condition & rehab AI · 12 photos
This remodeled 1972 mobile home in Monterey Oaks park is in good condition with modern updates and ample outdoor space. It's move-in ready with minor maintenance needed.
Value-add opportunities
- Both Paint exterior siding — Enhances curb appeal and value
- Both Clean gutters — Improves drainage and aesthetics
Renovation cost estimate screening
Value-add ROI direction
- Both Paint exterior siding — Enhances curb appeal and value ↑
- Both Clean gutters — Improves drainage and aesthetics ↑
ⓘ Cost ranges are severity-bucket heuristics (US national rule-of-thumb). Get contractor quotes + a written scope before underwriting a rehab budget.
Schools (NCES district)
- District
- Oak Grove Elementary
- NCES district ID
- 0627810
- Math proficiency
- 47% ▲ 1.00%
- Reading proficiency
- 54% ▬ 0.00%
- Median HH income
- $92,404
- Composite
- 49.23/100
- National rank
- #4382
- State rank
- #339 of 1400 in CA
Livability — San Jose
- Score
- 78/100
- State rank
- #68
- US rank
- #2559
Category grades
Schools grade is shown separately in the Schools card above.
Census & demographics
- Census place
- San Jose, CA
- County
- Santa Clara County · 1,806,974 people
- City population
- 954,479
- Metro
- San Jose-Sunnyvale-Santa Clara, CA
- Population (ZIP)
- 18,960
- Household income
- $204,476
- Rent vs Own
- Severe rent burden
- 254.0
Population outlook (Santa Clara County) Hauer SSP2
- Today (2025)
- 2,179,074 people
- By 2030
- 2,301,297 · +5.6%
- By 2040
- 2,528,195 · +16.0%
- By 2050
- 2,712,135 · +24.5%
- By 2075
- 2,998,701 · +37.6%
- By 2100
- 2,931,429 · +34.5%
Race, ethnicity, and origin ACS 2023
- Neighborhood character
- Diverse neighborhood (Simpson 0.66)
- Race & ethnicity
- Asian 49% Hispanic / Latino 25% Two or more races 17% White 17% Black 4%
- Hispanic origin (detail)
- Mexican 21%
- Common ancestry
- Russian 1% Lithuanian 1% Italian 1%
- Foreign-born
- 40% · Vietnam, Canada, China
- Languages at home
- 40% English-only · Spanish 16% Vietnamese 13% Other Indo-European 10%
Political lean MEDSL · Santa Clara
- 2024 margin
- Solid D (+40.0) · D 68.1% · R 28.1% · Other 3.8%
- 2008→2024 swing
- -0.9pp no change · 2008: 40.9pp · 2024: 40.0pp
- All cycles
- 2024: D+40.0 2020: D+47.4 2016: D+52.5 2012: D+42.1 2008: D+40.9
Not yet ingested
- Civics
- —
Market trends
- HPI YoY
- ▼ -120.53%
- Current HPI
- 1737.74
- Rent YoY
- —
- Metro
- San Jose-Sunnyvale-Santa Clara, CA
- State GDP YoY
- ▲ 3.21%
- F500 in state
- 116
Industry mix (Fortune 500 HQ in CA)
| Industry | F500 HQs | Revenue |
|---|---|---|
| Technology | 27 | $1,492B |
|
||
| Financial Services | 3 | $174B |
|
||
| Retail | 3 | $44B |
|
||
| Insurance | 3 | $26B |
|
||
| Media / Entertainment | 2 | $115B |
|
||
| Pharmaceuticals / Biotech | 2 | $62B |
|
||
Price history
+0.0% since first listed4 events — show timeline
- 2026-05-12 Pending — bridgeMLS, Bay East AOR, or Contra Costa AOR
- 2026-05-12 Pending — MLSListings
- 2026-04-21 Listed $395,000 MLSListings
- 2026-04-21 Listed $395,000 bridgeMLS, Bay East AOR, or Contra Costa AOR
Cash-flow waterfall
monthlySold comps — $/sqft
last 12 mo · ≤1 miLoading sold comps…