407 Forest St · Martinsville, VA
Flood risk 1/10 · Minimal
- FEMA flood zone
- X (unshaded)
- Chance of flooding over 30 yrs
- 0.0%
- Est. flood insurance / yr
- $507 – $1,088
Fire risk 1/10 · Minimal
- Est. fire insurance / yr
- $666 – $1,236
Heat risk 5/10 · Moderate
- Hot days now (above 103°F)
- 7 days/yr
- Hot days in 30 yrs
- 17 days/yr
Wind risk 3/10 · Minor
- Chance of severe wind over 30 yrs
- 4.0%
Air-quality risk 2/10 · Minimal
- Unhealthy air days now
- 0 days/yr
- Unhealthy air days in 30 yrs
- 1 days/yr
Risk factors via First Street. Map © Google.
Why this score? — see what drove the B- grade
The composite is a weighted blend of 9 inputs, each scored 0–100. Each bar is that input's sub-score; the figure is the points it added to the 100-point composite (weight × sub-score).
- Cash flow +30.0/30.0
- 1% rule +10.0/10.0
- DSCR +10.0/10.0
- ARV discount +7.5/15.0
- Livability +3.5/5.0
- Schools +3.3/10.0
- Rent growth +2.5/5.0
- Condition / age +2.5/5.0
- Appreciation +0.0/10.0
$55,000
🖨 Deal sheet 📄 Offer letter ✓ Due diligence
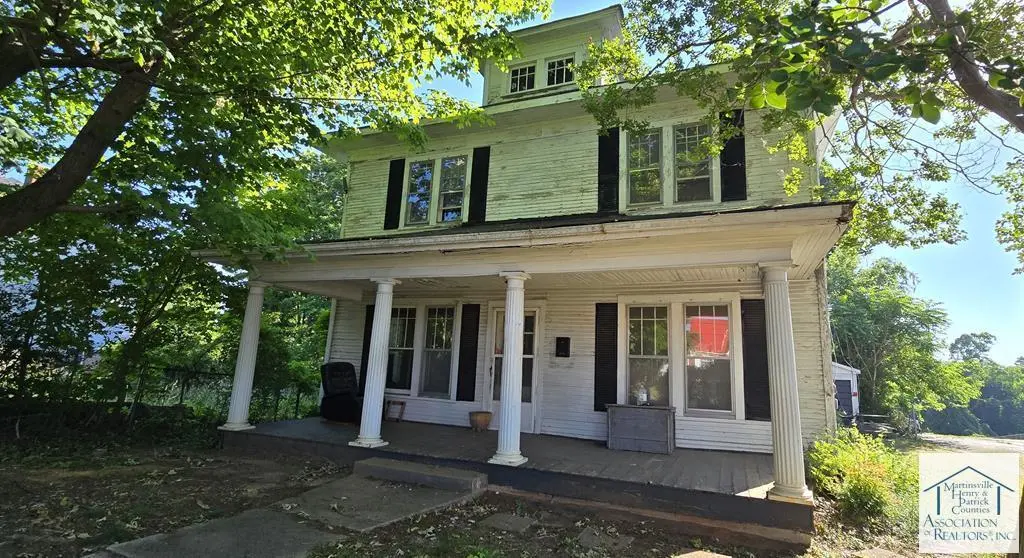
Listing remarks
Commanding 5BR/2BA home on large lot. This home is waiting for your TLC and rehab, would make a BEAUTIFUL finished product, and is probably less work than you might think! Main level bedroom and full bathroom with walk-in shower, eat-in kitchen but formal dining room as well, and front formal living room AND den! Upstairs provides 4 more bedrooms in very good rehab-able condition, another full bathroom, and laundry room. All this with hardwood flooring throughout (some have carpet on top), walls and ceilings in very decent conditions with only minor exceptions. SPACIOUS covered front porch overlooks a nice city street view with pretty homes throughout. Private paved driveway takes you bac
Key facts
- Main level bedroom
- Formal dining room
- Full bathroom
Tags
Property features AI
Finance
- Other: Property located in Martinsville
Exterior
- Parking: Detached garage (1 car); Concrete and paved parking
- Utilities: Public water; Public sewer; Cable available
- Home design: Residential property; Level lot
- Construction: Wood siding exterior; Composition roof; Crawl space
- Exterior features: Patio; Fenced yard; Outbuilding
Interior
- Bedrooms: 3 total rooms
- Flooring: Wood flooring
- Bathrooms: 2 full bathrooms
- Heating & cooling: Electric heating; No central cooling
- Interior features: Electric water heater; Fireplace (3 total)
Neighborhood map
What this means for you Summary
Snapshot
- This is a 5-bed/2.0-bath other listed at $55k.
Deal economics
- At list price, monthly cash flow is $763 ($9k/yr) — positive.
- The deal already cash-flows at list — no discount required.
- Meets the 1% rule at list price ($1k rent vs $55k).
- Cap rate 22.9% vs local median 5.9% in Martinsville — top-decile yield for the area; either an underpriced asset or a hidden risk that comps aren't pricing in. Stress-test before assuming the spread holds.
Location & tenants
- Location reads 70/100 on livability (#231 in VA) — a middle-class / working-renter tenant base. Strengths: cost of living A+, health & safety A+, schools B; Watch: amenities F, commute F, employment D-.
- Martinsville City Public School District (town): math 29% / reading 53% proficiency, ranked #122 of 131 in VA (top 93%) — families likely to look elsewhere, expect single-tenant / working-renter base with shorter leases; 74% free/reduced lunch — lower-income household profile, screen leases tightly.
- Market conditions: 256 active listings in the ZIP; 5 units permitted in Martinsville city in 2024 (5 in 5+ unit buildings).
- This rent runs 36% of the median local income ($49k/yr) — at the standard rent-burdened threshold; future hikes will face affordability resistance.
Forward outlook
- Local home prices are declining (-3.0%/yr); year-one equity from $380 of loan paydown is wiped out by about $2k of value loss. Plan a longer hold.
- Martinsville County population projected at -14% by 2050 — secular population decline; favor cash flow + early exit over multi-decade hold.
- At projected returns (-3.0% appreciation + 3.0% rent growth), your $15k cash investment doubles in ~2 years — after that, you're playing with house money.
Negotiation context
- Only 5 days on market — expect competitive offers; lowballing is unlikely to land.
Risks & watch-outs
- Watch-outs: built in 1930 — expect roof / HVAC / electrical / plumbing capex.
- Climate carrying-cost: extreme-heat days projected 7→17/yr by 2055 (HVAC capex compounding) — expect insurance premiums to compound above CPI over the hold.
Questions for the listing agent
- Built in 1930 — when were the roof, HVAC, electrical panel, plumbing, and water heater last replaced?
- Is there a deadline driving the sale (1031 exchange, divorce, estate, relocation)? That informs how much negotiation room exists.
- Schools are B-rated — typically a magnet for longer-tenancy family renters. What's the average tenant stay here, and is there a school-zone premium baked into asking?
- What's the average days-on-market for RENTAL listings here right now (not sales)? A rising rental-DOM trend means longer vacancies and softer asking-rent achievability than the comps imply.
- What's the recent tenant-quality profile in this submarket — average credit score on applications, eviction rate, late-payment / NSF rate, and stable-employment percentage? A property-management company in the area should have these aggregated.
- How much new for-sale + rental construction is in the pipeline within 1–3 miles? Heavy new supply typically softens prices + rents 12–24 months out; constrained supply supports both.
Investment metrics
- 1% rule
- 2.63% ✓
- Cap rate
- 22.95%
- Cash-on-cash
- 59.49%
- DSCR
- 3.65
- GRM
- 3.2
CMA / ARV
No comps found within radius.
Projected returns pro-forma
-3.0% appreciation · 3.0% rent growth · sell at horizon
- IRR
- 58.2%
- Equity multiple
- 3.58×
- Total profit
- $39,731
- Equity at exit
- $8,201
- IRR
- 63.0%
- Equity multiple
- 7.32×
- Total profit
- $97,293
- Equity at exit
- $4,755
Cash invested: $15,400 (down + closing). Projections, not guarantees.
Landlord ↔ Tenant lean methodology
- Overall (STATE)
- 55 Moderately Landlord-Leaning
- State Virginia
- 55 Moderately Landlord-Leaning · D+2
- County
- — inherits STATE
- City
- — inherits STATE
ZIP-level market 24112
- Active inventory
- 256
- Price-to-rent
- 3.2×
Monthly cashflow live
- Estimated rent
- $1,447 medium interval (Pro) →
- Mortgage (P&I)
- −$288
- Tax from tax record
- −$68 /mo · $822/yr
- Insurance
- −$23
- HOA
- −$0
- Vacancy / Maint / Mgmt
- −$304
- Net cashflow
- $763
Break-even live
UW: 25.0% down · 7.5% · 30yr · 1.5% tax · 5.0% vac · 8.0% maint · 8.0% mgmt
Financing live
Cash to close
- Down payment
- $13,750
- Closing costs
- $1,650
- Reserves months
- —
- Total cash needed
- —
Loan-product check · same deal, 3 products live
Conventional
25% down · 7.5% · 30yr
- Down + closing
- —
- Monthly P&I
- —
- Monthly cashflow
- —
- DSCR
- —
- Eligible?
- —
Personal DTI + credit; lowest rate.
DSCR
20% down · 8.5% · 30yr
- Down + closing
- —
- Monthly P&I
- —
- Monthly cashflow
- —
- DSCR
- —
- Eligible?
- —
No personal income docs; deal must DSCR.
Hard money
10% down · 12.0% · 12mo
- Down + closing
- —
- Monthly P&I
- —
- Monthly cashflow
- —
- DSCR
- —
- Eligible?
- —
Short-term bridge; refi at stabilization.
Listing history 3 events
-
2026-05-21$55,000 Active
-
2026-03-13soldstatus $59,000
-
1982-06-01soldstatus $15,000
ⓘ Source: listings_history table (triggers on properties + properties_extension) + one-shot
backfill from property_details.listing_events for pre-trigger history.
Tax reassessment forecast VA · Resets to sale price
- Current annual tax
- $822 · $68/mo
- Projected year-2 tax
- $822 · $68/mo
- Expected delta
- $0/yr ($0/mo · 0.0%)
ⓘ Screening estimate from a state-policy table — verify with the county assessor before closing.
Climate risk First Street
- Flood 1/10 Low FEMA zone X (unshaded) · 0% chance over 30 yrs
- Wildfire 1/10 Low
- Heat 5/10 Major 7 d/yr ≥103°F today · 17 d/yr by 30 yrs out
- Wind 3/10 Moderate 4% chance of damaging wind over 30 yrs
- Air quality 2/10 Low 0 unhealthy d/yr today · 1 by 30 yrs out
Nearby sold comps map
Loading sold comps map…
Walkable amenities ~0.75 mi
Loading nearby amenities…
Taxation est. · year 1
- Rental income
- $17,366
- − Mortgage interest
- −$3,081
- − Property taxes
- −$822
- − Insurance
- −$275
- − Repairs & maintenance
- −$1,389
- − Management
- −$1,389
- − Depreciation
- −$1,600
- Taxable income
- $8,809
- Est. tax owed @ 24.0%
- −$2,114
- After-tax cash flow
- $7,047/yr
For passive investors: Depreciation is non-cash, so a rental often shows a tax loss while cash-flowing — sheltering income. Rental losses are passive: they offset passive income freely, and up to $25,000/yr can offset ordinary (W-2) income if you actively participate and your MAGI is under $100k (phasing out to $0 by $150k); unused losses carry forward. On sale, claimed depreciation is recaptured at up to 25%, and gains may owe capital-gains tax (a 1031 exchange can defer both). Figures are a year-1 estimate at your 24.0% rate — not tax advice; consult a CPA.
Schools (NCES district)
- District
- Martinsville City Public School District
- NCES district ID
- 5102400
- Math proficiency
- 29% ▼ -51.00%
- Reading proficiency
- 53% ▼ -14.00%
- Median HH income
- $31,215
- Composite
- 33.43/100
- National rank
- #5467
- State rank
- #122 of 131 in VA
Livability — Martinsville
- Score
- 70/100
- State rank
- #231
- US rank
- #7826
Category grades
Schools grade is shown separately in the Schools card above.
Census & demographics
- Census place
- Martinsville, VA
- County
- Martinsville City · 31,028 people
- City population
- 31,028
- Metro
- Martinsville, VA
- Population (ZIP)
- 31,028
- Household income
- $48,770
- Rent vs Own
- Severe rent burden
- 888.0
Population outlook (Martinsville County) Hauer SSP2
- Today (2025)
- 13,026 people
- By 2030
- 12,673 · -2.7%
- By 2040
- 11,933 · -8.4%
- By 2050
- 11,136 · -14.5%
- By 2075
- 9,886 · -24.1%
- By 2100
- 8,334 · -36.0%
Race, ethnicity, and origin ACS 2023
- Neighborhood character
- Diverse neighborhood (Simpson 0.60)
- Race & ethnicity
- White 50% Black 38% Hispanic / Latino 7% Two or more races 5% Asian 1%
- Hispanic origin (detail)
- Mexican 3% Puerto Rican 1%
- Common ancestry
- Slovak 1% Italian 1% Lithuanian 1%
- Foreign-born
- 5% · Canada
- Languages at home
- 92% English-only · Spanish 6% Other Indo-European 1%
Political lean MEDSL · Martinsville
- 2024 margin
- Strong D (+22.6) · D 60.7% · R 38.1% · Other 1.2%
- 2008→2024 swing
- -5.4pp toward R · 2008: 28.0pp · 2024: 22.6pp
- All cycles
- 2024: D+22.6 2020: D+26.6 2016: D+23.5 2012: D+24.6 2008: D+28.0
Not yet ingested
- Civics
- —
Market trends
- HPI YoY
- ▼ -95.37%
- Current HPI
- 172.4393
- Rent YoY
- —
- Metro
- Martinsville, VA
- State GDP YoY
- ▲ 2.40%
- F500 in state
- 50
Industry mix (Fortune 500 HQ in VA)
| Industry | F500 HQs | Revenue |
|---|---|---|
| Aerospace / Defense | 4 | $236B |
|
||
| Technology / Defense | 3 | $32B |
|
||
| Financial Services | 2 | $176B |
|
||
| Utilities | 2 | $27B |
|
||
| Insurance | 2 | $25B |
|
||
| Technology | 2 | $15B |
|
||
Price history
+266.7% since first listed3 events — show timeline
- 2026-05-21 Listed $55,000 MHPCAR
- 2026-03-13 Sold (Public Records) $59,000 Public Records
- 1982-06-01 Sold (Public Records) $15,000 Public Records
Property tax history
+4.8%/yrLatest (2025): $822 · +29.9% YoY. Source: county tax records.
Cash-flow waterfall
monthlySold comps — $/sqft
last 12 mo · ≤1 miLoading sold comps…