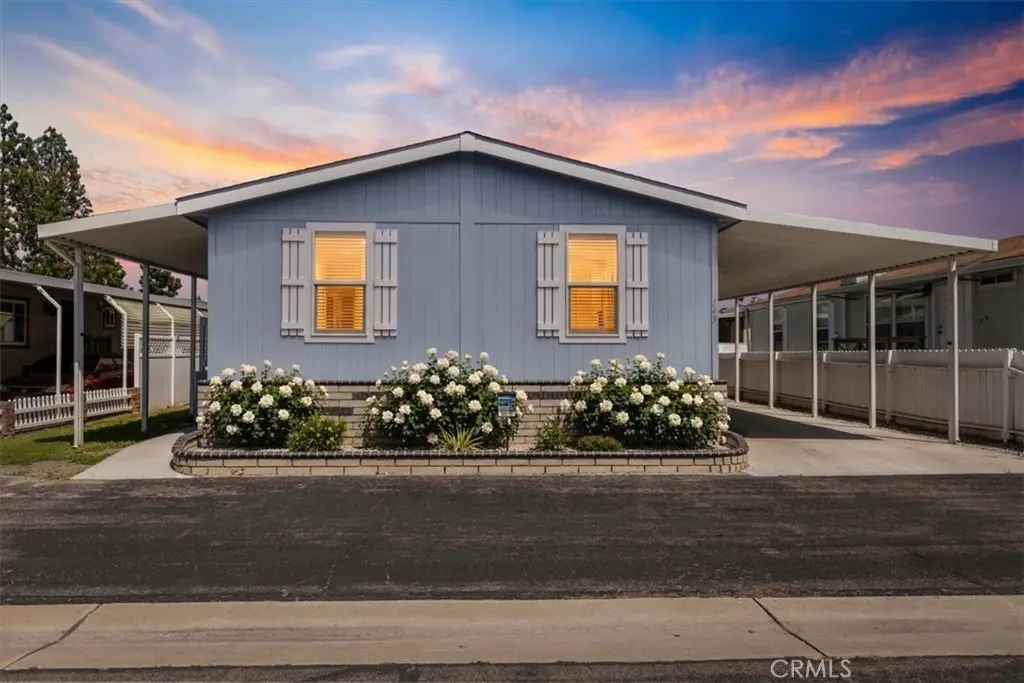
9080 Bloomfield #145 · Cypress, CA
Flood risk 1/10 · Minimal
- FEMA flood zone
- X
- Chance of flooding over 30 yrs
- 0.0%
- Est. flood insurance / yr
- $507 – $1,088
Fire risk 1/10 · Minimal
- Est. fire insurance / yr
- $659 – $1,223
Heat risk 5/10 · Moderate
- Hot days now (above 89°F)
- 7 days/yr
- Hot days in 30 yrs
- 24 days/yr
Wind risk 1/10 · Minimal
- Chance of severe wind over 30 yrs
- —
Air-quality risk 5/10 · Moderate
- Unhealthy air days now
- 7 days/yr
- Unhealthy air days in 30 yrs
- 9 days/yr
Risk factors via First Street. Map © Google.
Why this score? — see what drove the B- grade
The composite is a weighted blend of 9 inputs, each scored 0–100. Each bar is that input's sub-score; the figure is the points it added to the 100-point composite (weight × sub-score).
- Cash flow +30.0/30.0
- 1% rule +10.0/10.0
- DSCR +10.0/10.0
- Schools +6.2/10.0
- Livability +3.7/5.0
- Rent growth +2.9/5.0
- Condition / age +2.5/5.0
- ARV discount +0.0/15.0
- Appreciation +0.0/10.0
$229,900
🖨 Deal sheet 📄 Offer letter ✓ Due diligence
Listing remarks
Brand New 2025 Built Home on a Triple Wide Lot! This isn't just a manufactured home — it's a fresh start in one of Cypress's most sought-after communities. 9080 Bloomfield Street, Space #145 delivers 4 bedrooms, 2 bathrooms, and 1,310 sq. ft. of brand new living space on an oversized triple wide lot in Lincoln Center, a desirable all-age, pet-friendly community with 305 home sites. Step inside to a bright, open-concept layout where the living, dining, and kitchen areas flow together effortlessly. The island kitchen features generous cabinetry, ample countertop space, bar seating, and additional storage. Natural light fills every room with updated flooring, recessed lighting, and a war
Key facts
- Community pool
- Built 2025
- Listed 36 days
Property features AI
Finance
- Other: Pets: restrictions apply (size, breed, number limits; contact manager)
- Financial info: Assessments: buyer to verify
- HOA & community: Community features include curbs and a dog park; Park name: Lincoln Center; Rent includes pool access; Land lease (park) — $2,600 monthly; buyer to verify details; Manager approval required
Exterior
- Parking: Covered parking; Paved driveway; Driveway (combination)
- Security: Smoke and carbon monoxide detectors; Resident manager
- Utilities: Standard electric service; Natural gas available; Sewer connected (public sewer); District/public water
- Home design: Single-story (one level); Mobile home (model 24564A) — 23' x 56'; Turnkey condition; Mobile home remains on site
- Construction: Wood and concrete construction; Synthetic stucco exterior; Drywall interior walls; No foundation specified
- Exterior features: Awning; Rain gutters; Patio; Community pool; Vinyl fencing; Skirting of synthetic and wood
Interior
- Kitchen: Refrigerator; Microwave; Dishwasher; Garbage disposal; Water heater unit
- Bedrooms: All bedrooms on ground level
- Flooring: Laminate flooring
- Bathrooms: 2 full bathrooms; Bathtub and shower; some showers in tub
- Heating & cooling: Central heating (furnace); Central air and wall/window cooling
- Interior features: Beamed ceilings; Laminate counters; Open floor plan; Entry at ground level; Doors at entry; Carbon monoxide and smoke detectors; Resident manager on site
- Laundry & utility: In-unit laundry (inside)
Neighborhood map
What this means for you Summary
Snapshot
- This is a 4-bed/2.0-bath manufactured listed at $230k.
Deal economics
- At list price, monthly cash flow is $2k ($18k/yr) — positive.
- The deal already cash-flows at list — no discount required.
- Meets the 1% rule at list price ($4k rent vs $230k).
- Recommended offer: $223k (3.0% below list) — sets the bar for market timing.
- Cap rate 14.2% vs local median 2.2% in Cypress — top-decile yield for the area; either an underpriced asset or a hidden risk that comps aren't pricing in. Stress-test before assuming the spread holds.
Location & tenants
- Location reads 74/100 on livability (#141 in CA, #4,900 nationally) — a middle-class / working-renter tenant base. Strengths: employment A+, commute A; Watch: health & safety D, cost of living F.
- Cypress Elementary (suburban): math 67% / reading 69% proficiency, ranked #117 of 1,400 in CA (top 8%) — acceptable for families but not a draw, mixed tenant base, ~2y average lease.
- Zoned schools: A. E. Arnold Elementary (math 24% / reading 24%, grade F, #973 of 1,571 statewide, top 73%, 635 students, 46% FRL) — zoned schools average 46% FRL vs 25% district-wide (21 pts higher); higher-poverty schools than district average — tighter screening recommended.
- Zoned-school proficiency averages 24% at this address vs 68% district-wide (-44 pts) — the specific schools serving this property underperform the Cypress Elementary average; the district grade overstates school quality for this exact location.
- Market conditions: Rents rising (+1.7%/yr); 70 active listings in the ZIP; 20 comparable units currently listed for rent nearby; rentals leasing fast (median 10d on market — plan ~1-2 weeks tenant-placement turnaround); high-income renter base; 6,974 units permitted in Orange County in 2024 (3,839 in 5+ unit buildings).
- This rent runs 36% of the median local income ($130k/yr) — at the standard rent-burdened threshold; future hikes will face affordability resistance.
Forward outlook
- Local home prices are declining (-3.0%/yr); year-one equity from $2k of loan paydown is wiped out by about $7k of value loss. Plan a longer hold.
- Orange County population projected at +14% by 2050 — modest demand growth; plan on rents tracking national, not racing it.
- At projected returns (-3.0% appreciation + 1.7% rent growth), your $64k cash investment doubles in ~5 years — after that, you're playing with house money.
Negotiation context
- It's been on market 36 days — a 3% lower offer ($223k) is reasonable based on typical stale-listing flexibility.
- 2 sale attempts with the ask held roughly flat each time — persistent listings suggest the price (not the market) is what's stuck; bring a comps-based counter.
Risks & watch-outs
- Climate carrying-cost: extreme-heat days projected 7→24/yr by 2055 (HVAC capex compounding) — expect insurance premiums to compound above CPI over the hold.
Questions for the listing agent
- It's been on market 36 days. Have you received any prior offers? Is the seller open to a 3% concession, seller financing, or rate buy-down credit?
- Is there a deadline driving the sale (1031 exchange, divorce, estate, relocation)? That informs how much negotiation room exists.
- Schools are A-rated — typically a magnet for longer-tenancy family renters. What's the average tenant stay here, and is there a school-zone premium baked into asking?
- What's the average days-on-market for RENTAL listings here right now (not sales)? A rising rental-DOM trend means longer vacancies and softer asking-rent achievability than the comps imply.
- What's the recent tenant-quality profile in this submarket — average credit score on applications, eviction rate, late-payment / NSF rate, and stable-employment percentage? A property-management company in the area should have these aggregated.
- How much new for-sale + rental construction is in the pipeline within 1–3 miles? Heavy new supply typically softens prices + rents 12–24 months out; constrained supply supports both.
Investment metrics
- 1% rule
- 1.70% ✓
- Cap rate
- 14.16%
- Cash-on-cash
- 28.09%
- DSCR
- 2.25
- GRM
- 4.9
CMA / ARV
- ARV (on-the-fly)
- $180,096
- Comps found
- 12
Show comp detail 12 sales within ~0.75 mi
| Address | Dist | Beds/Ba | Sqft | Sold | Price | $/sf | Match |
|---|---|---|---|---|---|---|---|
| 9080 Bloomfield Ave #22 | 0.00mi | 4/2.0 | 1,344 (0%) | 10mo | $185,000 | $138 | 92 |
| 9080 Bloomfield Ave #230 | 0.00mi | 3/2.0 (-1) | 1,272 (-5%) | 1mo | $159,900 | $126 | 85 |
| 9080 Bloomfield Ave #237 | 0.00mi | 3/2.0 (-1) | 1,408 (+5%) | 4mo | $130,000 | $92 | 84 |
| 9080 Bloomfield Ave #141 | 0.00mi | 4/2.0 | 1,431 (+6%) | 8mo | $155,000 | $108 | 82 |
| 9080 Bloomfield #165 | 0.00mi | 3/2.0 (-1) | 1,344 (0%) | 16mo | $180,000 | $134 | 81 |
| 9080 Bloomfield Ave #209 | 0.00mi | 3/2.0 (-1) | 1,248 (-7%) | 3mo | $129,000 | $103 | 81 |
| 9080 Bloomfield Ave #265 | 0.00mi | 5/2.5 (+1) | 1,400 (+4%) | 10mo | $215,000 | $154 | 78 |
| 9080 Bloomfield Ave #46 | 0.00mi | 4/2.0 | 1,440 (+7%) | 14mo | $190,000 | $132 | 77 |
| 9080 Bloomfield Ave #193 | 0.00mi | 3/2.0 (-1) | 1,248 (-7%) | 10mo | $165,000 | $132 | 75 |
| 9080 Bloomfield Ave #122 | 0.00mi | 3/2.0 (-1) | 1,248 (-7%) | 10mo | $168,000 | $135 | 75 |
| 9080 Bloomfield Ave #192 | 0.12mi | 3/2.0 (-1) | 1,434 (+7%) | 11mo | $218,000 | $152 | 69 |
| 9080 Bloomfield Ave #213 | 0.00mi | 3/2.0 (-1) | 1,170 (-13%) | 12mo | $185,000 | $158 | 63 |
Match score weights: distance 35% · size 25% · config 20% · recency 20%. Top-matched comps best support the ARV.
Projected returns pro-forma
-3.0% appreciation · 1.69% rent growth · sell at horizon
- IRR
- 20.8%
- Equity multiple
- 1.83×
- Total profit
- $53,692
- Equity at exit
- $34,279
- IRR
- 28.1%
- Equity multiple
- 3.33×
- Total profit
- $150,213
- Equity at exit
- $19,878
Cash invested: $64,372 (down + closing). Projections, not guarantees.
Landlord ↔ Tenant lean methodology
- Overall (STATE)
- 18 Strongly Tenant-Friendly
- State California
- 18 Strongly Tenant-Friendly · D+13
- County
- — inherits STATE
- City
- — inherits STATE
ZIP-level market 90630
- Rents YoY
- 1.7%
- Active inventory
- 70
- Price-to-rent
- 4.9×
Monthly cashflow live
- Estimated rent
- $3,919 high interval (Pro) →
- Mortgage (P&I)
- −$1,206
- Tax est. 1.5%
- −$287 /mo · $3,448/yr
- Insurance
- −$96
- HOA
- −$0
- Vacancy / Maint / Mgmt
- −$823
- Net cashflow
- $1,507
Break-even live
UW: 25.0% down · 7.5% · 30yr · 1.5% tax · 5.0% vac · 8.0% maint · 8.0% mgmt
Financing live
Cash to close
- Down payment
- $57,475
- Closing costs
- $6,897
- Reserves months
- —
- Total cash needed
- —
Loan-product check · same deal, 3 products live
Conventional
25% down · 7.5% · 30yr
- Down + closing
- —
- Monthly P&I
- —
- Monthly cashflow
- —
- DSCR
- —
- Eligible?
- —
Personal DTI + credit; lowest rate.
DSCR
20% down · 8.5% · 30yr
- Down + closing
- —
- Monthly P&I
- —
- Monthly cashflow
- —
- DSCR
- —
- Eligible?
- —
No personal income docs; deal must DSCR.
Hard money
10% down · 12.0% · 12mo
- Down + closing
- —
- Monthly P&I
- —
- Monthly cashflow
- —
- DSCR
- —
- Eligible?
- —
Short-term bridge; refi at stabilization.
Rent comps 20 comps
| Address | Beds | Baths | Sqft | Rent | $/sqft | DOM | Units | Dist |
|---|---|---|---|---|---|---|---|---|
| 8381 E Blithedale St Long Beach, CA | 3.0 | 2.0 | 1314 | $3,600 | $2.74 | 1d | 1 | 0.50mi |
| 9424 Ethel St Cypress, CA | 3.0 | 2.5 | 1780 | $4,300 | $2.42 | 15d | 1 | 0.65mi |
| 9306 Gregory St Cypress, CA | 3.0 | 2.5 | 1840 | $4,500 | $2.45 | 18d | 1 | 0.66mi |
| 4801 Merten Ave Cypress, CA | 3.0 | 2.0 | 1500 | $3,875 | $2.58 | 1d | 1 | 0.70mi |
| 8120 E Turbo St Long Beach, CA | 3.0 | 1.5 | 1120 | $3,900 | $3.48 | 43d | 1 | 0.81mi |
| 8561 Belmont St Unit 7 Cypress, CA | 3.0 | 2.0 | 1320 | $4,145 | $3.14 | 10d | 1 | 0.85mi |
| 8561 Belmont St Unit 6 Cypress, CA | 3.0 | 2.5 | 1265 | $3,695 | $2.92 | 1d | 1 | 0.85mi |
| 20817 Ely Ave Lakewood, CA | 3.0 | 1.0 | 1102 | $3,550 | $3.22 | 1d | 1 | 0.98mi |
| 4646 Larwin Ave Cypress, CA | 4.0 | 2.5 | 1562 | $3,800 | $2.43 | 1d | 1 | 1.01mi |
| 12050 226th St Hawaiian Gardens, CA | 3.0 | 2.0 | 1063 | $3,100 | $2.92 | 43d | 1 | 1.03mi |
| 12610 Vandemere St Lakewood, CA | 3.0 | 2.0 | 1056 | $8,250 | $7.81 | 1d | 1 | 1.05mi |
| 10403 Stratton Ct Cypress, CA | 4.0 | 2.5 | 1327 | $3,600 | $2.71 | 43d | 1 | 1.21mi |
| 12350 Del Amo Blvd Lakewood, CA | 1.0–3.0 | 1.0–2.0 | 866 | $3,173 | $3.66 | 2d | 27 | 1.24mi |
| 5475 Villa Way #34 Cypress, CA | 3.0 | 2.5 | 1374 | $3,600 | $2.62 | 2d | 1 | 1.24mi |
| 4002 Bryant Ct Cypress, CA | 3.0 | 1.5 | 1046 | $3,400 | $3.25 | 22d | 1 | 1.25mi |
| 10002 Saint Stephen Cir Cypress, CA | 3.0 | 1.5 | 1205 | $3,700 | $3.07 | 17d | 1 | 1.25mi |
| 5524 Camp St Cypress, CA | 4.0 | 3.0 | 1613 | $4,200 | $2.60 | 1d | 1 | 1.29mi |
| 12022 207th St Lakewood, CA | 3.0 | 2.0 | 1088 | $3,950 | $3.63 | 7d | 1 | 1.31mi |
| 12022 207th St Lakewood, CA | 3.0 | 2.0 | 1088 | $3,950 | $3.63 | 24d | 1 | 1.31mi |
| 20726 Seine Ave Lakewood, CA | 3.0 | 2.0 | 1354 | $3,400 | $2.51 | 20d | 1 | 1.41mi |
Listing history 18 events
-
2026-06-18days on market $229,900 Active 36 DOM
-
2026-06-17days on market $229,900 Active 35 DOM
-
2026-06-16days on market $229,900 Active 34 DOM
-
2026-06-15days on market $229,900 Active 33 DOM
-
2026-06-13days on market $229,900 Active 31 DOM
-
2026-06-13days on market $229,900 Active 30 DOM
-
2026-06-09days on market $229,900 Active 27 DOM
-
2026-06-08days on market $229,900 Active 26 DOM
-
2026-06-07days on market $229,900 Active 25 DOM
-
2026-06-04days on market $229,900 Active 22 DOM
-
2026-06-03days on market $229,900 Active 21 DOM
-
2026-06-02days on market $229,900 Active 20 DOM
-
2026-06-01days on market $229,900 Active 19 DOM
-
2026-05-31days on market $229,900 Active 18 DOM
-
2026-05-13$229,900 Active
-
2026-05-12historical $229,900
-
2026-04-27historical
-
2025-11-04$225,000 Active
ⓘ Source: listings_history table (triggers on properties + properties_extension) + one-shot
backfill from property_details.listing_events for pre-trigger history.
Climate risk First Street
- Flood 1/10 Low FEMA zone X · 0% chance over 30 yrs
- Wildfire 1/10 Low
- Heat 5/10 Major 7 d/yr ≥89°F today · 24 d/yr by 30 yrs out
- Wind 1/10 Low
- Air quality 5/10 Major 7 unhealthy d/yr today · 9 by 30 yrs out
Nearby sold comps map
Loading sold comps map…
Walkable amenities ~0.75 mi
Loading nearby amenities…
Taxation est. · year 1
- Rental income
- $47,026
- − Mortgage interest
- −$12,878
- − Property taxes
- −$3,448
- − Insurance
- −$1,150
- − Repairs & maintenance
- −$3,762
- − Management
- −$3,762
- − Depreciation
- −$6,688
- Taxable income
- $15,338
- Est. tax owed @ 24.0%
- −$3,681
- After-tax cash flow
- $14,404/yr
For passive investors: Depreciation is non-cash, so a rental often shows a tax loss while cash-flowing — sheltering income. Rental losses are passive: they offset passive income freely, and up to $25,000/yr can offset ordinary (W-2) income if you actively participate and your MAGI is under $100k (phasing out to $0 by $150k); unused losses carry forward. On sale, claimed depreciation is recaptured at up to 25%, and gains may owe capital-gains tax (a 1031 exchange can defer both). Figures are a year-1 estimate at your 24.0% rate — not tax advice; consult a CPA.
Schools (NCES district)
- District
- Cypress Elementary
- NCES district ID
- 0610440
- Math proficiency
- 67% ▲ 1.00%
- Reading proficiency
- 69% ▲ 1.00%
- Median HH income
- $83,769
- Composite
- 62.21/100
- National rank
- #1446
- State rank
- #117 of 1400 in CA
Livability — Cypress
- Score
- 74/100
- State rank
- #141
- US rank
- #4900
Category grades
Schools grade is shown separately in the Schools card above.
Census & demographics
- Census place
- Cypress, CA
- County
- Orange County · 3,096,323 people
- City population
- 49,318
- Metro
- Los Angeles-Long Beach-Anaheim, CA
- Population (ZIP)
- 49,318
- Household income
- $130,154
- Rent vs Own
- Severe rent burden
- 1431.0
Population outlook (Orange County) Hauer SSP2
- Today (2025)
- 3,477,456 people
- By 2030
- 3,613,117 · +3.9%
- By 2040
- 3,835,945 · +10.3%
- By 2050
- 3,968,736 · +14.1%
- By 2075
- 4,097,053 · +17.8%
- By 2100
- 3,903,633 · +12.3%
Race, ethnicity, and origin ACS 2023
- Neighborhood character
- Highly diverse neighborhood (Simpson 0.71)
- Race & ethnicity
- Asian 37% White 31% Hispanic / Latino 22% Two or more races 14% Black 3%
- Hispanic origin (detail)
- Mexican 15%
- Common ancestry
- Lithuanian 2% Iranian 1% Italian 1%
- Foreign-born
- 31% · South Korea, Canada, China
- Languages at home
- 57% English-only · Spanish 12% Korean 11% Chinese 5%
Political lean MEDSL · Orange
- 2024 margin
- Toss-up / Even · D 49.7% · R 47.1% · Other 3.2%
- 2008→2024 swing
- +5.2pp toward D · 2008: -2.6pp · 2024: 2.6pp
- All cycles
- 2024: D+2.6 2020: D+9.0 2016: D+7.7 2012: R+8.3 2008: R+2.6
Not yet ingested
- Civics
- —
Market trends
- HPI YoY
- ▼ -870.99%
- Current HPI
- 402.6083
- Rent YoY
- ▲ 1.69%
- Metro
- Los Angeles-Long Beach-Anaheim, CA
- State GDP YoY
- ▲ 3.21%
- F500 in state
- 116
Industry mix (Fortune 500 HQ in CA)
| Industry | F500 HQs | Revenue |
|---|---|---|
| Technology | 27 | $1,492B |
|
||
| Financial Services | 3 | $174B |
|
||
| Retail | 3 | $44B |
|
||
| Insurance | 3 | $26B |
|
||
| Media / Entertainment | 2 | $115B |
|
||
| Pharmaceuticals / Biotech | 2 | $62B |
|
||
Price history
+2.2% since first listed4 events — show timeline
- 2026-05-13 Listed $229,900 CRMLS
- 2026-05-12 Coming Soon $229,900 CRMLS
- 2026-04-27 Listing Removed — CRMLS
- 2025-11-04 Listed $225,000 CRMLS
Property tax history
+0.5%/yrLatest (2025): $70 · +2.5% YoY. Source: county tax records.
Cash-flow waterfall
monthlySold comps — $/sqft
last 12 mo · ≤1 miLoading sold comps…