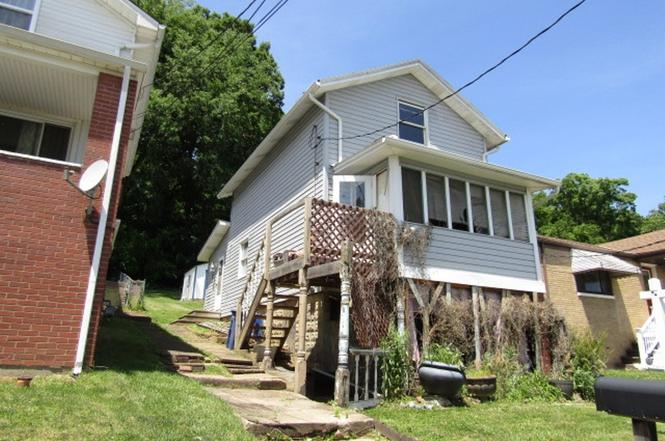
215 Patterson Ave · Bridgeville, PA
Flood risk 1/10 · Minimal
- FEMA flood zone
- X (unshaded)
- Chance of flooding over 30 yrs
- 0.0%
- Est. flood insurance / yr
- $473 – $860
Fire risk 1/10 · Minimal
- Est. fire insurance / yr
- $511 – $949
Heat risk 4/10 · Minor
- Hot days now (above 98°F)
- 7 days/yr
- Hot days in 30 yrs
- 17 days/yr
Wind risk 2/10 · Minimal
- Chance of severe wind over 30 yrs
- —
Air-quality risk 2/10 · Minimal
- Unhealthy air days now
- 0 days/yr
- Unhealthy air days in 30 yrs
- 3 days/yr
Risk factors via First Street. Map © Google.
Why this score? — see what drove the B grade
The composite is a weighted blend of 9 inputs, each scored 0–100. Each bar is that input's sub-score; the figure is the points it added to the 100-point composite (weight × sub-score).
- Cash flow +30.0/30.0
- 1% rule +10.0/10.0
- DSCR +10.0/10.0
- ARV discount +7.5/15.0
- Schools +4.1/10.0
- Livability +4.0/5.0
- Rent growth +2.5/5.0
- Condition / age +2.5/5.0
- Appreciation +0.0/10.0
$69,900
🖨 Deal sheet (PDF) 📄 Offer letter ✓ Due diligence
Listing remarks MLS
Great opportunity in Bridgeville! Blank slate! Bring your finishing touches!! Large semi fenced in backyard! Spacious Sunporch/Mud room! Hardwood flooring throughout could be refinished and gleaming again! Finished basement adds additional living and storage space! Centrally located!!
Key facts
- Finished space
- Flex area
- Game room
Tags
Property features AI
Finance
- HOA & community: Public transportation access
Exterior
- Parking: On-street parking
- Utilities: Gas heating (forced air)
- Home design: Two-story frame house; Resale property; Asphalt roof
- Construction: Frame construction; Asphalt roof
- Exterior features: 50- to 25-foot lot with approximate dimensions 25x120; Public transportation nearby
Interior
- Kitchen: Kitchen on main level (9x10)
- Bedrooms: Second bedroom on upper level (9x12); Additional bedroom-sized room on upper level (12x13)
- Flooring: Tile; Vinyl
- Bathrooms: One full bathroom
- Heating & cooling: Forced air heating; Gas heating
- Interior features: Tile and vinyl flooring; Finished full basement with walk-up access; Seven total rooms
Neighborhood map
What this means for you Summary
Snapshot
- This is a 2-bed/1.0-bath single-family listed at $70k.
Deal economics
- At list price, monthly cash flow is $599 ($7k/yr) — positive.
- The deal already cash-flows at list — no discount required.
- Meets the 1% rule at list price ($1k rent vs $70k).
- Cap rate 16.6% vs local median 4.1% in Bridgeville — top-decile yield for the area; either an underpriced asset or a hidden risk that comps aren't pricing in. Stress-test before assuming the spread holds.
Location & tenants
- Location reads 80/100 on livability (#199 in PA, #1,745 nationally) — a professional / high-income tenant draw. Strengths: cost of living A+, housing A+, amenities A; Watch: employment C-, commute F.
- Chartiers Valley SD (suburban): math 37% / reading 57% proficiency, ranked #221 of 539 in PA (top 41%) — families likely to look elsewhere, expect single-tenant / working-renter base with shorter leases.
- Zoned schools: Chartiers Valley Primary Sch (879 students, 30% FRL); Chartiers Valley Ms (math 20% / reading 55%, grade F, #292 of 512 statewide, top 58%, 718 students, 35% FRL); Chartiers Valley Hs (math 53% / reading 24%, grade F, #279 of 437 statewide, top 64%, 1,018 students, 25% FRL).
- Market conditions: 70 active listings in the ZIP; 2 comparable units currently listed for rent nearby; solid renter incomes; 2,996 units permitted in Allegheny County in 2024 (1,588 in 5+ unit buildings).
Forward outlook
- Local home prices are declining (-3.0%/yr); year-one equity from $483 of loan paydown is wiped out by about $2k of value loss. Plan a longer hold.
- At projected returns (-3.0% appreciation + 3.0% rent growth), your $20k cash investment doubles in ~4 years — after that, you're playing with house money.
Negotiation context
- Only 6 days on market — expect competitive offers; lowballing is unlikely to land.
- 2 sale attempts with the ask held roughly flat each time — persistent listings suggest the price (not the market) is what's stuck; bring a comps-based counter.
Risks & watch-outs
- Watch-outs: property tax is 3.2% of price; built in 1930 — expect roof / HVAC / electrical / plumbing capex.
Questions for the listing agent
- Built in 1930 — when were the roof, HVAC, electrical panel, plumbing, and water heater last replaced?
- Property tax is high relative to price — has the assessment been appealed recently, and will the sale trigger a re-assessment?
- Is there a deadline driving the sale (1031 exchange, divorce, estate, relocation)? That informs how much negotiation room exists.
- Schools are B-rated — typically a magnet for longer-tenancy family renters. What's the average tenant stay here, and is there a school-zone premium baked into asking?
- What's the average days-on-market for RENTAL listings here right now (not sales)? A rising rental-DOM trend means longer vacancies and softer asking-rent achievability than the comps imply.
- What's the recent tenant-quality profile in this submarket — average credit score on applications, eviction rate, late-payment / NSF rate, and stable-employment percentage? A property-management company in the area should have these aggregated.
- How much new for-sale + rental construction is in the pipeline within 1–3 miles? Heavy new supply typically softens prices + rents 12–24 months out; constrained supply supports both.
Investment metrics
- 1% rule
- 2.14% ✓
- Cap rate
- 16.57%
- Cash-on-cash
- 36.71%
- DSCR
- 2.63
- GRM
- 3.9
CMA / ARV
- ARV (on-the-fly)
- $165,664
- Comps found
- 10
Show comp detail 10 sales within ~0.75 mi
| Address | Dist | Beds/Ba | Sqft | Sold | Price | $/sf | Match |
|---|---|---|---|---|---|---|---|
| 730 Chess | 0.28mi | 2/1.0 | 960 (-3%) | 3mo | $159,999 | $167 | 79 |
| 726 Locust St | 0.25mi | 2/1.0 | 960 (-3%) | 21mo | $85,000 | $89 | 65 |
| 216 Hickman St | 0.20mi | 2/1.0 | 880 (-11%) | 8mo | $125,000 | $142 | 65 |
| 126 May Ave | 0.40mi | 3/1.0 (+1) | 1,101 (+11%) | 6mo | $174,900 | $159 | 53 |
| 665 Dewey Ave | 0.48mi | 2/1.5 | 875 (-12%) | 8mo | $185,000 | $211 | 49 |
| 297 Patterson Ave | 0.15mi | 3/1.0 (+1) | 1,125 (+13%) | 24mo | $215,000 | $191 | 46 |
| 299 Liberty St | 0.70mi | 2/1.0 | 1,031 (+4%) | 22mo | $150,000 | $145 | 43 |
| 122 Eisner Ave | 0.39mi | 3/1.0 (+1) | 1,105 (+11%) | 20mo | $185,900 | $168 | 41 |
| 901 Fryer | 0.67mi | 3/1.5 (+1) | 928 (-6%) | 14mo | $110,000 | $119 | 39 |
| 779 Bowerhill Rd | 0.69mi | 3/2.0 (+1) | 1,137 (+15%) | 8mo | $192,500 | $169 | 27 |
Match score weights: distance 35% · size 25% · config 20% · recency 20%. Top-matched comps best support the ARV.
Projected returns pro-forma
-3.0% appreciation · 3.0% rent growth · sell at horizon
- IRR
- 32.6%
- Equity multiple
- 2.37×
- Total profit
- $26,895
- Equity at exit
- $10,422
- IRR
- 39.7%
- Equity multiple
- 4.72×
- Total profit
- $72,873
- Equity at exit
- $6,044
Cash invested: $19,572 (down + closing). Projections, not guarantees.
Landlord ↔ Tenant lean methodology
- Overall (STATE)
- 62 Landlord-Friendly
- State Pennsylvania
- 62 Landlord-Friendly · EVEN
- County
- — inherits STATE
- City
- — inherits STATE
ZIP-level market 15017
- Home prices YoY
- -31.8%
- Active inventory
- 70
- Price-to-rent
- 3.9×
Monthly cashflow live
- Estimated rent
- $1,498 medium interval (Pro) →
- Mortgage (P&I)
- −$367
- Tax from tax record
- −$189 /mo · $2,270/yr
- Insurance
- −$29
- HOA
- −$0
- Vacancy / Maint / Mgmt
- −$315
- Net cashflow
- $599
Break-even live
Sensitivity live
| Price | -10% $638 | -5% $619 | +0% $599 | +5% $579 | +10% $559 |
|---|---|---|---|---|---|
| Rent | -10% $480 | -5% $540 | +0% $599 | +5% $658 | +10% $717 |
| Rate | -1.0pp $634 | -0.5pp $617 | base $599 | +0.5pp $581 | +1.0pp $562 |
UW: 25.0% down · 7.5% · 30yr · 1.5% tax · 5.0% vac · 8.0% maint · 8.0% mgmt
Financing live
Cash to close
- Down payment
- $17,475
- Closing costs
- $2,097
- Reserves months
- —
- Total cash needed
- —
Loan-product check · same deal, 3 products live
Conventional
25% down · 7.5% · 30yr
- Down + closing
- —
- Monthly P&I
- —
- Monthly cashflow
- —
- DSCR
- —
- Eligible?
- —
Personal DTI + credit; lowest rate.
DSCR
20% down · 8.5% · 30yr
- Down + closing
- —
- Monthly P&I
- —
- Monthly cashflow
- —
- DSCR
- —
- Eligible?
- —
No personal income docs; deal must DSCR.
Hard money
10% down · 12.0% · 12mo
- Down + closing
- —
- Monthly P&I
- —
- Monthly cashflow
- —
- DSCR
- —
- Eligible?
- —
Short-term bridge; refi at stabilization.
Rent comps 2 comps
| Address | Beds | Baths | Sqft | Rent | $/sqft | DOM | Units | Dist |
|---|---|---|---|---|---|---|---|---|
| 1001 Grandview Ave #508 Bridgeville, PA | 1.0 | 1.0 | 855 | $995 | $1.16 | 14d | 1 | 0.76mi |
| 2200 Alpha Dr Bridgeville, PA | 1.0–3.0 | 1.0–2.0 | 1016 | $2,228 | $2.19 | 4d | 30 | 0.78mi |
Listing history 5 events
-
2026-06-21days on market $69,900 Active 6 DOM
-
2026-06-18days on market $69,900 Active 3 DOM
-
2026-06-17days on market $69,900 Active 2 DOM
-
2026-06-16remarks 544-char remark
-
2026-06-16$69,900 Active 1 DOM
ⓘ Source: listings_history table (triggers on properties + properties_extension) + one-shot
backfill from property_details.listing_events for pre-trigger history.
Tax reassessment forecast PA · Partial reset (capped growth)
- Current annual tax
- $2,270 · $189/mo
- Projected year-2 tax
- $2,270 · $189/mo
- Expected delta
- $0/yr ($0/mo · 0.0%)
ⓘ Screening estimate from a state-policy table — verify with the county assessor before closing.
Climate risk First Street
- Flood 1/10 Low FEMA zone X (unshaded) · 0% chance over 30 yrs
- Wildfire 1/10 Low
- Heat 4/10 Moderate 7 d/yr ≥98°F today · 17 d/yr by 30 yrs out
- Wind 2/10 Low
- Air quality 2/10 Low 0 unhealthy d/yr today · 3 by 30 yrs out
Nearby sold comps map
Loading sold comps map…
Walkable amenities ~0.75 mi
Loading nearby amenities…
Taxation est. · year 1
- Rental income
- $17,979
- − Mortgage interest
- −$3,915
- − Property taxes
- −$2,270
- − Insurance
- −$350
- − Repairs & maintenance
- −$1,438
- − Management
- −$1,438
- − Depreciation
- −$2,033
- Taxable income
- $6,534
- Est. tax owed @ 24.0%
- −$1,568
- After-tax cash flow
- $5,617/yr
For passive investors: Depreciation is non-cash, so a rental often shows a tax loss while cash-flowing — sheltering income. Rental losses are passive: they offset passive income freely, and up to $25,000/yr can offset ordinary (W-2) income if you actively participate and your MAGI is under $100k (phasing out to $0 by $150k); unused losses carry forward. On sale, claimed depreciation is recaptured at up to 25%, and gains may owe capital-gains tax (a 1031 exchange can defer both). Figures are a year-1 estimate at your 24.0% rate — not tax advice; consult a CPA.
Schools (NCES district)
- District
- Chartiers Valley SD
- NCES district ID
- 4205700
- Math proficiency
- 37% ▼ -16.00%
- Reading proficiency
- 57% ▼ -17.00%
- Median HH income
- $57,191
- Composite
- 40.91/100
- National rank
- #3614
- State rank
- #221 of 539 in PA
Livability — Bridgeville
- Score
- 80/100
- State rank
- #199
- US rank
- #1745
Category grades
Schools grade is shown separately in the Schools card above.
Census & demographics
- Census place
- Bridgeville, PA
- County
- Allegheny County · 1,022,028 people
- City population
- 17,782
- Metro
- Pittsburgh, PA
- Population (ZIP)
- 17,782
- Household income
- $86,937
- Rent vs Own
- Severe rent burden
- 454.0
Population outlook (Allegheny County) Hauer SSP2
- Today (2025)
- 1,250,282 people
- By 2030
- 1,256,482 · +0.5%
- By 2040
- 1,256,318 · +0.5%
- By 2050
- 1,244,169 · -0.5%
- By 2075
- 1,197,693 · -4.2%
- By 2100
- 1,093,187 · -12.6%
Race, ethnicity, and origin ACS 2023
- Neighborhood character
- Predominantly White (86%)
- Race & ethnicity
- White 86% Asian 5% Two or more races 4% Black 4% Hispanic / Latino 2%
- Common ancestry
- Romanian 8% Lithuanian 2% Slovak 2%
- Foreign-born
- 5% · Canada, China, South Korea
- Languages at home
- 94% English-only · Other Indo-European 3% Spanish 1% Chinese 1%
Political lean MEDSL · Allegheny
- 2024 margin
- Strong D (+20.3) · D 59.7% · R 39.4%
- 2008→2024 swing
- +4.8pp toward D · 2008: 15.5pp · 2024: 20.3pp
- All cycles
- 2024: D+20.3 2020: D+20.4 2016: D+16.4 2012: D+14.4 2008: D+15.5
Not yet ingested
- Civics
- —
Market trends
- HPI YoY
- ▼ -118.46%
- Current HPI
- 254.0465
- Rent YoY
- —
- Metro
- Pittsburgh, PA
- State GDP YoY
- ▲ 1.68%
- F500 in state
- 34
Industry mix (Fortune 500 HQ in PA)
| Industry | F500 HQs | Revenue |
|---|---|---|
| Healthcare | 2 | $309B |
|
||
| Insurance | 2 | $27B |
|
||
| Telecommunications / Media | 1 | $124B |
|
||
| Industrial Distribution | 1 | $22B |
|
||
| Financial Services | 1 | $20B |
|
||
| Chemicals / Materials | 1 | $18B |
|
||
Price history
-7.9% since first listed8 events — show timeline
- 2026-06-12 Listed $69,900 West Penn MLS
- 2026-01-13 Delisted — West Penn MLS
- 2025-02-04 Contingent — West Penn MLS
- 2025-01-14 Listed $39,900 West Penn MLS
- 2024-10-28 Price Changed $69,000 West Penn MLS
- 2024-08-10 Price Changed $70,900 West Penn MLS
- 2024-07-13 Price Changed $73,900 West Penn MLS
- 2024-07-02 Price Changed $75,900 West Penn MLS
Property tax history
+2.5%/yrLatest (2026): $2,270 · +0.0% YoY. Source: county tax records.
Cash-flow waterfall
monthlySold comps — $/sqft
last 12 mo · ≤1 miLoading sold comps…