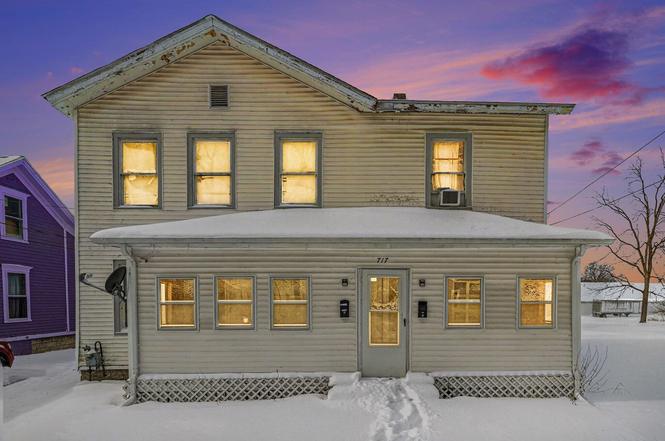
717 N Eaton St · Albion, MI
Flood risk 1/10 · Minimal
- FEMA flood zone
- X (unshaded)
- Chance of flooding over 30 yrs
- 0.0%
- Est. flood insurance / yr
- $473 – $860
Fire risk 3/10 · Minor
- Est. fire insurance / yr
- $784 – $1,456
Heat risk 3/10 · Minor
- Hot days now (above 97°F)
- 7 days/yr
- Hot days in 30 yrs
- 16 days/yr
Wind risk 2/10 · Minimal
- Chance of severe wind over 30 yrs
- —
Air-quality risk 2/10 · Minimal
- Unhealthy air days now
- 1 days/yr
- Unhealthy air days in 30 yrs
- 2 days/yr
Risk factors via First Street. Map © Google.
Why this score? — see what drove the B- grade
The composite is a weighted blend of 9 inputs, each scored 0–100. Each bar is that input's sub-score; the figure is the points it added to the 100-point composite (weight × sub-score).
- Cash flow +30.0/30.0
- 1% rule +10.0/10.0
- DSCR +10.0/10.0
- ARV discount +7.5/15.0
- Livability +3.5/5.0
- Schools +3.1/10.0
- Rent growth +2.5/5.0
- Condition / age +2.5/5.0
- Appreciation +0.0/10.0
$54,900
🖨 Deal sheet (PDF) 📄 Offer letter ✓ Due diligence
Listing remarks MLS
Cash or Renovation Financing * * * Investor or House hack opportunity. 2-unit home, 2Bedroom each unit. Townhouse style units with living quarters on the main level and bedrooms on the upper level. Home needs some work but offers great potential. Call for more details,
Key facts
- 6,098 sq ft lot
- 2 parking spots
- Built 1880
Property features AI
Exterior
- Parking: 2 parking spaces
- Utilities: Public water; Public sewer; Electricity connected; Natural gas connected
- Home design: Multi-family residential income property
- Construction: Vinyl siding construction
- Exterior features: Vinyl siding; Lot approximately 44.58 x 132 ft (0.14 acres)
Interior
- Heating & cooling: Forced air heating; Natural gas heating
- Interior features: Has basement with full and crawl space
Neighborhood map
What this means for you Summary
Snapshot
- This is a 4-bed/2.0-bath single-family listed at $55k.
Deal economics
- At list price, monthly cash flow is $816 ($10k/yr) — positive.
- The deal already cash-flows at list — no discount required.
- Meets the 1% rule at list price ($2k rent vs $55k).
- Recommended offer: $53k (3.0% below list) — sets the bar for market timing.
- Cap rate 24.1% vs local median 8.3% in Albion — top-decile yield for the area; either an underpriced asset or a hidden risk that comps aren't pricing in. Stress-test before assuming the spread holds.
Location & tenants
- Location reads 70/100 on livability (#328 in MI) — a middle-class / working-renter tenant base. Strengths: cost of living A+, housing A+, health & safety A+; Watch: commute C-, amenities D+, crime F.
- Marshall Public Schools (town): math 28% / reading 44% proficiency, ranked #268 of 540 in MI (top 50%) — families likely to look elsewhere, expect single-tenant / working-renter base with shorter leases.
- Zoned schools: Marshall Middle School (math 22% / reading 40%, grade F, #329 of 493 statewide, top 67%, 547 students, 50% FRL).
- Market conditions: 137 active listings in the ZIP; 1 comparable units currently listed for rent nearby; 132 units permitted in Calhoun County in 2024 (0 in 5+ unit buildings).
Forward outlook
- Local home prices are declining (-3.0%/yr); year-one equity from $380 of loan paydown is wiped out by about $2k of value loss. Plan a longer hold.
- Calhoun County population projected at -16% by 2050 — secular population decline; favor cash flow + early exit over multi-decade hold.
- At projected returns (-3.0% appreciation + 3.0% rent growth), your $15k cash investment doubles in ~2 years — after that, you're playing with house money.
Negotiation context
- It's been on market 57 days — a 3% lower offer ($53k) is reasonable based on typical stale-listing flexibility.
- 4 sale attempts; this cycle's ask has dropped $22k (29%) from the opening price — seller is motivated, your offer sets the floor, not the list.
Risks & watch-outs
- Watch-outs: built in 1880 — expect roof / HVAC / electrical / plumbing capex.
Questions for the listing agent
- It's been on market 57 days. Have you received any prior offers? Is the seller open to a 3% concession, seller financing, or rate buy-down credit?
- Built in 1880 — when were the roof, HVAC, electrical panel, plumbing, and water heater last replaced?
- Is there a deadline driving the sale (1031 exchange, divorce, estate, relocation)? That informs how much negotiation room exists.
- Schools are F-rated, which usually means shorter tenancies and higher turnover. Who's the typical renter profile here, and what's been the actual vacancy rate?
- Crime grade is F in this area — have there been break-ins, vandalism, or insurance claims at this property in the last 3 years? What carrier currently insures it and at what premium?
- What's the average days-on-market for RENTAL listings here right now (not sales)? A rising rental-DOM trend means longer vacancies and softer asking-rent achievability than the comps imply.
- What's the recent tenant-quality profile in this submarket — average credit score on applications, eviction rate, late-payment / NSF rate, and stable-employment percentage? A property-management company in the area should have these aggregated.
- How much new for-sale + rental construction is in the pipeline within 1–3 miles? Heavy new supply typically softens prices + rents 12–24 months out; constrained supply supports both.
Investment metrics
- 1% rule
- 2.73% ✓
- Cap rate
- 24.13%
- Cash-on-cash
- 63.72%
- DSCR
- 3.84
- GRM
- 3.0
CMA / ARV
- ARV (on-the-fly)
- $138,828
- Comps found
- 12
Show comp detail 12 sales within ~0.75 mi
| Address | Dist | Beds/Ba | Sqft | Sold | Price | $/sf | Match |
|---|---|---|---|---|---|---|---|
| 823 N Clinton St | 0.15mi | 4/2.0 | 1,928 (-4%) | 11mo | $174,900 | $91 | 76 |
| 307 Arthur St | 0.12mi | 4/2.0 | 2,112 (+5%) | 20mo | $40,000 | $19 | 69 |
| 1101 Terpenning St | 0.49mi | 4/2.0 | 1,989 (-1%) | 12mo | $182,000 | $92 | 66 |
| 925 N Eaton St | 0.21mi | 4/1.0 | 1,925 (-4%) | 17mo | $40,000 | $21 | 65 |
| 501 W Cass St | 0.41mi | 4/2.0 | 1,820 (-10%) | 7mo | $124,900 | $69 | 59 |
| 817 N Monroe St | 0.32mi | 3/3.0 (-1) | 2,016 (+0%) | 21mo | $120,000 | $60 | 58 |
| 808 Carson St | 0.19mi | 4/1.0 | 1,744 (-13%) | 12mo | $45,000 | $26 | 55 |
| 309 Bidwell St | 0.60mi | 4/2.0 | 1,933 (-4%) | 18mo | $49,000 | $25 | 50 |
| 1035 Maple St | 0.66mi | 3/2.0 (-1) | 1,865 (-7%) | 4mo | $225,395 | $121 | 48 |
| 501 Bidwell St | 0.58mi | 4/2.0 | 1,804 (-10%) | 15mo | $98,000 | $54 | 43 |
| 801 Maple St | 0.50mi | 3/2.0 (-1) | 1,864 (-7%) | 20mo | $185,000 | $99 | 42 |
| 305 Perry St | 0.47mi | 3/2.5 (-1) | 1,762 (-12%) | 11mo | $215,000 | $122 | 41 |
Match score weights: distance 35% · size 25% · config 20% · recency 20%. Top-matched comps best support the ARV.
Projected returns pro-forma
-3.0% appreciation · 3.0% rent growth · sell at horizon
- IRR
- 62.8%
- Equity multiple
- 3.80×
- Total profit
- $43,106
- Equity at exit
- $8,186
- IRR
- 67.3%
- Equity multiple
- 7.80×
- Total profit
- $104,542
- Equity at exit
- $4,747
Cash invested: $15,372 (down + closing). Projections, not guarantees.
Landlord ↔ Tenant lean methodology
- Overall (STATE)
- 62 Landlord-Friendly
- State Michigan
- 62 Landlord-Friendly · EVEN
- County
- — inherits STATE
- City
- — inherits STATE
ZIP-level market 49224
- Home prices YoY
- -24.9%
- Active inventory
- 137
- Price-to-rent
- 3.0×
Monthly cashflow live
- Estimated rent
- $1,501 medium interval (Pro) →
- Mortgage (P&I)
- −$288
- Tax from tax record
- −$59 /mo · $706/yr
- Insurance
- −$23
- HOA
- −$0
- Vacancy / Maint / Mgmt
- −$315
- Net cashflow
- $816
Break-even live
Sensitivity live
| Price | -10% $847 | -5% $832 | +0% $816 | +5% $801 | +10% $785 |
|---|---|---|---|---|---|
| Rent | -10% $698 | -5% $757 | +0% $816 | +5% $876 | +10% $935 |
| Rate | -1.0pp $844 | -0.5pp $830 | base $816 | +0.5pp $802 | +1.0pp $788 |
UW: 25.0% down · 7.5% · 30yr · 1.5% tax · 5.0% vac · 8.0% maint · 8.0% mgmt
Financing live
Cash to close
- Down payment
- $13,725
- Closing costs
- $1,647
- Reserves months
- —
- Total cash needed
- —
Loan-product check · same deal, 3 products live
Conventional
25% down · 7.5% · 30yr
- Down + closing
- —
- Monthly P&I
- —
- Monthly cashflow
- —
- DSCR
- —
- Eligible?
- —
Personal DTI + credit; lowest rate.
DSCR
20% down · 8.5% · 30yr
- Down + closing
- —
- Monthly P&I
- —
- Monthly cashflow
- —
- DSCR
- —
- Eligible?
- —
No personal income docs; deal must DSCR.
Hard money
10% down · 12.0% · 12mo
- Down + closing
- —
- Monthly P&I
- —
- Monthly cashflow
- —
- DSCR
- —
- Eligible?
- —
Short-term bridge; refi at stabilization.
Rent comps 1 comps
| Address | Beds | Baths | Sqft | Rent | $/sqft | DOM | Units | Dist |
|---|---|---|---|---|---|---|---|---|
| 1200 Westover Blvd Albion, MI | 3.0–4.0 | 2.0 | 1456 | $1,501 | $1.03 | 45d | 4 | 1.23mi |
Listing history 16 events
-
2026-04-29status Pending 271-char remark
Show marketing remark (271 chars)
Cash or Renovation Financing * * * Investor or House hack opportunity. 2-unit home, 2Bedroom each unit. Townhouse style units with living quarters on the main level and bedrooms on the upper level. Home needs some work but offers great potential. Call for more details,
-
2026-04-29status Pending
Show marketing remark (271 chars)
Cash or Renovation Financing * * * Investor or House hack opportunity. 2-unit home, 2Bedroom each unit. Townhouse style units with living quarters on the main level and bedrooms on the upper level. Home needs some work but offers great potential. Call for more details,
-
2026-04-14price $54,900 271-char remark
Show marketing remark (271 chars)
Cash or Renovation Financing * * * Investor or House hack opportunity. 2-unit home, 2Bedroom each unit. Townhouse style units with living quarters on the main level and bedrooms on the upper level. Home needs some work but offers great potential. Call for more details,
-
2026-04-13price $54,900
-
2026-03-31price $59,900 271-char remark
Show marketing remark (271 chars)
Cash or Renovation Financing * * * Investor or House hack opportunity. 2-unit home, 2Bedroom each unit. Townhouse style units with living quarters on the main level and bedrooms on the upper level. Home needs some work but offers great potential. Call for more details,
-
2026-03-30price $59,900
-
2026-03-05price $64,900 271-char remark
Show marketing remark (271 chars)
Cash or Renovation Financing * * * Investor or House hack opportunity. 2-unit home, 2Bedroom each unit. Townhouse style units with living quarters on the main level and bedrooms on the upper level. Home needs some work but offers great potential. Call for more details,
-
2026-03-04price $64,900
-
2026-03-03$77,000 Active 271-char remark
Show marketing remark (271 chars)
Cash or Renovation Financing * * * Investor or House hack opportunity. 2-unit home, 2Bedroom each unit. Townhouse style units with living quarters on the main level and bedrooms on the upper level. Home needs some work but offers great potential. Call for more details,
-
2026-03-03$77,000 Active
Show marketing remark (271 chars)
Cash or Renovation Financing * * * Investor or House hack opportunity. 2-unit home, 2Bedroom each unit. Townhouse style units with living quarters on the main level and bedrooms on the upper level. Home needs some work but offers great potential. Call for more details,
-
2026-02-28historical
-
2026-02-27historical
-
2026-02-14price $77,000
-
2026-02-13price $77,000
-
2026-01-28$84,900 Active
-
2026-01-28$84,900 Active
ⓘ Source: listings_history table (triggers on properties + properties_extension) + one-shot
backfill from property_details.listing_events for pre-trigger history.
Tax reassessment forecast MI · Partial reset (capped growth)
- Current annual tax
- $706 · $59/mo
- Projected year-2 tax
- $776 · $65/mo
- Expected delta
- +$70/yr (+$6/mo · 9.9%)
ⓘ Screening estimate from a state-policy table — verify with the county assessor before closing.
Climate risk First Street
- Flood 1/10 Low FEMA zone X (unshaded) · 0% chance over 30 yrs
- Wildfire 3/10 Moderate
- Heat 3/10 Moderate 7 d/yr ≥97°F today · 16 d/yr by 30 yrs out
- Wind 2/10 Low
- Air quality 2/10 Low 1 unhealthy d/yr today · 2 by 30 yrs out
Nearby sold comps map
Loading sold comps map…
Walkable amenities ~0.75 mi
Loading nearby amenities…
Taxation est. · year 1
- Rental income
- $18,012
- − Mortgage interest
- −$3,075
- − Property taxes
- −$706
- − Insurance
- −$274
- − Repairs & maintenance
- −$1,441
- − Management
- −$1,441
- − Depreciation
- −$1,597
- Taxable income
- $9,478
- Est. tax owed @ 24.0%
- −$2,275
- After-tax cash flow
- $7,520/yr
For passive investors: Depreciation is non-cash, so a rental often shows a tax loss while cash-flowing — sheltering income. Rental losses are passive: they offset passive income freely, and up to $25,000/yr can offset ordinary (W-2) income if you actively participate and your MAGI is under $100k (phasing out to $0 by $150k); unused losses carry forward. On sale, claimed depreciation is recaptured at up to 25%, and gains may owe capital-gains tax (a 1031 exchange can defer both). Figures are a year-1 estimate at your 24.0% rate — not tax advice; consult a CPA.
Schools (NCES district)
- District
- Marshall Public Schools
- NCES district ID
- 2622970
- Math proficiency
- 28% ▼ -4.00%
- Reading proficiency
- 44% ▼ -2.00%
- Median HH income
- $48,020
- Composite
- 30.93/100
- National rank
- #6112
- State rank
- #268 of 540 in MI
Livability — Albion
- Score
- 70/100
- State rank
- #328
- US rank
- #8096
Category grades
Schools grade is shown separately in the Schools card above.
Census & demographics
- Census place
- Albion, MI
- Population (ZIP)
- 13,309
Population outlook (Calhoun County) Hauer SSP2
- Today (2025)
- 130,157 people
- By 2030
- 126,691 · -2.7%
- By 2040
- 118,517 · -8.9%
- By 2050
- 109,855 · -15.6%
- By 2075
- 90,486 · -30.5%
- By 2100
- 70,766 · -45.6%
Race, ethnicity, and origin ACS 2023
- Neighborhood character
- Predominantly White (69%)
- Race & ethnicity
- White 69% Black 20% Two or more races 6% Hispanic / Latino 5%
- Common ancestry
- Romanian 3% Lithuanian 1% Iranian 1%
- Foreign-born
- 1% · Canada
- Languages at home
- 96% English-only · Spanish 2% Arabic 1% German/W. Germanic 1%
Political lean MEDSL · Calhoun
- 2024 margin
- R (+14.1) · D 42.3% · R 56.4% · Other 1.3%
- 2008→2024 swing
- -23.4pp toward R · 2008: 9.4pp · 2024: -14.1pp
- All cycles
- 2024: R+14.1 2020: R+11.1 2016: R+12.5 2012: D+1.6 2008: D+9.4
Not yet ingested
- Civics
- —
Market trends
- HPI YoY
- ▼ -67.85%
- Current HPI
- 205.078
- Rent YoY
- —
- Metro
- —
- State GDP YoY
- ▲ 1.37%
- F500 in state
- 28
Industry mix (Fortune 500 HQ in MI)
| Industry | F500 HQs | Revenue |
|---|---|---|
| Automotive Parts | 3 | $48B |
|
||
| Automotive | 2 | $372B |
|
||
| Chemicals | 1 | $45B |
|
||
| Automotive Retail | 1 | $29B |
|
||
| Healthcare / Medical Devices | 1 | $23B |
|
||
| Automotive Technology | 1 | $20B |
|
||
Price history
-35.3% since first listed16 events — show timeline
- 2026-04-29 Pending — MiRealSource-MiMLS
- 2026-04-29 Pending — REALCOMP
- 2026-04-14 Price Changed $54,900 MiRealSource-MiMLS
- 2026-04-13 Price Changed $54,900 REALCOMP
- 2026-03-31 Price Changed $59,900 MiRealSource-MiMLS
- 2026-03-30 Price Changed $59,900 REALCOMP
- 2026-03-05 Price Changed $64,900 MiRealSource-MiMLS
- 2026-03-04 Price Changed $64,900 REALCOMP
- 2026-03-03 Listed $77,000 REALCOMP
- 2026-03-03 Listed $77,000 MiRealSource-MiMLS
- 2026-02-28 Listing Removed — MiRealSource-MiMLS
- 2026-02-27 Listing Removed — REALCOMP
- 2026-02-14 Price Changed $77,000 MiRealSource-MiMLS
- 2026-02-13 Price Changed $77,000 REALCOMP
- 2026-01-28 Listed $84,900 REALCOMP
- 2026-01-28 Listed $84,900 MiRealSource-MiMLS
Property tax history
-9.9%/yrLatest (2025): $706 · -50.5% YoY. Source: county tax records.
Cash-flow waterfall
monthlySold comps — $/sqft
last 12 mo · ≤1 miLoading sold comps…