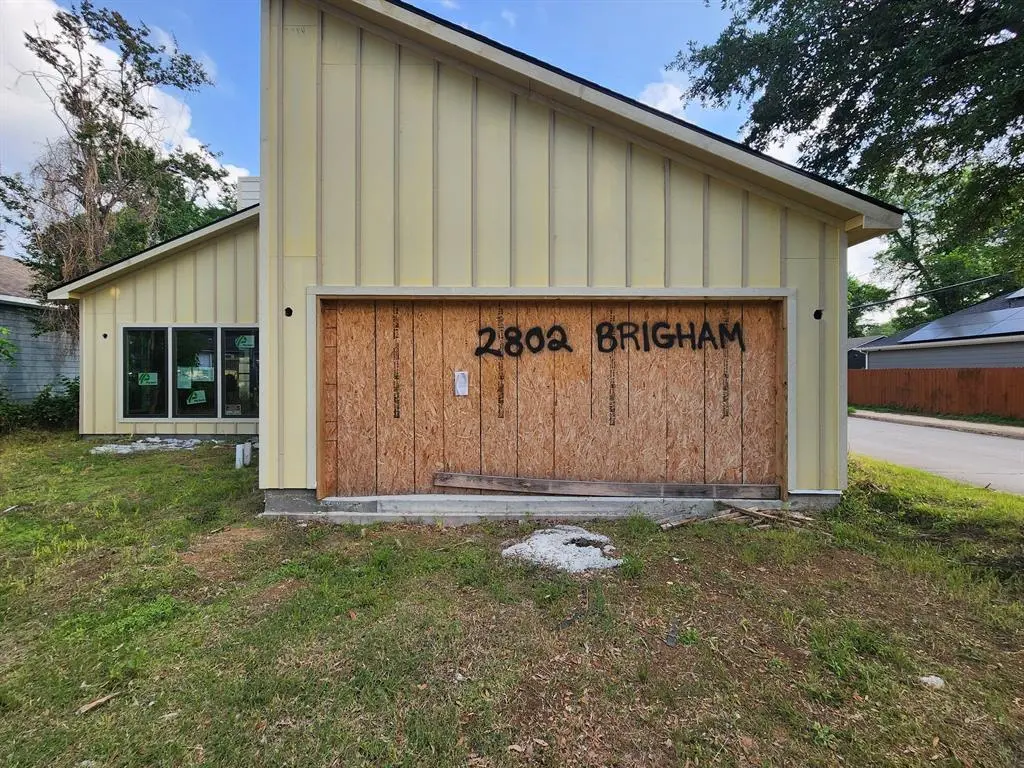
2802 Brigham Ln · Dallas, TX
Flood risk 6/10 · Moderate
- FEMA flood zone
- X (shaded)
- Chance of flooding over 30 yrs
- 0.68%
- Est. flood insurance / yr
- $507 – $1,088
Fire risk 3/10 · Minor
- Est. fire insurance / yr
- $1,222 – $2,270
Heat risk 7/10 · Major
- Hot days now (above 110°F)
- 7 days/yr
- Hot days in 30 yrs
- 24 days/yr
Wind risk 6/10 · Moderate
- Chance of severe wind over 30 yrs
- 27.0%
Air-quality risk 3/10 · Minor
- Unhealthy air days now
- 2 days/yr
- Unhealthy air days in 30 yrs
- 3 days/yr
Risk factors via First Street. Map © Google.
Why this score? — see what drove the A- grade
The composite is a weighted blend of 9 inputs, each scored 0–100. Each bar is that input's sub-score; the figure is the points it added to the 100-point composite (weight × sub-score).
- Cash flow +30.0/30.0
- ARV discount +15.0/15.0
- DSCR +10.0/10.0
- 1% rule +9.9/10.0
- Appreciation +5.4/10.0
- Rent growth +4.3/5.0
- Livability +4.0/5.0
- Schools +2.8/10.0
- Condition / age +2.5/5.0
$149,000
🖨 Deal sheet 📄 Offer letter ✓ Due diligence
Listing remarks
* * THE SELLER HAS ACCEPTED AND OFFER AND THE CONTRACT IT PENDING FINAL SIGNATURES. * * Partially constructed home ready for the next phase in Dallas. This property is being sold as-is and will require completion by the buyer. Current status, condition, and extent of construction are unknown and not guaranteed. Buyer to independently verify all information including but not limited to permits, zoning, building requirements, utilities, square footage, and overall feasibility of completing construction. Great opportunity for investors or builders looking to take over and finish out a project. Bring your vision and due diligence.
Key facts
- 6,011 sq ft lot
- 2 garage spots
- Built 2025
Property features AI
Finance
- Other: Property listed as residential single-family; Transaction type: For Sale
- Financial info: Listing terms include Cash and FHA-203K; No second mortgage indicated
- HOA & community: No homeowners association
Exterior
- Parking: Attached garage with 2 covered/garage spaces
- Utilities: City water; City sewer; Not in a municipal utility district
- Home design: Single-family residence; New construction (incomplete), year built 2025; One story
- Construction: New construction - incomplete (2025)
- Exterior features: Lot under 0.5 acre (approximately 0.138 acre); Subdivision: Jones & Johnson
Interior
- Kitchen: No appliances listed
- Bedrooms: 4 bedrooms (primary bedroom on main level)
- Bathrooms: 2 full bathrooms
- Heating & cooling: No heating; No cooling
- Interior features: Open floorplan; One level
- Laundry & utility: No laundry appliances listed
Neighborhood map
What this means for you Summary
Snapshot
- This is a 4-bed/2.0-bath land listed at $149k.
Deal economics
- At list price, monthly cash flow is $805 ($10k/yr) — positive.
- The deal already cash-flows at list — no discount required.
- Meets the 1% rule at list price ($2k rent vs $149k).
- Recommended offer: $147k (1.5% below list) — sets the bar for market timing.
- Cap rate 12.8% vs local median 2.3% in Dallas — top-decile yield for the area; either an underpriced asset or a hidden risk that comps aren't pricing in. Stress-test before assuming the spread holds.
Location & tenants
- Location reads 81/100 on livability (#24 in TX, #1,380 nationally) — a professional / high-income tenant draw. Strengths: amenities A+, commute A+, housing A+; Watch: crime F.
- Dallas ISD (urban): math 31% / reading 36% proficiency, ranked #559 of 826 in TX (top 68%) — families likely to look elsewhere, expect single-tenant / working-renter base with shorter leases; 83% free/reduced lunch — lower-income household profile, screen leases tightly.
- Zoned schools: Paul L Dunbar Learning Center (math 27% / reading 22%, grade F, #3,052 of 4,322 statewide, top 74%, 531 students, 95% FRL).
- Market conditions: Rents rising fast (+7.2%/yr); 248 active listings in the ZIP; 40 comparable units currently listed for rent nearby; rentals at typical pace (median 24d on market — plan ~3-4 weeks tenant-placement turnaround); 12,577 units permitted in Dallas County in 2024 (6,829 in 5+ unit buildings).
- At $2,227/mo this rent would consume 59% of the median local household income ($46k/yr) (locally 1464% of renters already pay >50% of income on rent) — very limited rent-growth headroom before tenants either downsize or default.
Forward outlook
- In year one you build about $2k of equity ($1k loan paydown + $1k appreciation (0.8% local appreciation)).
- Dallas County population projected at +35% by 2050 — long-run rental-demand tailwind backs the buy-and-hold thesis.
- At projected returns (0.8% appreciation + 7.2% rent growth), your $42k cash investment doubles in ~4 years — after that, you're playing with house money.
Negotiation context
- It's been on market 22 days — a 2% lower offer ($147k) is reasonable based on typical stale-listing flexibility.
- 2 sale attempts since 12y ago with the ask held roughly flat each time — persistent listings suggest the price (not the market) is what's stuck; bring a comps-based counter.
Risks & watch-outs
- Climate carrying-cost: major flood risk; major wind risk, 27% chance of damaging wind over 30y; extreme-heat days projected 7→24/yr by 2055 (HVAC capex compounding) — expect insurance premiums to compound above CPI over the hold.
Questions for the listing agent
- Is there a deadline driving the sale (1031 exchange, divorce, estate, relocation)? That informs how much negotiation room exists.
- Crime grade is F in this area — have there been break-ins, vandalism, or insurance claims at this property in the last 3 years? What carrier currently insures it and at what premium?
- What's the average days-on-market for RENTAL listings here right now (not sales)? A rising rental-DOM trend means longer vacancies and softer asking-rent achievability than the comps imply.
- What's the recent tenant-quality profile in this submarket — average credit score on applications, eviction rate, late-payment / NSF rate, and stable-employment percentage? A property-management company in the area should have these aggregated.
- How much new for-sale + rental construction is in the pipeline within 1–3 miles? Heavy new supply typically softens prices + rents 12–24 months out; constrained supply supports both.
Investment metrics
- 1% rule
- 1.49% ✓
- Cap rate
- 12.77%
- Cash-on-cash
- 23.14%
- DSCR
- 2.03
- GRM
- 5.6
CMA / ARV
- ARV (median comp)
- $258,169
- List price
- $149,000
- Delta
- -42.29%
- Verdict
- UNDERPRICED
- Comps
- 20 within 1.0 mi
Projected returns pro-forma
0.79% appreciation · 7.19% rent growth · sell at horizon
- IRR
- 28.3%
- Equity multiple
- 2.49×
- Total profit
- $62,273
- Equity at exit
- $49,238
- IRR
- 33.5%
- Equity multiple
- 5.56×
- Total profit
- $190,054
- Equity at exit
- $64,192
Cash invested: $41,720 (down + closing). Projections, not guarantees.
Landlord ↔ Tenant lean methodology
- Overall (STATE)
- 87 Strongly Landlord-Friendly
- State Texas
- 87 Strongly Landlord-Friendly · R+5
- County
- — inherits STATE
- City
- — inherits STATE
ZIP-level market 75215
- Home prices YoY
- 0.3%
- Rents YoY
- 7.2%
- Active inventory
- 248
- Price-to-rent
- 5.6×
Monthly cashflow live
- Estimated rent
- $2,227 high interval (Pro) →
- Mortgage (P&I)
- −$781
- Tax from tax record
- −$111 /mo · $1,336/yr
- Insurance
- −$62
- HOA
- −$0
- Vacancy / Maint / Mgmt
- −$468
- Net cashflow
- $805
Break-even live
UW: 25.0% down · 7.5% · 30yr · 1.5% tax · 5.0% vac · 8.0% maint · 8.0% mgmt
Financing live
Cash to close
- Down payment
- $37,250
- Closing costs
- $4,470
- Reserves months
- —
- Total cash needed
- —
Loan-product check · same deal, 3 products live
Conventional
25% down · 7.5% · 30yr
- Down + closing
- —
- Monthly P&I
- —
- Monthly cashflow
- —
- DSCR
- —
- Eligible?
- —
Personal DTI + credit; lowest rate.
DSCR
20% down · 8.5% · 30yr
- Down + closing
- —
- Monthly P&I
- —
- Monthly cashflow
- —
- DSCR
- —
- Eligible?
- —
No personal income docs; deal must DSCR.
Hard money
10% down · 12.0% · 12mo
- Down + closing
- —
- Monthly P&I
- —
- Monthly cashflow
- —
- DSCR
- —
- Eligible?
- —
Short-term bridge; refi at stabilization.
Rent comps 40 comps
| Address | Beds | Baths | Sqft | Rent | $/sqft | DOM | Units | Dist |
|---|---|---|---|---|---|---|---|---|
| 5000 Linder Ave Dallas, TX | 3.0 | 2.0 | 1327 | $1,950 | $1.47 | 43d | 1 | 0.13mi |
| 4934 Echo Ave Dallas, TX | 5.0 | 4.0 | 1815 | $2,900 | $1.60 | 43d | 1 | 0.19mi |
| 2840 Oakdale St Dallas, TX | 3.0 | 2.0 | 1379 | $1,900 | $1.38 | 43d | 1 | 0.23mi |
| 2521 Bethurum Ave Dallas, TX | 3.0 | 2.5 | 1600 | $2,300 | $1.44 | 43d | 1 | 0.44mi |
| 4722 Meadow St Dallas, TX | 2.0–3.0 | 2.0 | 1107 | $1,475 | $1.33 | 11d | 4 | 0.51mi |
| 2246 Hooper St Dallas, TX | 3.0 | 3.0 | 1870 | $2,400 | $1.28 | 43d | 1 | 0.52mi |
| 2618 Carpenter Ave Dallas, TX | 4.0 | 3.0 | 2050 | $3,200 | $1.56 | 43d | 1 | 0.55mi |
| 2927 Dorris St Dallas, TX | 3.0 | 2.0 | 1298 | $1,914 | $1.47 | 43d | 1 | 0.56mi |
| 2207 Anderson St Dallas, TX | 3.0 | 2.5 | 1419 | $2,300 | $1.62 | 7d | 1 | 0.61mi |
| 2807 Valentine St Dallas, TX | 3.0 | 2.0 | 1400 | $1,500 | $1.07 | 15d | 1 | 0.62mi |
| 2203 Anderson St Dallas, TX | 3.0 | 2.5 | 1219 | $2,200 | $1.80 | 43d | 1 | 0.62mi |
| 2312 Stoneman St Dallas, TX | 4.0 | 3.0 | 2106 | $3,100 | $1.47 | 4d | 1 | 0.67mi |
| 1711 Herald St Dallas, TX | 3.0 | 2.5 | 2140 | $2,350 | $1.10 | 43d | 1 | 0.68mi |
| 1713 Herald St Dallas, TX | 3.0 | 2.5 | 2142 | $2,300 | $1.07 | 7d | 1 | 0.69mi |
| 4611 Bradshaw St Dallas, TX | 3.0 | 2.0 | 1145 | $1,550 | $1.35 | 24d | 1 | 0.69mi |
| 2216 Dyson St Dallas, TX | 3.0 | 2.0 | 1056 | $2,100 | $1.99 | 24d | 1 | 0.72mi |
| 4503 Bradshaw St Dallas, TX | 4.0 | 2.0 | 1263 | $1,600 | $1.27 | 7d | 1 | 0.74mi |
| 2325 Budd St Dallas, TX | 3.0 | 2.5 | 1696 | $2,350 | $1.39 | 43d | 1 | 0.76mi |
| 4024 Myrtle St Dallas, TX | 3.0 | 2.0 | 1106 | $1,595 | $1.44 | 5d | 1 | 0.76mi |
| 2413 Easley St Dallas, TX | 3.0 | 2.5 | 1597 | $2,400 | $1.50 | 7d | 1 | 0.78mi |
| 3526 Elsie Faye Heggins St Dallas, TX | 3.0 | 2.0 | 1113 | $1,795 | $1.61 | 7d | 1 | 0.86mi |
| 3526 Elsie Faye Heggins St Dallas, TX | 3.0 | 2.0 | 1113 | $1,795 | $1.61 | 24d | 1 | 0.86mi |
| 3627 Sidney St Dallas, TX | 3.0 | 2.0 | 1090 | $1,614 | $1.48 | 6d | 1 | 0.92mi |
| 6602 Bexar St Dallas, TX | 3.0 | 2.5 | 1600 | $2,499 | $1.56 | 7d | 1 | 0.96mi |
| 3619 York St Dallas, TX | 3.0 | 2.0 | 1298 | $1,740 | $1.34 | 7d | 1 | 0.97mi |
| 2727 Choice St Dallas, TX | 3.0 | 2.0 | 1175 | $1,799 | $1.53 | 24d | 1 | 1.00mi |
| 4024 Colonial Ave Dallas, TX | 4.0 | 2.0 | 1560 | $2,400 | $1.54 | 24d | 1 | 1.00mi |
| 3331 Spring Ave Dallas, TX | 3.0 | 2.0 | 1652 | $2,200 | $1.33 | 24d | 1 | 1.03mi |
| 2822 McDermott Ave Dallas, TX | 3.0 | 2.0 | 1200 | $1,795 | $1.50 | 24d | 1 | 1.03mi |
| 3331 Spring Ave Dallas, TX | 3.0 | 2.0 | 1652 | $2,200 | $1.33 | 7d | 1 | 1.03mi |
| 3915 Coolidge St Dallas, TX | 4.0 | 2.0 | 1416 | $2,100 | $1.48 | 43d | 1 | 1.08mi |
| 3639 Pine St Dallas, TX | 3.0 | 2.0 | 1090 | $1,490 | $1.37 | 14d | 1 | 1.17mi |
| 2847 Metropolitan Ave Dallas, TX | 3.0 | 1.0 | 1344 | $2,050 | $1.53 | 22d | 1 | 1.17mi |
| 3726 Copeland St Dallas, TX | 3.0 | 2.0 | 1298 | $1,690 | $1.30 | 6d | 1 | 1.18mi |
| 3801 Carpenter Ave Dallas, TX | 4.0 | 2.0 | 1454 | $2,400 | $1.65 | 43d | 1 | 1.20mi |
| 5340 Dimple Jackson St Dallas, TX | 3.0 | 2.0 | 1298 | $1,864 | $1.44 | 6d | 1 | 1.21mi |
| 3523 Herrling St Dallas, TX | 3.0 | 2.0 | 1525 | $1,800 | $1.18 | 16d | 1 | 1.22mi |
| 2714 Hector St Dallas, TX | 3.0 | 2.0 | 1233 | $2,100 | $1.70 | 24d | 1 | 1.23mi |
| 4014 Marshall Dr Dallas, TX | 4.0 | 2.0 | 1600 | $1,850 | $1.16 | 24d | 1 | 1.29mi |
| 3502 Edgewood St Dallas, TX | 4.0 | 2.0 | 1866 | $2,523 | $1.35 | 2d | 1 | 1.31mi |
Listing history 6 events
-
2026-05-05$149,000 Active 630-char remark
-
2026-04-21soldstatus $172,000
-
2024-01-26soldstatus
-
2023-02-13soldstatus
-
2014-08-05historical
-
2014-07-19$25,000 Active
ⓘ Source: listings_history table (triggers on properties + properties_extension) + one-shot
backfill from property_details.listing_events for pre-trigger history.
Tax reassessment forecast TX · Resets to sale price
- Current annual tax
- $1,336 · $111/mo
- Projected year-2 tax
- $2,727 · $227/mo
- Expected delta
- +$1,391/yr (+$116/mo · 104.2%)
ⓘ Screening estimate from a state-policy table — verify with the county assessor before closing.
Climate risk First Street
- Flood 6/10 Major FEMA zone X (shaded) · 68% chance over 30 yrs
- Wildfire 3/10 Moderate
- Heat 7/10 Severe 7 d/yr ≥110°F today · 24 d/yr by 30 yrs out
- Wind 6/10 Major 27% chance of damaging wind over 30 yrs
- Air quality 3/10 Moderate 2 unhealthy d/yr today · 3 by 30 yrs out
Nearby sold comps map
Loading sold comps map…
Walkable amenities ~0.75 mi
Loading nearby amenities…
Taxation est. · year 1
- Rental income
- $26,724
- − Mortgage interest
- −$8,346
- − Property taxes
- −$1,336
- − Insurance
- −$745
- − Repairs & maintenance
- −$2,138
- − Management
- −$2,138
- − Depreciation
- −$4,335
- Taxable income
- $7,687
- Est. tax owed @ 24.0%
- −$1,845
- After-tax cash flow
- $7,810/yr
For passive investors: Depreciation is non-cash, so a rental often shows a tax loss while cash-flowing — sheltering income. Rental losses are passive: they offset passive income freely, and up to $25,000/yr can offset ordinary (W-2) income if you actively participate and your MAGI is under $100k (phasing out to $0 by $150k); unused losses carry forward. On sale, claimed depreciation is recaptured at up to 25%, and gains may owe capital-gains tax (a 1031 exchange can defer both). Figures are a year-1 estimate at your 24.0% rate — not tax advice; consult a CPA.
Schools (NCES district)
- District
- Dallas ISD
- NCES district ID
- 4816230
- Math proficiency
- 31% ▼ -16.00%
- Reading proficiency
- 36% ▼ -4.00%
- Median HH income
- $42,881
- Composite
- 28.41/100
- National rank
- #6763
- State rank
- #559 of 826 in TX
Livability — Dallas
- Score
- 81/100
- State rank
- #24
- US rank
- #1380
Category grades
Schools grade is shown separately in the Schools card above.
Census & demographics
- Census place
- Dallas, TX
- County
- Dallas County · 2,612,404 people
- City population
- 1,168,437
- Metro
- Dallas-Fort Worth-Arlington, TX
- Population (ZIP)
- 18,895
- Household income
- $45,557
- Rent vs Own
- Severe rent burden
- 1464.0
Population outlook (Dallas County) Hauer SSP2
- Today (2025)
- 2,979,839 people
- By 2030
- 3,191,823 · +7.1%
- By 2040
- 3,619,611 · +21.5%
- By 2050
- 4,026,915 · +35.1%
- By 2075
- 4,957,073 · +66.4%
- By 2100
- 5,508,725 · +84.9%
Race, ethnicity, and origin ACS 2023
- Neighborhood character
- Diverse neighborhood (Simpson 0.58)
- Race & ethnicity
- Black 59% Hispanic / Latino 25% White 11% Two or more races 10%
- Hispanic origin (detail)
- Mexican 21%
- Common ancestry
- Italian 1% Hispanic 1%
- Foreign-born
- 16% · Canada
- Languages at home
- 74% English-only · Spanish 26%
Political lean MEDSL · Dallas
- 2024 margin
- Strong D (+22.2) · D 60.2% · R 38.0% · Other 1.8%
- 2008→2024 swing
- +6.9pp toward D · 2008: 15.3pp · 2024: 22.2pp
- All cycles
- 2024: D+22.2 2020: D+31.6 2016: D+26.2 2012: D+15.4 2008: D+15.3
Not yet ingested
- Civics
- —
Market trends
- HPI YoY
- ▲ 0.79%
- Current HPI
- 224.2955
- Rent YoY
- ▲ 7.19%
- Metro
- Dallas-Fort Worth-Arlington, TX
- State GDP YoY
- ▲ 3.95%
- F500 in state
- 110
Industry mix (Fortune 500 HQ in TX)
| Industry | F500 HQs | Revenue |
|---|---|---|
| Energy | 16 | $1,198B |
|
||
| Technology | 5 | $198B |
|
||
| Engineering / Construction | 4 | $72B |
|
||
| Energy Services | 3 | $60B |
|
||
| Utilities | 3 | $41B |
|
||
| Healthcare | 2 | $330B |
|
||
Price history
+496.0% since first listed7 events — show timeline
- 2026-05-27 Pending — NTREIS
- 2026-05-05 Listed $149,000 NTREIS
- 2026-04-21 Sold (Public Records) $172,000 Public Records
- 2024-01-26 Sold (Public Records) — Public Records
- 2023-02-13 Sold (Public Records) — Public Records
- 2014-08-05 Listing Removed — NTREIS
- 2014-07-19 Listed $25,000 NTREIS
Property tax history
+5.2%/yrLatest (2025): $1,336 · +42.3% YoY. Source: county tax records.
Cash-flow waterfall
monthlySold comps — $/sqft
last 12 mo · ≤1 miLoading sold comps…