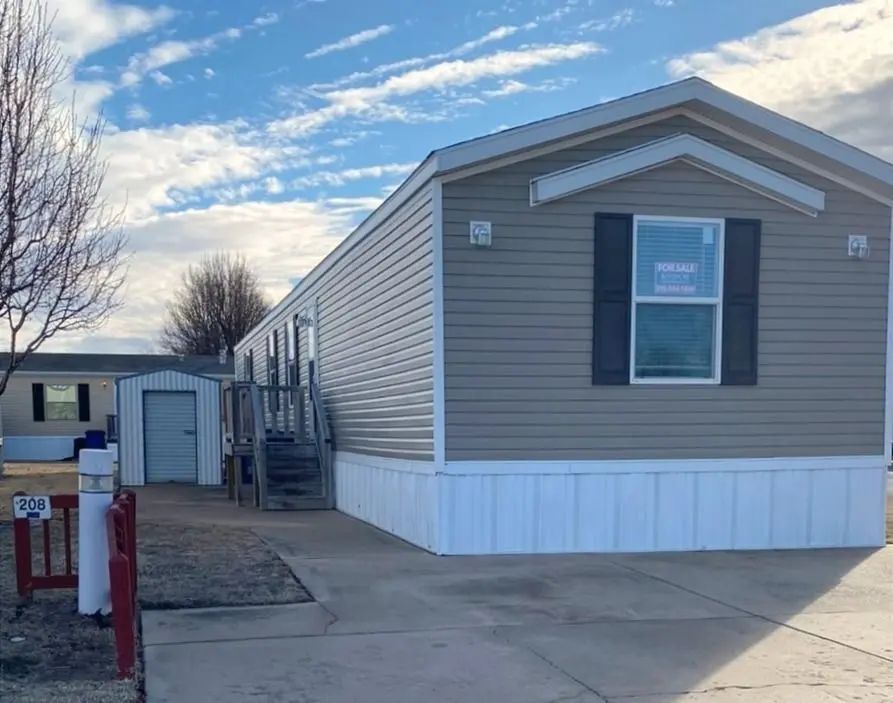
1400 E Kay Ave Unit KAC208 · Haysville, KS
Flood risk 1/10 · Minimal
- FEMA flood zone
- X
- Chance of flooding over 30 yrs
- 0.0%
- Est. flood insurance / yr
- $473 – $860
Fire risk 3/10 · Minor
- Est. fire insurance / yr
- $1,154 – $2,142
Heat risk 5/10 · Moderate
- Hot days now (above 106°F)
- 7 days/yr
- Hot days in 30 yrs
- 18 days/yr
Wind risk 2/10 · Minimal
- Chance of severe wind over 30 yrs
- 0.0%
Air-quality risk 2/10 · Minimal
- Unhealthy air days now
- 1 days/yr
- Unhealthy air days in 30 yrs
- 1 days/yr
Risk factors via First Street. Map © Google.
Why this score? — see what drove the B- grade
The composite is a weighted blend of 9 inputs, each scored 0–100. Each bar is that input's sub-score; the figure is the points it added to the 100-point composite (weight × sub-score).
- Cash flow +30.0/30.0
- 1% rule +10.0/10.0
- DSCR +10.0/10.0
- ARV discount +7.5/15.0
- Condition / age +4.0/5.0
- Livability +3.7/5.0
- Rent growth +2.5/5.0
- Schools +2.1/10.0
- Appreciation +0.0/10.0
$46,100
🖨 Deal sheet 📄 Offer letter ✓ Due diligence
Key facts
- Built 2026
- Listed 45 days
Property features AI
Finance
- Financial info: List price $45,600
Exterior
- Utilities: Natural gas; Central air
- Home design: Spec home, Plan 92215; Active listing status
- Exterior features: Located at 1400 E Kay Ave Unit KAC208, Haysville, KS 67060
Interior
- Bedrooms: 3 bedrooms
- Bathrooms: 2 full bathrooms
- Heating & cooling: Natural gas heating; Central air conditioning
- Interior features: Open living area totaling 1,216 finished square feet
Neighborhood map
What this means for you Summary
Snapshot
- This is a 3-bed/2.0-bath manufactured listed at $46k. Condition is rated good.
Deal economics
- At list price, monthly cash flow is $854 ($10k/yr) — positive.
- The deal already cash-flows at list — no discount required.
- Meets the 1% rule at list price ($1k rent vs $46k).
- Recommended offer: $45k (3.0% below list) — sets the bar for market timing.
Location & tenants
- Location reads 73/100 on livability (#94 in KS) — a middle-class / working-renter tenant base. Strengths: cost of living A+, housing A+, health & safety A+; Watch: employment C-, schools D, amenities F.
- Haysville (suburban): math 18% / reading 29% proficiency, ranked #137 of 169 in KS (top 81%) — low school quality limits family demand, transient renter base, plan for 1-2y turnover.
- Market conditions: 103 active listings in the ZIP; 3 comparable units currently listed for rent nearby; rentals at typical pace (median 14d on market — plan ~3-4 weeks tenant-placement turnaround); 2,613 units permitted in Sedgwick County in 2024 (258 in 5+ unit buildings).
Forward outlook
- Local home prices are declining (-3.0%/yr); year-one equity from $319 of loan paydown is wiped out by about $1k of value loss. Plan a longer hold.
- Sedgwick County population projected at +5% by 2050 — modest demand growth; plan on rents tracking national, not racing it.
- At projected returns (-3.0% appreciation + 3.0% rent growth), your $13k cash investment doubles in ~2 years — after that, you're playing with house money.
Negotiation context
- It's been on market 45 days — a 3% lower offer ($45k) is reasonable based on typical stale-listing flexibility.
Risks & watch-outs
- Climate carrying-cost: extreme-heat days projected 7→18/yr by 2055 (HVAC capex compounding) — expect insurance premiums to compound above CPI over the hold.
Questions for the listing agent
- It's been on market 45 days. Have you received any prior offers? Is the seller open to a 3% concession, seller financing, or rate buy-down credit?
- Is there a deadline driving the sale (1031 exchange, divorce, estate, relocation)? That informs how much negotiation room exists.
- Schools are D-rated, which usually means shorter tenancies and higher turnover. Who's the typical renter profile here, and what's been the actual vacancy rate?
- What's the average days-on-market for RENTAL listings here right now (not sales)? A rising rental-DOM trend means longer vacancies and softer asking-rent achievability than the comps imply.
- What's the recent tenant-quality profile in this submarket — average credit score on applications, eviction rate, late-payment / NSF rate, and stable-employment percentage? A property-management company in the area should have these aggregated.
- How much new for-sale + rental construction is in the pipeline within 1–3 miles? Heavy new supply typically softens prices + rents 12–24 months out; constrained supply supports both.
Investment metrics
- 1% rule
- 3.22% ✓
- Cap rate
- 28.51%
- Cash-on-cash
- 79.36%
- DSCR
- 4.53
- GRM
- 2.6
CMA / ARV
No comps found within radius.
Projected returns pro-forma
-3.0% appreciation · 3.0% rent growth · sell at horizon
- IRR
- 79.5%
- Equity multiple
- 4.64×
- Total profit
- $46,922
- Equity at exit
- $6,874
- IRR
- 83.0%
- Equity multiple
- 9.60×
- Total profit
- $110,959
- Equity at exit
- $3,986
Cash invested: $12,908 (down + closing). Projections, not guarantees.
Landlord ↔ Tenant lean methodology
- Overall (STATE)
- 83 Strongly Landlord-Friendly
- State Kansas
- 83 Strongly Landlord-Friendly · R+10
- County
- — inherits STATE
- City
- — inherits STATE
ZIP-level market 67060
- Home prices YoY
- -23.0%
- Active inventory
- 103
- Price-to-rent
- 2.6×
Monthly cashflow live
- Estimated rent
- $1,484 medium interval (Pro) →
- Mortgage (P&I)
- −$242
- Tax est. 1.5%
- −$58 /mo · $692/yr
- Insurance
- −$19
- HOA
- −$0
- Vacancy / Maint / Mgmt
- −$312
- Net cashflow
- $854
Break-even live
UW: 25.0% down · 7.5% · 30yr · 1.5% tax · 5.0% vac · 8.0% maint · 8.0% mgmt
Financing live
Cash to close
- Down payment
- $11,525
- Closing costs
- $1,383
- Reserves months
- —
- Total cash needed
- —
Loan-product check · same deal, 3 products live
Conventional
25% down · 7.5% · 30yr
- Down + closing
- —
- Monthly P&I
- —
- Monthly cashflow
- —
- DSCR
- —
- Eligible?
- —
Personal DTI + credit; lowest rate.
DSCR
20% down · 8.5% · 30yr
- Down + closing
- —
- Monthly P&I
- —
- Monthly cashflow
- —
- DSCR
- —
- Eligible?
- —
No personal income docs; deal must DSCR.
Hard money
10% down · 12.0% · 12mo
- Down + closing
- —
- Monthly P&I
- —
- Monthly cashflow
- —
- DSCR
- —
- Eligible?
- —
Short-term bridge; refi at stabilization.
Rent comps 3 comps
| Address | Beds | Baths | Sqft | Rent | $/sqft | DOM | Units | Dist |
|---|---|---|---|---|---|---|---|---|
| 288 Copper Tail LN Haysville, KS | 3.0 | 2.5 | 1500 | $1,700 | $1.13 | 14d | 5 | 0.60mi |
| 335 S Jane St Haysville, KS | 2.0–3.0 | 2.0 | 1065 | $1,400 | $1.31 | 14d | 1 | 0.94mi |
| 316 W 6th St Haysville, KS | 3.0 | 1.0 | 864 | $1,050 | $1.22 | 14d | 1 | 1.43mi |
Listing history 15 events
-
2026-06-18days on market $46,100 Active 45 DOM
-
2026-06-17days on market $46,100 Active 44 DOM
-
2026-06-16days on market $46,100 Active 43 DOM
-
2026-06-15days on market $46,100 Active 42 DOM
-
2026-06-14days on market $46,100 Active 40 DOM
-
2026-06-10days on market $46,100 Active 37 DOM
-
2026-06-09days on market $46,100 Active 36 DOM
-
2026-06-08days on market $46,100 Active 35 DOM
-
2026-06-07days on market $46,100 Active 34 DOM
-
2026-06-05days on market $46,100 Active 31 DOM
-
2026-06-03days on market $46,100 Active 30 DOM
-
2026-06-02days on market $46,100 Active 29 DOM
-
2026-06-01pricedays on market $46,100 Active 28 DOM
-
2026-05-31days on market $45,600 Active 27 DOM
-
2026-05-30days on market $45,600 Active 26 DOM
ⓘ Source: listings_history table (triggers on properties + properties_extension) + one-shot
backfill from property_details.listing_events for pre-trigger history.
Climate risk First Street
- Flood 1/10 Low FEMA zone X · 0% chance over 30 yrs
- Wildfire 3/10 Moderate
- Heat 5/10 Major 7 d/yr ≥106°F today · 18 d/yr by 30 yrs out
- Wind 2/10 Low 0% chance of damaging wind over 30 yrs
- Air quality 2/10 Low 1 unhealthy d/yr today · 1 by 30 yrs out
Nearby sold comps map
Loading sold comps map…
Walkable amenities ~0.75 mi
Loading nearby amenities…
Taxation est. · year 1
- Rental income
- $17,806
- − Mortgage interest
- −$2,582
- − Property taxes
- −$692
- − Insurance
- −$230
- − Repairs & maintenance
- −$1,424
- − Management
- −$1,424
- − Depreciation
- −$1,341
- Taxable income
- $10,112
- Est. tax owed @ 24.0%
- −$2,427
- After-tax cash flow
- $7,817/yr
For passive investors: Depreciation is non-cash, so a rental often shows a tax loss while cash-flowing — sheltering income. Rental losses are passive: they offset passive income freely, and up to $25,000/yr can offset ordinary (W-2) income if you actively participate and your MAGI is under $100k (phasing out to $0 by $150k); unused losses carry forward. On sale, claimed depreciation is recaptured at up to 25%, and gains may owe capital-gains tax (a 1031 exchange can defer both). Figures are a year-1 estimate at your 24.0% rate — not tax advice; consult a CPA.
Condition & rehab AI · 7 photos
This manufactured home is in good condition with cosmetic updates, ready for a new owner or renter.
Value-add opportunities
- Both Painting exterior and interior walls — Enhances curb appeal and interior aesthetics
- Both Upgrading kitchen appliances — Modernizes the space and adds value
- Both Adding smart home features — Improves convenience and adds modern appeal
Renovation cost estimate screening
Value-add ROI direction
- Both Painting exterior and interior walls — Enhances curb appeal and interior aesthetics ↑
- Both Upgrading kitchen appliances — Modernizes the space and adds value ↑
- Both Adding smart home features — Improves convenience and adds modern appeal ↑
ⓘ Cost ranges are severity-bucket heuristics (US national rule-of-thumb). Get contractor quotes + a written scope before underwriting a rehab budget.
Schools (NCES district)
- District
- Haysville
- NCES district ID
- 2007050
- Math proficiency
- 18% ▼ -7.00%
- Reading proficiency
- 29% ▼ -1.00%
- Median HH income
- $55,560
- Composite
- 21.3/100
- National rank
- #8385
- State rank
- #137 of 169 in KS
Livability — Haysville
- Score
- 73/100
- State rank
- #94
- US rank
- #5386
Category grades
Schools grade is shown separately in the Schools card above.
Census & demographics
- Census place
- Haysville, KS
- Population (ZIP)
- 14,004
Population outlook (Sedgwick County) Hauer SSP2
- Today (2025)
- 537,014 people
- By 2030
- 546,984 · +1.9%
- By 2040
- 559,141 · +4.1%
- By 2050
- 562,027 · +4.7%
- By 2075
- 557,255 · +3.8%
- By 2100
- 513,383 · -4.4%
Race, ethnicity, and origin ACS 2023
- Neighborhood character
- Predominantly White (84%)
- Race & ethnicity
- White 84% Hispanic / Latino 8% Two or more races 6% Pacific Islander 2% Black 1%
- Hispanic origin (detail)
- Mexican 5%
- Common ancestry
- Lithuanian 2% Italian 2% Slovak 2%
- Foreign-born
- 3% · Canada
- Languages at home
- 96% English-only · Spanish 2% Other Asian/Pacific 2%
Political lean MEDSL · Sedgwick
- 2024 margin
- R (+13.8) · D 42.3% · R 56.1% · Other 1.6%
- 2008→2024 swing
- -1.1pp toward R · 2008: -12.7pp · 2024: -13.8pp
- All cycles
- 2024: R+13.8 2020: R+12.6 2016: R+19.1 2012: R+19.7 2008: R+12.7
Not yet ingested
- Civics
- —
Market trends
- HPI YoY
- ▼ -72.95%
- Current HPI
- 244.4809
- Rent YoY
- —
- Metro
- —
- State GDP YoY
- —
- F500 in state
- 0
Cash-flow waterfall
monthlySold comps — $/sqft
last 12 mo · ≤1 miLoading sold comps…