 6-Plex
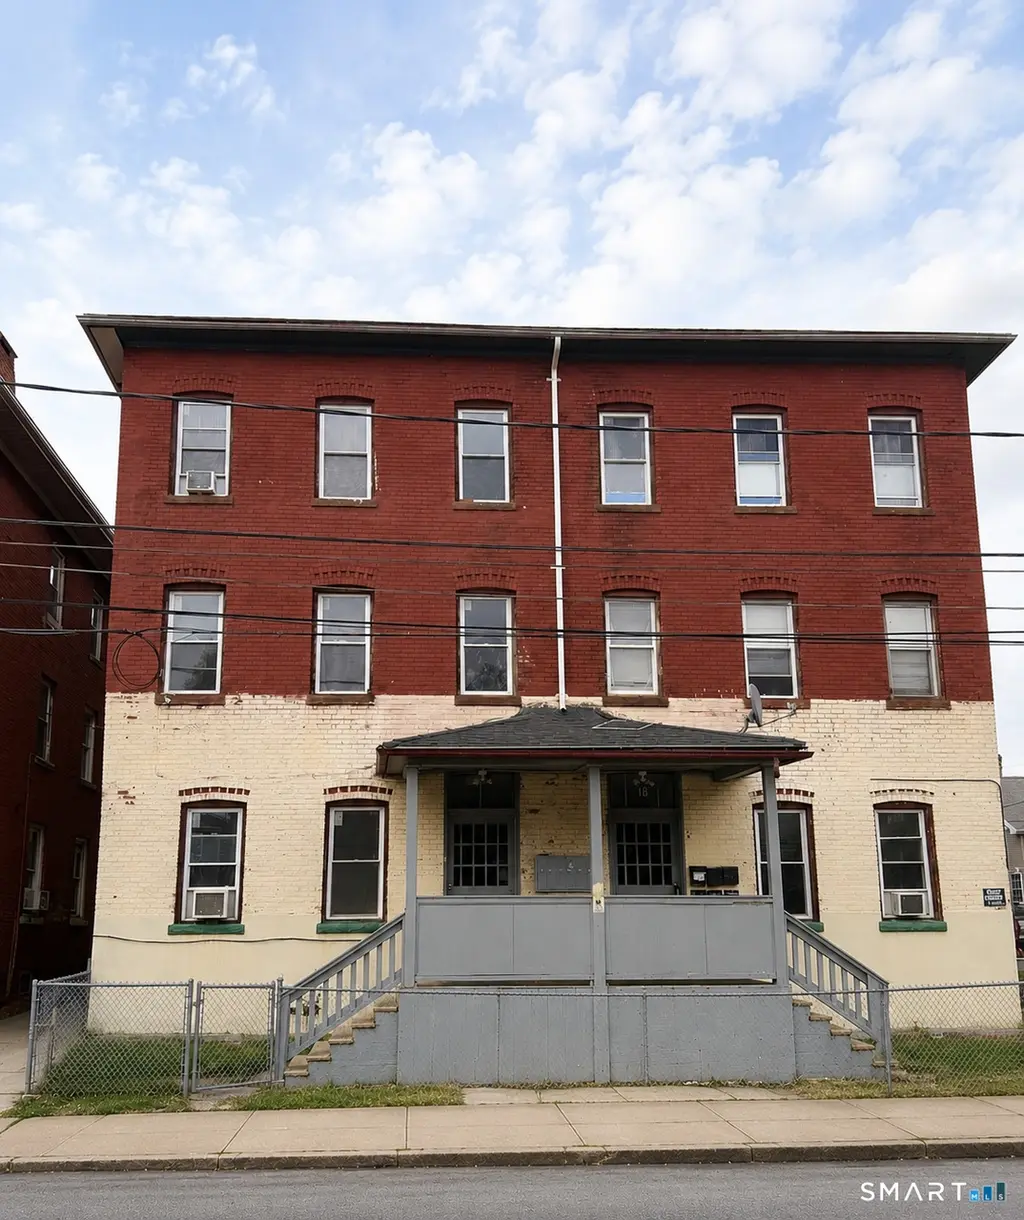
18-20 Lawrence St · Hartford, CT
Flood risk 1/10 · Minimal
- FEMA flood zone
- X (unshaded)
- Chance of flooding over 30 yrs
- 0.0%
- Est. flood insurance / yr
- $473 – $860
Fire risk 1/10 · Minimal
- Est. fire insurance / yr
- $829 – $1,539
Heat risk 5/10 · Moderate
- Hot days now (above 97°F)
- 7 days/yr
- Hot days in 30 yrs
- 16 days/yr
Wind risk 6/10 · Moderate
- Chance of severe wind over 30 yrs
- 27.0%
Air-quality risk 3/10 · Minor
- Unhealthy air days now
- 3 days/yr
- Unhealthy air days in 30 yrs
- 4 days/yr
Risk factors via First Street. Map © Google.
Why this score? — see what drove the B+ grade
The composite is a weighted blend of 9 inputs, each scored 0–100. Each bar is that input's sub-score; the figure is the points it added to the 100-point composite (weight × sub-score).
- Cash flow +30.0/30.0
- 1% rule +10.0/10.0
- DSCR +10.0/10.0
- ARV discount +7.5/15.0
- Appreciation +5.7/10.0
- Condition / age +4.0/5.0
- Livability +3.8/5.0
- Rent growth +3.1/5.0
- Schools +1.4/10.0
$749,111
🖨 Deal sheet (PDF) 📄 Offer letter ✓ Due diligence
Multi-family units
County records classify this as Multi-Family (5+ Unit). Listing-text estimate: 6 units. confirmed
5+ unit building — per-unit beds/baths from public records are typically unavailable; the breakdown below (if shown) is an estimate from the listing text.
Listing remarks
Turnkey 6-Unit Brick Multifamily | Hartford | 100% Occupied Cash flow from day one. This fully occupied, all-brick 6-unit multifamily property showcases true pride of ownership and is ready for its next investor. Featuring gross annual rents of $92,040 ($7,670/month), stabilized occupancy, long-term tenants, and significant recent capital improvements, the heavy lifting has already been done. Major updates include a newer roof (2019-2020), six new hot water heaters installed in 2026, and high efficiency tankless boiler combi systems added in 2017. The property offers gas heat and cooking throughout, washer/dryer hookups in select units, recessed lighting in common areas, and attractive gray
Key facts
- Newer flat roof
- 6 unit multifamily
- Gas heat
Tags
Property features AI
Exterior
- Utilities: Public water connected; Public sewer connected; Domestic hot water
- Home design: Multi-family property (5+ units)
- Construction: Brick construction; Brick and stone foundation; Asphalt shingle roof
- Exterior features: Level lot; Brick exterior
Interior
- Bedrooms: 17 total bedrooms
- Bathrooms: 6 full bathrooms
- Heating & cooling: Hot water heat; Natural gas fuel
- Interior features: 35 total rooms; Full basement
- Laundry & utility: Washer/Dryer in some units
Neighborhood map
What this means for you Summary
Snapshot
- This is a 6 × 3-bed/1.0-bath units multifamily listed at $749k. Condition is rated good.
Deal economics
- At list price, monthly cash flow is $5k ($62k/yr) — positive. Per door: $864/mo.
- The deal already cash-flows at list — no discount required.
- Meets the 1% rule at list price ($13k rent vs $749k).
- Recommended offer: $738k (1.5% below list) — sets the bar for market timing.
Location & tenants
- Location reads 76/100 on livability (#58 in CT, #3,553 nationally) — a middle-class / working-renter tenant base. Strengths: amenities A+, commute A+, health & safety A+; Watch: crime F, employment F.
- Hartford School District (urban): math 13% / reading 21% proficiency, ranked #150 of 153 in CT (top 98%) — low school quality limits family demand, transient renter base, plan for 1-2y turnover; 84% free/reduced lunch — lower-income household profile, screen leases tightly.
- Zoned schools: Kennelly School (math 7% / reading 12%, grade F, #522 of 553 statewide, top 95%, 598 students, 85% FRL); Mcdonough Middle School (math 0% / reading 6%, grade F, #175 of 175 statewide, top 100%, 317 students, 83% FRL) — zoned schools at 84% FRL track the district average.
- Market conditions: Rents rising (+2.4%/yr); 61 active listings in the ZIP; 1,867 units permitted in Capitol Planning Region in 2024 (1,399 in 5+ unit buildings).
- At $13,114/mo this rent would consume 340% of the median local household income ($46k/yr) (locally 3400% of renters already pay >50% of income on rent) — very limited rent-growth headroom before tenants either downsize or default.
Forward outlook
- In year one you build about $15k of equity ($5k loan paydown + $10k appreciation (1.4% local appreciation)).
- At projected returns (1.4% appreciation + 2.4% rent growth), your $210k cash investment doubles in ~3 years — after that, you're playing with house money.
- By year 4, paydown + projected appreciation supports a ~$55k cash-out refi (75% LTV) — recoverable capital for the next deal without selling this one.
Negotiation context
- It's been on market 18 days — a 2% lower offer ($738k) is reasonable based on typical stale-listing flexibility.
Risks & watch-outs
- Watch-outs: built in 1890 — expect roof / HVAC / electrical / plumbing capex.
- Climate carrying-cost: major wind risk, 27% chance of damaging wind over 30y; extreme-heat days projected 7→16/yr by 2055 (HVAC capex compounding) — expect insurance premiums to compound above CPI over the hold.
Questions for the listing agent
- Can we see the unit-by-unit rent roll, current vacancy, and any below-market leases? What's the average tenancy length?
- What capital expenditures (roof, boiler, parking lot, exteriors) have been made in the last 5 years, and what's planned in the next 2?
- Built in 1890 — when were the roof, HVAC, electrical panel, plumbing, and water heater last replaced?
- Is there a deadline driving the sale (1031 exchange, divorce, estate, relocation)? That informs how much negotiation room exists.
- Schools are D-rated, which usually means shorter tenancies and higher turnover. Who's the typical renter profile here, and what's been the actual vacancy rate?
- Crime grade is F in this area — have there been break-ins, vandalism, or insurance claims at this property in the last 3 years? What carrier currently insures it and at what premium?
- What's the average days-on-market for RENTAL listings here right now (not sales)? A rising rental-DOM trend means longer vacancies and softer asking-rent achievability than the comps imply.
- What's the recent tenant-quality profile in this submarket — average credit score on applications, eviction rate, late-payment / NSF rate, and stable-employment percentage? A property-management company in the area should have these aggregated.
- How much new apartment / multifamily construction is in the pipeline within 1–3 miles? Heavy new supply (>2% of stock underway) typically softens rents 12–24 months out; light construction supports rent growth.
Investment metrics
- 1% rule
- 1.75% ✓
- Cap rate
- 14.60%
- Cash-on-cash
- 29.65%
- DSCR
- 2.32
- GRM
- 4.8
CMA / ARV
No comps found within radius.
Projected returns pro-forma
1.38% appreciation · 2.37% rent growth · sell at horizon
- IRR
- 32.1%
- Equity multiple
- 2.67×
- Total profit
- $349,915
- Equity at exit
- $270,472
- IRR
- 33.7%
- Equity multiple
- 5.08×
- Total profit
- $855,111
- Equity at exit
- $371,117
Cash invested: $209,751 (down + closing). Projections, not guarantees.
Landlord ↔ Tenant lean methodology
- Overall (STATE)
- 27 Tenant-Leaning
- State Connecticut
- 27 Tenant-Leaning · D+7
- County
- — inherits STATE
- City
- — inherits STATE
ZIP-level market 06106
- Home prices YoY
- 0.4%
- Rents YoY
- 2.4%
- Active inventory
- 61
- Price-to-rent
- 28.6×
Monthly cashflow live
- Estimated rent
- $13,114 high interval (Pro) →
- Mortgage (P&I)
- −$3,928
- Tax est. 1.5%
- −$936 /mo · $11,237/yr
- Insurance
- −$312
- HOA
- −$0
- Vacancy / Maint / Mgmt
- −$2,754
- Net cashflow
- $5,183
Break-even live
Sensitivity live
| Price | -10% $5,701 | -5% $5,442 | +0% $5,183 | +5% $4,924 | +10% $4,665 |
|---|---|---|---|---|---|
| Rent | -10% $4,147 | -5% $4,665 | +0% $5,183 | +5% $5,701 | +10% $6,219 |
| Rate | -1.0pp $5,560 | -0.5pp $5,374 | base $5,183 | +0.5pp $4,989 | +1.0pp $4,792 |
6-unit breakdown (identical units grouped — click to expand)
| Units | Beds | Baths | Est. rent |
|---|---|---|---|
| 6× units | 3 | 1 | $13,116 |
| #1 | 3 | 1 | $2,186 |
| #2 | 3 | 1 | $2,186 |
| #3 | 3 | 1 | $2,186 |
| #4 | 3 | 1 | $2,186 |
| #5 | 3 | 1 | $2,186 |
| #6 | 3 | 1 | $2,186 |
| Total (6 units) | $13,114 | ||
UW: 25.0% down · 7.5% · 30yr · 1.5% tax · 5.0% vac · 8.0% maint · 8.0% mgmt
Financing live
Cash to close
- Down payment
- $187,278
- Closing costs
- $22,473
- Reserves months
- —
- Total cash needed
- —
Loan-product check · same deal, 3 products live
Conventional
25% down · 7.5% · 30yr
- Down + closing
- —
- Monthly P&I
- —
- Monthly cashflow
- —
- DSCR
- —
- Eligible?
- —
Personal DTI + credit; lowest rate.
DSCR
20% down · 8.5% · 30yr
- Down + closing
- —
- Monthly P&I
- —
- Monthly cashflow
- —
- DSCR
- —
- Eligible?
- —
No personal income docs; deal must DSCR.
Hard money
10% down · 12.0% · 12mo
- Down + closing
- —
- Monthly P&I
- —
- Monthly cashflow
- —
- DSCR
- —
- Eligible?
- —
Short-term bridge; refi at stabilization.
Listing history 13 events
-
2026-06-22days on market $749,111 Active 18 DOM
-
2026-06-18days on market $749,111 Active 15 DOM
-
2026-06-17days on market $749,111 Active 14 DOM
-
2026-06-16days on market $749,111 Active 13 DOM
-
2026-06-15days on market $749,111 Active 12 DOM
-
2026-06-13days on market $749,111 Active 10 DOM
-
2026-06-13days on market $749,111 Active 9 DOM
-
2026-06-10days on market $749,111 Active 7 DOM
-
2026-06-09days on market $749,111 Active 6 DOM
-
2026-06-08days on market $749,111 Active 5 DOM
-
2026-06-07days on market $749,111 Active 4 DOM
-
2026-06-05remarks 699-char remark
-
2026-06-05$749,111 Active 1 DOM
ⓘ Source: listings_history table (triggers on properties + properties_extension) + one-shot
backfill from property_details.listing_events for pre-trigger history.
Climate risk First Street
- Flood 1/10 Low FEMA zone X (unshaded) · 0% chance over 30 yrs
- Wildfire 1/10 Low
- Heat 5/10 Major 7 d/yr ≥97°F today · 16 d/yr by 30 yrs out
- Wind 6/10 Major 27% chance of damaging wind over 30 yrs
- Air quality 3/10 Moderate 3 unhealthy d/yr today · 4 by 30 yrs out
Nearby sold comps map
Loading sold comps map…
Walkable amenities ~0.75 mi
Loading nearby amenities…
Taxation est. · year 1
- Rental income
- $157,368
- − Mortgage interest
- −$41,962
- − Property taxes
- −$11,237
- − Insurance
- −$3,746
- − Repairs & maintenance
- −$12,589
- − Management
- −$12,589
- − Depreciation
- −$21,792
- Taxable income
- $53,453
- Est. tax owed @ 24.0%
- −$12,829
- After-tax cash flow
- $49,369/yr
For passive investors: Depreciation is non-cash, so a rental often shows a tax loss while cash-flowing — sheltering income. Rental losses are passive: they offset passive income freely, and up to $25,000/yr can offset ordinary (W-2) income if you actively participate and your MAGI is under $100k (phasing out to $0 by $150k); unused losses carry forward. On sale, claimed depreciation is recaptured at up to 25%, and gains may owe capital-gains tax (a 1031 exchange can defer both). Figures are a year-1 estimate at your 24.0% rate — not tax advice; consult a CPA.
Condition & rehab AI · 14 photos
This 6-unit multifamily property is in good condition with recent updates and is ready for its next investor. The property has a good roof, clean bathrooms, and well-maintained interiors. The exterior walls could benefit from a fresh coat of paint to improve curb appeal.
Value-add opportunities
- Both Paint the exterior walls — Painting the exterior walls can improve the curb appeal and increase the property's value.
- Both Clean the gutters and downspouts — A clean and functional drainage system is essential for the property's functionality and can prevent water damage.
- Both Inspect and replace any damaged windows — Replacing damaged windows can improve the property's energy efficiency and increase its value.
Renovation cost estimate screening
Value-add ROI direction
- Both Paint the exterior walls — Painting the exterior walls can improve the curb appeal and increase the property's value. ↑
- Both Clean the gutters and downspouts — A clean and functional drainage system is essential for the property's functionality and can prevent water damage. ↑
- Both Inspect and replace any damaged windows — Replacing damaged windows can improve the property's energy efficiency and increase its value. ↑
ⓘ Cost ranges are severity-bucket heuristics (US national rule-of-thumb). Get contractor quotes + a written scope before underwriting a rehab budget.
Schools (NCES district)
- District
- Hartford School District
- NCES district ID
- 0901920
- Math proficiency
- 13% ▼ -5.00%
- Reading proficiency
- 21% ▼ -6.00%
- Median HH income
- $30,521
- Composite
- 13.54/100
- National rank
- #9514
- State rank
- #150 of 153 in CT
Livability — Hartford
- Score
- 76/100
- State rank
- #58
- US rank
- #3553
Category grades
Schools grade is shown separately in the Schools card above.
Census & demographics
- Census place
- Hartford, CT
- County
- Hartford County · 754,208 people
- City population
- 121,162
- Metro
- Hartford-East Hartford-Middletown, CT
- Population (ZIP)
- 36,322
- Household income
- $46,304
- Rent vs Own
- Severe rent burden
- 3400.0
Population outlook (Capitol County) Hauer SSP2
- By 2040
- 1,063,519
Race, ethnicity, and origin ACS 2023
- Neighborhood character
- Diverse neighborhood (Simpson 0.58)
- Race & ethnicity
- Hispanic / Latino 60% Two or more races 25% Black 18% White 15% Asian 3%
- Hispanic origin (detail)
- Mexican 2% Puerto Rican 42% Dominican 6%
- Common ancestry
- Lithuanian 2% Russian 1% Romanian 1%
- Foreign-born
- 20% · Canada, Jamaica, China
- Languages at home
- 46% English-only · Spanish 47% Other Indo-European 3% Other Asian/Pacific 1%
Political lean MEDSL · Capitol
- 2024 margin
- Strong D (+21.9) · D 60.1% · R 38.2% · Other 1.7%
- All cycles
- 2024: D+21.9
Not yet ingested
- Civics
- —
Market trends
- HPI YoY
- ▲ 1.38%
- Current HPI
- 314.0899
- Rent YoY
- ▲ 2.37%
- Metro
- Hartford-East Hartford-Middletown, CT
- State GDP YoY
- ▲ 1.06%
- F500 in state
- 38
Industry mix (Fortune 500 HQ in CT)
| Industry | F500 HQs | Revenue |
|---|---|---|
| Industrial Machinery | 4 | $38B |
|
||
| Insurance | 3 | $71B |
|
||
| Financial Services | 2 | $25B |
|
||
| Transportation / Logistics | 2 | $18B |
|
||
| Healthcare | 1 | $247B |
|
||
| Telecommunications | 1 | $55B |
|
||
Price history
1 event — show timeline
- 2026-06-03 Listed $749,111 Smart MLS
Cash-flow waterfall
monthlySold comps — $/sqft
last 12 mo · ≤1 miLoading sold comps…