 🏗️ New Construction
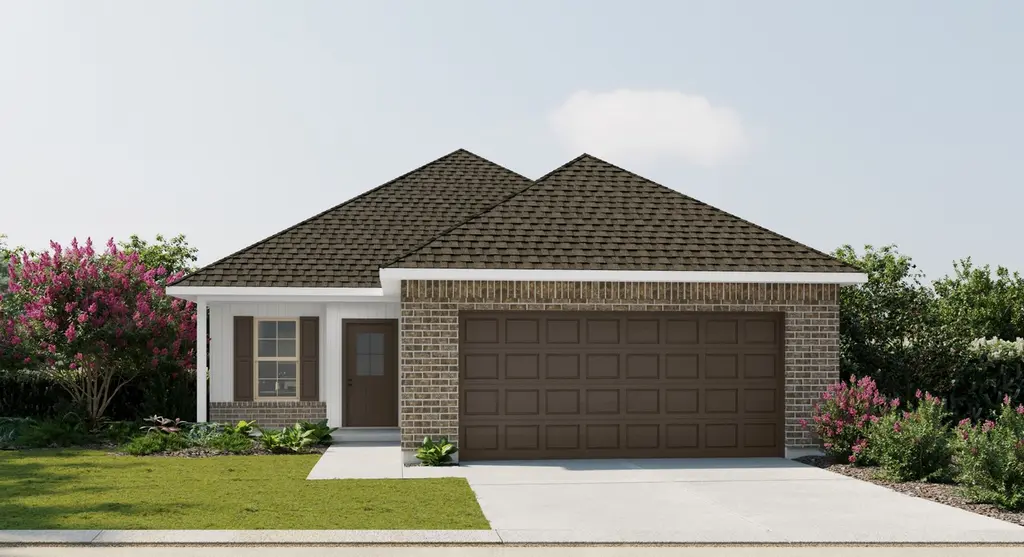
Kirkland IV G Plan · Duson, LA
Flood risk No data
- FEMA flood zone
- —
- Chance of flooding over 30 yrs
- —
- Est. flood insurance / yr
- —
Fire risk No data
- Est. fire insurance / yr
- —
Heat risk No data
- Hot days now (above threshold)
- —
- Hot days in 30 yrs
- —
Wind risk No data
- Chance of severe wind over 30 yrs
- —
Air-quality risk No data
- Unhealthy air days now
- —
- Unhealthy air days in 30 yrs
- —
Risk factors via First Street. Map © Google.
Why this score? — see what drove the D+ grade
The composite is a weighted blend of 9 inputs, each scored 0–100. Each bar is that input's sub-score; the figure is the points it added to the 100-point composite (weight × sub-score).
- Cash flow +14.9/30.0
- ARV discount +7.5/15.0
- Condition / age +4.8/5.0
- DSCR +4.6/10.0
- 1% rule +4.1/10.0
- Schools +3.6/10.0
- Livability +3.3/5.0
- Rent growth +2.5/5.0
- Appreciation +0.0/10.0
$195,990
🖨 Deal sheet 📄 Offer letter ✓ Due diligence
Listing remarks MLS
- Open Floor Plan - Three Bedrooms, Two Bathrooms - Two-Car Garage - Brick and Siding Exterior - Recessed Lighting in Kitchen - Walk-In Master Closet
Key facts
- Open floor plan
- 2 garage spots
- Listed 682 days
Tags
Neighborhood map
What this means for you Summary
Snapshot
- This is a 3-bed/2.0-bath single-family listed at $196k. Condition is rated excellent.
Deal economics
- At list price, monthly cash flow is $63 ($750/yr) — positive.
- The deal already cash-flows at list — no discount required.
- To meet the 1% rule (rent ≥ 1% of price), the offer needs to be $190k (3.1% below list).
- Recommended offer: $172k (12.0% below list) — sets the bar for market timing.
Location & tenants
- Location reads 66/100 on livability (#134 in LA) — a middle-class / working-renter tenant base. Strengths: cost of living A+, housing A+, health & safety B+; Watch: amenities F, commute F, employment F.
- Lafayette Parish (urban): math 38% / reading 46% proficiency, ranked #19 of 98 in LA (top 19%) — families likely to look elsewhere, expect single-tenant / working-renter base with shorter leases.
- Market conditions: 196 active listings in the ZIP; 1 comparable units currently listed for rent nearby; 1,585 units permitted in Lafayette Parish in 2024 (10 in 5+ unit buildings).
Forward outlook
- Local home prices are declining (-3.0%/yr); year-one equity from $1k of loan paydown is wiped out by about $6k of value loss. Plan a longer hold.
- Lafayette County population projected at +34% by 2050 — long-run rental-demand tailwind backs the buy-and-hold thesis.
Negotiation context
- It's been on market 682 days — a 12% lower offer ($172k) is reasonable based on typical stale-listing flexibility.
Questions for the listing agent
- It's been on market 682 days. Have you received any prior offers? Is the seller open to a 12% concession, seller financing, or rate buy-down credit?
- Why hasn't it sold? Are there any deal-killer items the seller is aware of (foundation, flood, title, zoning, code violations)?
- Is there a deadline driving the sale (1031 exchange, divorce, estate, relocation)? That informs how much negotiation room exists.
- The area grade is low — what's the realistic commute time and amenity access for the typical tenant pool here? Any planned neighborhood developments (good or bad) we should know about?
- What's the average days-on-market for RENTAL listings here right now (not sales)? A rising rental-DOM trend means longer vacancies and softer asking-rent achievability than the comps imply.
- What's the recent tenant-quality profile in this submarket — average credit score on applications, eviction rate, late-payment / NSF rate, and stable-employment percentage? A property-management company in the area should have these aggregated.
- How much new for-sale + rental construction is in the pipeline within 1–3 miles? Heavy new supply typically softens prices + rents 12–24 months out; constrained supply supports both.
Investment metrics
- 1% rule
- 0.91% ✗
- Cap rate
- 6.65%
- Cash-on-cash
- 1.29%
- DSCR
- 1.06
- GRM
- 9.1
CMA / ARV
- ARV (median comp)
- $208,153
- List price
- $195,990
- Delta
- -5.84%
- Verdict
- FAIR
- Comps
- 20 within 1.0 mi
Show comp detail 12 sales within ~0.75 mi
| Address | Dist | Beds/Ba | Sqft | Sold | Price | $/sf | Match |
|---|---|---|---|---|---|---|---|
| 205 Meadow Ridge Ln | 0.03mi | 3/2.0 | 1,321 (+11%) | 1mo | $199,880 | $151 | 80 |
| 109 Ember Ridge Ln | 0.13mi | 3/2.0 | 1,104 (-7%) | 6mo | $187,990 | $170 | 76 |
| 105 Ember Ridge Ln | 0.10mi | 3/2.0 | 1,104 (-7%) | 9mo | $189,775 | $172 | 76 |
| 307 Meadow Ridge Ln | 0.13mi | 3/2.0 | 1,321 (+11%) | 2mo | $199,035 | $151 | 74 |
| 118 Rosebrook Ln | 0.20mi | 3/2.0 | 1,321 (+11%) | 6mo | $201,080 | $152 | 67 |
| 107 Ember Ridge Ln | 0.11mi | 4/2.0 (+1) | 1,306 (+10%) | 9mo | $197,090 | $151 | 66 |
| 119 Ember Ridge Ln | 0.21mi | 3/2.0 | 1,321 (+11%) | 7mo | $199,975 | $151 | 66 |
| 115 Ember Ridge Ln | 0.18mi | 3/2.0 | 1,321 (+11%) | 11mo | $202,025 | $153 | 65 |
| 101 Rosebrook Ln | 0.05mi | 3/2.0 | 1,363 (+14%) | 12mo | $205,790 | $151 | 64 |
| 500 4th St | 0.42mi | 3/2.0 | 1,296 (+9%) | 3mo | $60,000 | $46 | 64 |
| 122 B Robin Rd | 0.47mi | 3/2.0 | 1,119 (-6%) | 11mo | $165,000 | $147 | 59 |
| 823 2nd St | 0.55mi | 3/1.0 | 1,100 (-8%) | 3mo | $98,600 | $90 | 55 |
Match score weights: distance 35% · size 25% · config 20% · recency 20%. Top-matched comps best support the ARV.
Projected returns pro-forma
-3.0% appreciation · 3.0% rent growth · sell at horizon
- IRR
- -14.2%
- Equity multiple
- 0.49×
- Total profit
- $-29,720
- Equity at exit
- $31,036
- IRR
- -5.4%
- Equity multiple
- 0.65×
- Total profit
- $-20,637
- Equity at exit
- $17,997
Cash invested: $58,283 (down + closing). Projections, not guarantees.
Landlord ↔ Tenant lean methodology
- Overall (STATE)
- 90 Strongly Landlord-Friendly
- State Louisiana
- 90 Strongly Landlord-Friendly · R+12
- County
- — inherits STATE
- City
- — inherits STATE
ZIP-level market 70529
- Home prices YoY
- -11.1%
- Active inventory
- 196
- Price-to-rent
- 8.6×
Monthly cashflow live
- Estimated rent
- $1,900 medium interval (Pro) →
- Mortgage (P&I)
- −$1,092
- Tax est. 1.5%
- −$260 /mo · $3,122/yr
- Insurance
- −$87
- HOA
- −$0
- Vacancy / Maint / Mgmt
- −$399
- Net cashflow
- $63
Break-even live
UW: 25.0% down · 7.5% · 30yr · 1.5% tax · 5.0% vac · 8.0% maint · 8.0% mgmt
Financing live
Cash to close
- Down payment
- $52,038
- Closing costs
- $6,245
- Reserves months
- —
- Total cash needed
- —
Loan-product check · same deal, 3 products live
Conventional
25% down · 7.5% · 30yr
- Down + closing
- —
- Monthly P&I
- —
- Monthly cashflow
- —
- DSCR
- —
- Eligible?
- —
Personal DTI + credit; lowest rate.
DSCR
20% down · 8.5% · 30yr
- Down + closing
- —
- Monthly P&I
- —
- Monthly cashflow
- —
- DSCR
- —
- Eligible?
- —
No personal income docs; deal must DSCR.
Hard money
10% down · 12.0% · 12mo
- Down + closing
- —
- Monthly P&I
- —
- Monthly cashflow
- —
- DSCR
- —
- Eligible?
- —
Short-term bridge; refi at stabilization.
Rent comps 1 comps
| Address | Beds | Baths | Sqft | Rent | $/sqft | DOM | Units | Dist |
|---|---|---|---|---|---|---|---|---|
| 211 Winter Park PL Duson, LA | 2.0–3.0 | 2.0 | 1275 | $1,900 | $1.49 | 13d | 1 | 0.21mi |
Listing history 18 events
-
2026-06-18days on market $195,990 Active 682 DOM
-
2026-06-17days on market $195,990 Active 681 DOM
-
2026-06-16days on market $195,990 Active 680 DOM
-
2026-06-15days on market $195,990 Active 679 DOM
-
2026-06-14days on market $195,990 Active 677 DOM
-
2026-06-13days on market $195,990 Active 676 DOM
-
2026-06-10days on market $195,990 Active 674 DOM
-
2026-06-09days on market $195,990 Active 673 DOM
-
2026-06-08days on market $195,990 Active 672 DOM
-
2026-06-07days on market $195,990 Active 671 DOM
-
2026-06-05days on market $195,990 Active 668 DOM
-
2026-06-03days on market $195,990 Active 667 DOM
-
2026-06-02days on market $195,990 Active 666 DOM
-
2026-06-01days on market $195,990 Active 665 DOM
-
2026-05-31days on market $195,990 Active 664 DOM
-
2026-05-30days on market $195,990 Active 663 DOM
-
2025-04-01price $195,990 152-char remark
Show marketing remark (152 chars)
- Open Floor Plan - Three Bedrooms, Two Bathrooms - Two-Car Garage - Brick and Siding Exterior - Recessed Lighting in Kitchen - Walk-In Master Closet
-
2024-08-05$193,990 Active 152-char remark
Show marketing remark (152 chars)
- Open Floor Plan - Three Bedrooms, Two Bathrooms - Two-Car Garage - Brick and Siding Exterior - Recessed Lighting in Kitchen - Walk-In Master Closet
ⓘ Source: listings_history table (triggers on properties + properties_extension) + one-shot
backfill from property_details.listing_events for pre-trigger history.
Nearby sold comps map
Loading sold comps map…
Walkable amenities ~0.75 mi
Loading nearby amenities…
Taxation est. · year 1
- Rental income
- $22,800
- − Mortgage interest
- −$11,660
- − Property taxes
- −$3,122
- − Insurance
- −$1,041
- − Repairs & maintenance
- −$1,824
- − Management
- −$1,824
- − Depreciation
- −$6,055
- Taxable loss
- −$2,726
- Est. tax savings @ 24.0%
- +$654
- After-tax cash flow
- $1,404/yr
For passive investors: Depreciation is non-cash, so a rental often shows a tax loss while cash-flowing — sheltering income. Rental losses are passive: they offset passive income freely, and up to $25,000/yr can offset ordinary (W-2) income if you actively participate and your MAGI is under $100k (phasing out to $0 by $150k); unused losses carry forward. On sale, claimed depreciation is recaptured at up to 25%, and gains may owe capital-gains tax (a 1031 exchange can defer both). Figures are a year-1 estimate at your 24.0% rate — not tax advice; consult a CPA.
Condition & rehab AI · 2 photos
This single-family home is in excellent condition with no visible repairs or maintenance needed. It offers a good return on investment with updates that can significantly increase its resale and rental value.
Value-add opportunities
- Both Painting exterior and interior — Enhances curb appeal and interior aesthetics
- Both Landscaping improvements — Enhances curb appeal and adds value
- Both New flooring in bathrooms and kitchen — Improves functionality and aesthetics
- Both New lighting fixtures — Enhances interior aesthetics and energy efficiency
Renovation cost estimate screening
Value-add ROI direction
- Both Painting exterior and interior — Enhances curb appeal and interior aesthetics ↑
- Both Landscaping improvements — Enhances curb appeal and adds value ↑
- Both New flooring in bathrooms and kitchen — Improves functionality and aesthetics ↑
- Both New lighting fixtures — Enhances interior aesthetics and energy efficiency ↑
ⓘ Cost ranges are severity-bucket heuristics (US national rule-of-thumb). Get contractor quotes + a written scope before underwriting a rehab budget.
Schools (NCES district)
- District
- Lafayette Parish
- NCES district ID
- 2200870
- Math proficiency
- 38% ▼ -32.00%
- Reading proficiency
- 46% ▼ -24.00%
- Median HH income
- $50,238
- Composite
- 36.15/100
- National rank
- #4741
- State rank
- #19 of 98 in LA
Livability — Duson
- Score
- 66/100
- State rank
- #134
- US rank
- #12322
Category grades
Schools grade is shown separately in the Schools card above.
Census & demographics
- Census place
- Duson, LA
- Population (ZIP)
- 13,557
Population outlook (Lafayette County) Hauer SSP2
- Today (2025)
- 280,930 people
- By 2030
- 301,092 · +7.2%
- By 2040
- 339,456 · +20.8%
- By 2050
- 375,156 · +33.5%
- By 2075
- 451,672 · +60.8%
- By 2100
- 497,203 · +77.0%
Race, ethnicity, and origin ACS 2023
- Neighborhood character
- Diverse neighborhood (Simpson 0.55)
- Race & ethnicity
- White 62% Black 25% Hispanic / Latino 6% Two or more races 6%
- Hispanic origin (detail)
- Common ancestry
- Lithuanian 16% English 1% Iranian 1%
- Foreign-born
- 6% · Canada
- Languages at home
- 90% English-only · Spanish 5% French/Haitian/Cajun 4%
Political lean MEDSL · Lafayette
- 2024 margin
- Solid R (+31.4) · D 33.5% · R 64.8% · Other 1.7%
- 2008→2024 swing
- -0.1pp no change · 2008: -31.3pp · 2024: -31.4pp
- All cycles
- 2024: R+31.4 2020: R+28.7 2016: R+33.6 2012: R+33.7 2008: R+31.3
Not yet ingested
- Civics
- —
Market trends
- HPI YoY
- ▼ -23.96%
- Current HPI
- 192.2639
- Rent YoY
- —
- Metro
- —
- State GDP YoY
- ▲ 3.29%
- F500 in state
- 10
Industry mix (Fortune 500 HQ in LA)
| Industry | F500 HQs | Revenue |
|---|---|---|
| Telecommunications | 2 | $23B |
|
||
| Utilities | 1 | $12B |
|
||
| Wholesale / Distribution | 1 | $5B |
|
||
| Advertising | 1 | $2B |
|
||
Price history
+1.0% since first listed2 events — show timeline
- 2025-04-01 Price Changed $195,990 Zillow
- 2024-08-05 Listed $193,990 Zillow
Cash-flow waterfall
monthlySold comps — $/sqft
last 12 mo · ≤1 miLoading sold comps…