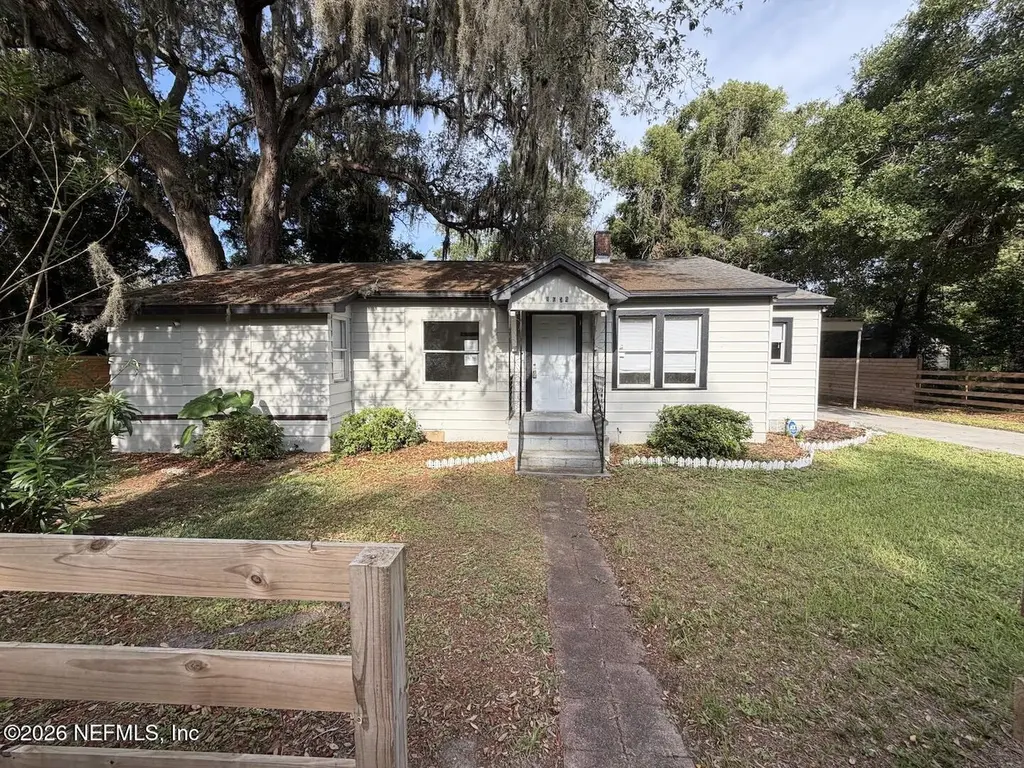
8654 2nd Ave · Jacksonville, FL
Flood risk 6/10 · Moderate
- FEMA flood zone
- X (unshaded)
- Chance of flooding over 30 yrs
- 0.72%
- Est. flood insurance / yr
- $507 – $1,088
Fire risk 1/10 · Minimal
- Est. fire insurance / yr
- $947 – $1,759
Heat risk 9/10 · Severe
- Hot days now (above 107°F)
- 7 days/yr
- Hot days in 30 yrs
- 20 days/yr
Wind risk 9/10 · Severe
- Chance of severe wind over 30 yrs
- 99.0%
Air-quality risk 4/10 · Minor
- Unhealthy air days now
- 6 days/yr
- Unhealthy air days in 30 yrs
- 6 days/yr
Risk factors via First Street. Map © Google.
Why this score? — see what drove the B grade
The composite is a weighted blend of 9 inputs, each scored 0–100. Each bar is that input's sub-score; the figure is the points it added to the 100-point composite (weight × sub-score).
- Cash flow +26.1/30.0
- ARV discount +15.0/15.0
- DSCR +8.8/10.0
- 1% rule +8.4/10.0
- Livability +4.2/5.0
- Schools +3.9/10.0
- Rent growth +2.2/5.0
- Condition / age +2.2/5.0
- Appreciation +0.0/10.0
$113,000
🖨 Deal sheet 📄 Offer letter ✓ Due diligence
Listing remarks MLS
NEWLY RENOVATED, this gorgeous 3 bedroom, 2 bathroom home is what you've been dreaming of! Opening the front door you'll be greeted by radiant natural light that shines in and highlights the new vinyl flooring that spreads through out the home. This living room will be perfect for hosting and family this spring. Stepping into the kitchen you'll notice the beautiful new cabinets, new countertops, new appliances and more! Making your way to the master wing, you'll love how much space you have. Complimented by a large renovated master bathroom with new tile, new lightening, new vanity and more, you'll never want to leave! A few highlights of the property is the extra large backyard, the renovated interior and a new HVAC. This property wont last long, schedule your tour today! $20,000 grant is available for this property, call listing agent for more information!
Key facts
- 0.29 acre lot
- Parking
- Built 1941
Property features AI
Exterior
- Parking: Carport (1 space)
- Utilities: Septic tank; Electricity connected; Sewer connected; Water connected
- Home design: Single-family residence
- Exterior features: Shed(s)
Interior
- Kitchen: Dishwasher; Electric oven; Microwave; Refrigerator
- Bedrooms: 3 bedrooms
- Flooring: Tile; Vinyl
- Bathrooms: 2 full bathrooms
- Heating & cooling: Electric heating; Central air conditioning
- Interior features: Tile and vinyl flooring
Neighborhood map
What this means for you Summary
Snapshot
- This is a 4-bed/1.0-bath single-family listed at $113k. Condition is rated fair.
Deal economics
- At list price, monthly cash flow is $285 ($3k/yr) — positive.
- The deal already cash-flows at list — no discount required.
- Meets the 1% rule at list price ($2k rent vs $113k).
- Cap rate 9.3% vs local median 4.0% in Jacksonville — top-decile yield for the area; either an underpriced asset or a hidden risk that comps aren't pricing in. Stress-test before assuming the spread holds.
Location & tenants
- Location reads 83/100 on livability (#50 in FL, #911 nationally) — a professional / high-income tenant draw. Strengths: amenities A+, commute A+, housing A+.
- Duval (urban): math 46% / reading 45% proficiency, ranked #48 of 73 in FL (top 66%) — families likely to look elsewhere, expect single-tenant / working-renter base with shorter leases.
- Market conditions: Rents soft (-1.4%/yr); 291 active listings in the ZIP; 37 comparable units currently listed for rent nearby; rentals at typical pace (median 24d on market — plan ~3-4 weeks tenant-placement turnaround); lower-income renter base — watch delinquency; 6,503 units permitted in Duval County in 2024 (1,131 in 5+ unit buildings).
- This rent runs 44% of the median local income ($41k/yr) — at the standard rent-burdened threshold; future hikes will face affordability resistance.
Forward outlook
- Local home prices are declining (-3.0%/yr); year-one equity from $781 of loan paydown is wiped out by about $3k of value loss. Plan a longer hold.
- Duval County population projected at +19% by 2050 — long-run rental-demand tailwind backs the buy-and-hold thesis.
Negotiation context
- Only 11 days on market — expect competitive offers; lowballing is unlikely to land.
- 3 sale attempts since 5y ago with the ask held roughly flat each time — persistent listings suggest the price (not the market) is what's stuck; bring a comps-based counter.
Risks & watch-outs
- Watch-outs: property tax is 2.9% of price; built in 1941 — expect roof / HVAC / electrical / plumbing capex.
- Climate carrying-cost: major flood risk; severe wind risk, 99% chance of damaging wind over 30y; extreme-heat days projected 7→20/yr by 2055 (HVAC capex compounding) — expect insurance premiums to compound above CPI over the hold.
Questions for the listing agent
- Have any recent inspections been done? Can we get a copy of the seller's disclosures and any deferred-maintenance estimates?
- Built in 1941 — when were the roof, HVAC, electrical panel, plumbing, and water heater last replaced?
- Property tax is high relative to price — has the assessment been appealed recently, and will the sale trigger a re-assessment?
- Is there a deadline driving the sale (1031 exchange, divorce, estate, relocation)? That informs how much negotiation room exists.
- Schools are B-rated — typically a magnet for longer-tenancy family renters. What's the average tenant stay here, and is there a school-zone premium baked into asking?
- What's the average days-on-market for RENTAL listings here right now (not sales)? A rising rental-DOM trend means longer vacancies and softer asking-rent achievability than the comps imply.
- What's the recent tenant-quality profile in this submarket — average credit score on applications, eviction rate, late-payment / NSF rate, and stable-employment percentage? A property-management company in the area should have these aggregated.
- How much new for-sale + rental construction is in the pipeline within 1–3 miles? Heavy new supply typically softens prices + rents 12–24 months out; constrained supply supports both.
Investment metrics
- 1% rule
- 1.34% ✓
- Cap rate
- 9.32%
- Cash-on-cash
- 10.82%
- DSCR
- 1.48
- GRM
- 6.2
CMA / ARV
- ARV (on-the-fly)
- $155,232
- Comps found
- 12
Show comp detail 12 sales within ~0.75 mi
| Address | Dist | Beds/Ba | Sqft | Sold | Price | $/sf | Match |
|---|---|---|---|---|---|---|---|
| 8608 2nd Ave | 0.06mi | 3/2.0 (-1) | 1,045 (-11%) | 4mo | $155,000 | $148 | 67 |
| 9027 5th Ave | 0.42mi | 3/2.0 (-1) | 1,209 (+3%) | 2mo | $243,020 | $201 | 65 |
| 1116 Stark St | 0.60mi | 3/1.0 (-1) | 1,190 (+1%) | 2mo | $65,000 | $55 | 64 |
| 9124 5th Ave | 0.54mi | 3/1.0 (-1) | 1,220 (+4%) | 2mo | $180,000 | $148 | 62 |
| 9224 10th Ave | 0.73mi | 4/2.0 | 1,170 (-0%) | 0mo | $169,000 | $144 | 61 |
| 1819 Clyde St | 0.60mi | 3/1.0 (-1) | 1,204 (+2%) | 3mo | $137,000 | $114 | 61 |
| 8956 5th Ave | 0.35mi | 3/1.0 (-1) | 1,284 (+9%) | 4mo | $80,000 | $62 | 60 |
| 1436 Forest Hills Rd | 0.40mi | 3/1.0 (-1) | 1,322 (+12%) | 0mo | $182,000 | $138 | 56 |
| 8004 Delaware Ave | 0.55mi | 3/1.0 (-1) | 1,064 (-10%) | 1mo | $60,000 | $56 | 52 |
| 9070 3rd Ave | 0.48mi | 3/2.0 (-1) | 1,300 (+10%) | 0mo | $170,000 | $131 | 51 |
| 9166 3rd Ave | 0.60mi | 4/2.0 | 1,352 (+15%) | 3mo | $178,000 | $132 | 40 |
| 1256 Wainwright Ct | 0.70mi | 4/2.0 | 1,339 (+14%) | 3mo | $160,000 | $119 | 38 |
Match score weights: distance 35% · size 25% · config 20% · recency 20%. Top-matched comps best support the ARV.
Projected returns pro-forma
-3.0% appreciation · 0.0% rent growth · sell at horizon
- IRR
- -3.9%
- Equity multiple
- 0.86×
- Total profit
- $-4,481
- Equity at exit
- $16,849
- IRR
- 1.4%
- Equity multiple
- 1.09×
- Total profit
- $2,749
- Equity at exit
- $9,770
Cash invested: $31,640 (down + closing). Projections, not guarantees.
Landlord ↔ Tenant lean methodology
- Overall (STATE)
- 87 Strongly Landlord-Friendly
- State Florida
- 87 Strongly Landlord-Friendly · R+3
- County
- — inherits STATE
- City
- — inherits STATE
ZIP-level market 32208
- Home prices YoY
- -33.6%
- Rents YoY
- -1.4%
- Active inventory
- 291
- Price-to-rent
- 6.2×
Monthly cashflow live
- Estimated rent
- $1,515 high interval (Pro) →
- Mortgage (P&I)
- −$593
- Tax from tax record
- −$272 /mo · $3,266/yr
- Insurance
- −$47
- HOA
- −$0
- Vacancy / Maint / Mgmt
- −$318
- Net cashflow
- $285
Break-even live
UW: 25.0% down · 7.5% · 30yr · 1.5% tax · 5.0% vac · 8.0% maint · 8.0% mgmt
Financing live
Cash to close
- Down payment
- $28,250
- Closing costs
- $3,390
- Reserves months
- —
- Total cash needed
- —
Loan-product check · same deal, 3 products live
Conventional
25% down · 7.5% · 30yr
- Down + closing
- —
- Monthly P&I
- —
- Monthly cashflow
- —
- DSCR
- —
- Eligible?
- —
Personal DTI + credit; lowest rate.
DSCR
20% down · 8.5% · 30yr
- Down + closing
- —
- Monthly P&I
- —
- Monthly cashflow
- —
- DSCR
- —
- Eligible?
- —
No personal income docs; deal must DSCR.
Hard money
10% down · 12.0% · 12mo
- Down + closing
- —
- Monthly P&I
- —
- Monthly cashflow
- —
- DSCR
- —
- Eligible?
- —
Short-term bridge; refi at stabilization.
Rent comps 37 comps
| Address | Beds | Baths | Sqft | Rent | $/sqft | DOM | Units | Dist |
|---|---|---|---|---|---|---|---|---|
| 8642 2nd Ave Jacksonville, FL | 3.0 | 2.0 | 1074 | $1,245 | $1.16 | 1d | 1 | 0.04mi |
| 8617 3rd Ave Jacksonville, FL | 3.0 | 1.0 | 1048 | $1,200 | $1.15 | 10d | 1 | 0.08mi |
| 8721 4th Ave Jacksonville, FL | 3.0 | 1.5 | 1344 | $1,399 | $1.04 | 23d | 1 | 0.11mi |
| 8918 1st Ave Jacksonville, FL | 3.0 | 2.0 | 1435 | $1,321 | $0.92 | 16d | 1 | 0.29mi |
| 8910 Adams Ave Jacksonville, FL | 4.0 | 2.0 | 1250 | $1,225 | $0.98 | 3d | 1 | 0.34mi |
| 8973 4th Ave Jacksonville, FL | 3.0 | 2.0 | 1230 | $1,438 | $1.17 | 14d | 1 | 0.36mi |
| 9037 6th Ave Jacksonville, FL | 3.0 | 2.0 | 1156 | $1,400 | $1.21 | 23d | 1 | 0.47mi |
| 9032 8th Ave Jacksonville, FL | 3.0 | 2.0 | 1300 | $1,500 | $1.15 | 23d | 1 | 0.49mi |
| 9050 7th Ave Jacksonville, FL | 3.0 | 1.0 | 896 | $1,485 | $1.66 | 23d | 1 | 0.49mi |
| 9131 4th Ave Jacksonville, FL | 3.0 | 2.0 | 1209 | $1,496 | $1.24 | 21d | 1 | 0.55mi |
| 9124 Adams Ave Jacksonville, FL | 3.0 | 3.0 | 1207 | $1,800 | $1.49 | 23d | 1 | 0.57mi |
| 7927 Reid Ave Jacksonville, FL | 3.0 | 1.0 | 1055 | $1,500 | $1.42 | 23d | 1 | 0.58mi |
| 9131 Jefferson Ave Jacksonville, FL | 3.0 | 1.0 | 910 | $1,350 | $1.48 | 4d | 1 | 0.63mi |
| 1021 Lake Forest Blvd Jacksonville, FL | 3.0 | 1.0 | 1393 | $1,290 | $0.93 | 3d | 1 | 0.64mi |
| 9141 12th Ave Jacksonville, FL | 3.0 | 2.0 | 1209 | $1,598 | $1.32 | 20d | 1 | 0.70mi |
| 9279 6th Ave Jacksonville, FL | 3.0 | 2.0 | 1150 | $1,245 | $1.08 | 4d | 1 | 0.71mi |
| 8253 Lexington Dr Jacksonville, FL | 3.0 | 1.0 | 910 | $1,330 | $1.46 | 23d | 1 | 0.74mi |
| 915 Wayne St Jacksonville, FL | 4.0 | 2.0 | 1220 | $1,313 | $1.08 | 3d | 1 | 0.75mi |
| 9148 13th Ave Jacksonville, FL | 3.0 | 1.0 | 1126 | $1,136 | $1.01 | 4d | 1 | 0.75mi |
| 912 Saratoga Blvd Jacksonville, FL | 3.0 | 1.0 | 930 | $1,250 | $1.34 | 23d | 1 | 0.75mi |
| 1010 Edgewood Ave W Jacksonville, FL | 4.0 | 2.0 | 1450 | $1,250 | $0.86 | 14d | 1 | 0.81mi |
| 1010 Edgewood Ave W Jacksonville, FL | 4.0 | 2.0 | 1450 | $1,250 | $0.86 | 23d | 1 | 0.81mi |
| 2312 Palmdale St Jacksonville, FL | 3.0 | 2.0 | 972 | $1,231 | $1.27 | 23d | 1 | 0.86mi |
| 9346 10th Ave Jacksonville, FL | 3.0 | 1.0 | 985 | $1,825 | $1.85 | 23d | 1 | 0.86mi |
| 2534 Aubrey Ave Jacksonville, FL | 4.0 | 2.0 | 759 | $1,250 | $1.65 | 23d | 1 | 0.91mi |
| 9565 Carbondale Dr W Unit B Jacksonville, FL | 3.0 | 2.0 | 1400 | $2,000 | $1.43 | 23d | 1 | 0.93mi |
| 3015 Lansdell Dr Jacksonville, FL | 3.0 | 1.0 | 1150 | $1,350 | $1.17 | 23d | 1 | 0.94mi |
| 3250 Soutel Dr Jacksonville, FL | 3.0 | 2.0 | 1352 | $1,525 | $1.13 | 23d | 1 | 1.00mi |
| 2389 Hilly Rd Jacksonville, FL | 3.0 | 1.0 | 908 | $1,650 | $1.82 | 23d | 1 | 1.06mi |
| 7345 Linda Dr Jacksonville, FL | 5.0 | 2.0 | 1380 | $1,650 | $1.20 | 23d | 1 | 1.07mi |
| 3344 Soutel Dr Jacksonville, FL | 3.0 | 1.0 | 1142 | $1,325 | $1.16 | 23d | 1 | 1.13mi |
| 2818 Palmdale St Jacksonville, FL | 4.0 | 2.5 | 1484 | $1,900 | $1.28 | 23d | 1 | 1.13mi |
| 5903 Droad St Jacksonville, FL | 3.0 | 1.0 | 1161 | $1,400 | $1.21 | 3d | 1 | 1.18mi |
| 1000 Island Point Dr Jacksonville, FL | 1.0–3.0 | 1.0–2.0 | 949 | $1,684 | $1.77 | 2d | 9 | 1.20mi |
| 1567 Rutledge Ave Jacksonville, FL | 3.0 | 2.0 | 1050 | $1,113 | $1.06 | 23d | 1 | 1.28mi |
| 800 Broward Rd Jacksonville, FL | 1.0–3.0 | 1.0–2.0 | 1028 | $1,711 | $1.66 | 1d | 42 | 1.40mi |
| 780 Island Point Dr Jacksonville, FL | 1.0–3.0 | 1.0–2.0 | 1164 | $2,143 | $1.84 | 3d | 16 | 1.47mi |
Listing history 9 events
-
2026-06-16status $113,000 Pending 11 DOM
-
2026-06-15days on market $113,000 Active 11 DOM
-
2026-06-13days on market $113,000 Active 9 DOM
-
2026-06-13days on market $113,000 Active 8 DOM
-
2026-06-09days on market $113,000 Active 5 DOM
-
2026-06-08days on market $113,000 Active 4 DOM
-
2026-06-07days on market $113,000 Active 3 DOM
-
2026-06-05remarks 490-char remark
-
2026-06-05$113,000 Active 1 DOM
ⓘ Source: listings_history table (triggers on properties + properties_extension) + one-shot
backfill from property_details.listing_events for pre-trigger history.
Tax reassessment forecast FL · Resets to sale price
- Current annual tax
- $3,266 · $272/mo
- Projected year-2 tax
- $3,266 · $272/mo
- Expected delta
- $0/yr ($0/mo · 0.0%)
ⓘ Screening estimate from a state-policy table — verify with the county assessor before closing.
Climate risk First Street
- Flood 6/10 Major FEMA zone X (unshaded) · 72% chance over 30 yrs
- Wildfire 1/10 Low
- Heat 9/10 Extreme 7 d/yr ≥107°F today · 20 d/yr by 30 yrs out
- Wind 9/10 Extreme 99% chance of damaging wind over 30 yrs
- Air quality 4/10 Moderate 6 unhealthy d/yr today · 6 by 30 yrs out
Nearby sold comps map
Loading sold comps map…
Walkable amenities ~0.75 mi
Loading nearby amenities…
Taxation est. · year 1
- Rental income
- $18,184
- − Mortgage interest
- −$6,330
- − Property taxes
- −$3,266
- − Insurance
- −$565
- − Repairs & maintenance
- −$1,455
- − Management
- −$1,455
- − Depreciation
- −$3,287
- Taxable income
- $1,826
- Est. tax owed @ 24.0%
- −$438
- After-tax cash flow
- $2,985/yr
For passive investors: Depreciation is non-cash, so a rental often shows a tax loss while cash-flowing — sheltering income. Rental losses are passive: they offset passive income freely, and up to $25,000/yr can offset ordinary (W-2) income if you actively participate and your MAGI is under $100k (phasing out to $0 by $150k); unused losses carry forward. On sale, claimed depreciation is recaptured at up to 25%, and gains may owe capital-gains tax (a 1031 exchange can defer both). Figures are a year-1 estimate at your 24.0% rate — not tax advice; consult a CPA.
Condition & rehab AI · 11 photos
This home requires moderate renovations to improve its condition and increase its value. The kitchen and bathrooms need updates, and the exterior siding and landscaping require attention.
Repairs flagged
- Minor kitchen backsplash — existing backsplash
- Minor bathroom fixtures — existing fixtures
- Moderate exterior paint — existing siding
- Minor landscaping — existing landscaping
Value-add opportunities
- Resale paint interior walls — enhances curb appeal
- Resale replace kitchen backsplash — modernizes kitchen
- Resale repair exterior siding — improves home's appearance
- Rental landscaping — attracts tenants with a well-maintained yard
Renovation cost estimate screening
| Repair item | Severity | Est. cost |
|---|---|---|
| kitchen backsplash · existing backsplash | Minor | $500–3,000 |
| bathroom fixtures · existing fixtures | Minor | $500–3,000 |
| exterior paint · existing siding | Moderate | $3,000–15,000 |
| landscaping · existing landscaping | Minor | $500–3,000 |
| Total estimated repair cost · 4 items | $4,500–24,000 |
Value-add ROI direction
- Resale paint interior walls — enhances curb appeal ↑
- Resale replace kitchen backsplash — modernizes kitchen ↑
- Resale repair exterior siding — improves home's appearance ↑
- Rental landscaping — attracts tenants with a well-maintained yard ↑
ⓘ Cost ranges are severity-bucket heuristics (US national rule-of-thumb). Get contractor quotes + a written scope before underwriting a rehab budget.
Schools (NCES district)
- District
- Duval
- NCES district ID
- 1200480
- Math proficiency
- 46% ▼ -11.00%
- Reading proficiency
- 45% ▼ -4.00%
- Median HH income
- $48,987
- Composite
- 38.97/100
- National rank
- #4076
- State rank
- #48 of 73 in FL
Livability — Jacksonville
- Score
- 83/100
- State rank
- #50
- US rank
- #911
Category grades
Schools grade is shown separately in the Schools card above.
Census & demographics
- Census place
- Jacksonville, FL
- County
- Duval County · 1,015,274 people
- City population
- 979,034
- Metro
- Jacksonville, FL
- Population (ZIP)
- 32,699
- Household income
- $41,324
- Rent vs Own
- Severe rent burden
- 1765.0
Population outlook (Duval County) Hauer SSP2
- Today (2025)
- 1,013,010 people
- By 2030
- 1,059,228 · +4.6%
- By 2040
- 1,141,439 · +12.7%
- By 2050
- 1,205,258 · +19.0%
- By 2075
- 1,324,282 · +30.7%
- By 2100
- 1,319,620 · +30.3%
Race, ethnicity, and origin ACS 2023
- Neighborhood character
- Predominantly Black (77%)
- Race & ethnicity
- Black 77% White 16% Two or more races 4% Hispanic / Latino 3%
- Common ancestry
- Italian 1%
- Foreign-born
- 2% · Canada
- Languages at home
- 97% English-only · Spanish 2%
Political lean MEDSL · Duval
- 2024 margin
- Toss-up / Even · D 48.7% · R 50.1% · Other 1.2%
- 2008→2024 swing
- +0.4pp no change · 2008: -1.9pp · 2024: -1.5pp
- All cycles
- 2024: R+1.5 2020: D+3.8 2016: R+1.5 2012: R+3.6 2008: R+1.9
Not yet ingested
- Civics
- —
Market trends
- HPI YoY
- ▼ -110.56%
- Current HPI
- 217.9706
- Rent YoY
- ▼ -1.36%
- Metro
- Jacksonville, FL
- State GDP YoY
- ▲ 3.28%
- F500 in state
- 36
Industry mix (Fortune 500 HQ in FL)
| Industry | F500 HQs | Revenue |
|---|---|---|
| Industrial Technology | 2 | $29B |
|
||
| Insurance | 2 | $17B |
|
||
| Retail | 1 | $60B |
|
||
| Technology Distribution | 1 | $58B |
|
||
| Homebuilding | 1 | $35B |
|
||
| Technology Manufacturing | 1 | $35B |
|
||
Price history
+88.3% since first listed12 events — show timeline
- 2026-06-03 Listed $113,000 realMLS
- 2024-04-02 Sold (Public Records) $209,900 Public Records
- 2024-03-22 Sold (MLS) $209,900 realMLS
- 2024-02-11 Pending — realMLS
- 2024-01-18 Listed $209,900 realMLS
- 2023-12-07 Sold (Public Records) $103,100 Public Records
- 2021-04-13 Sold (Public Records) $75,000 Public Records
- 2021-04-07 Sold (MLS) $75,000 realMLS
- 2021-03-21 Pending — realMLS
- 2021-03-21 Contingent — realMLS
- 2021-03-18 Listed $69,900 realMLS
- 2004-01-30 Sold (Public Records) $60,000 Public Records
Property tax history
+27.4%/yrLatest (2025): $3,266 · +60.7% YoY. Source: county tax records.
Cash-flow waterfall
monthlySold comps — $/sqft
last 12 mo · ≤1 miLoading sold comps…