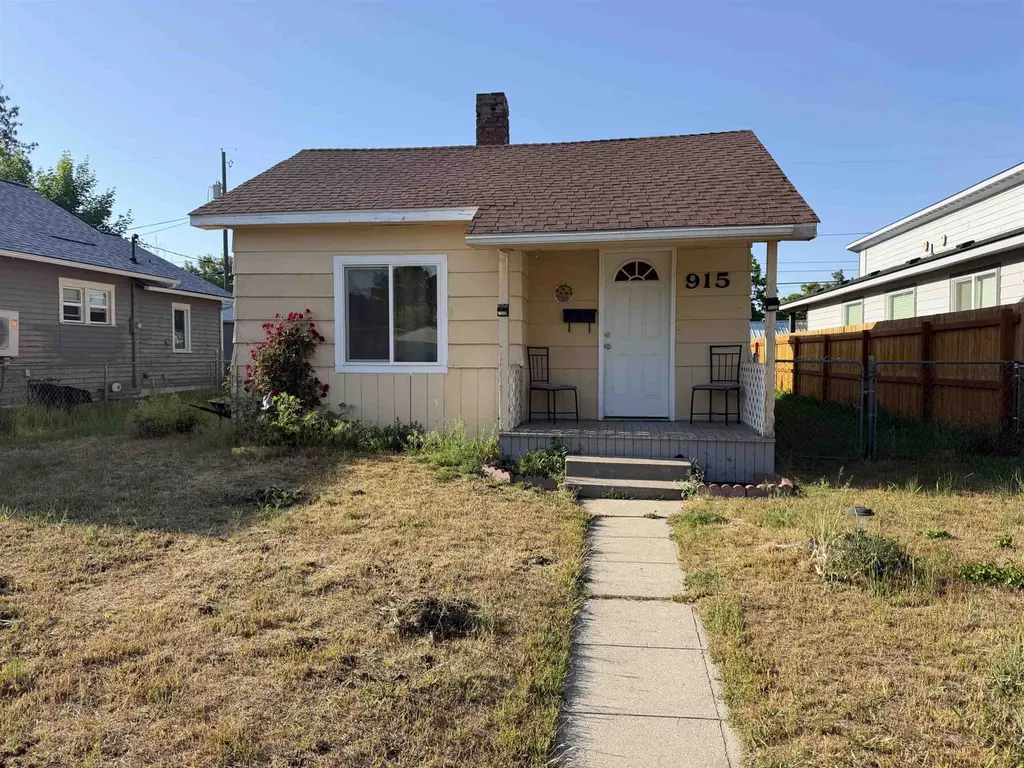
915 E Everett Ave · Spokane, WA
Flood risk 1/10 · Minimal
- FEMA flood zone
- X (unshaded)
- Chance of flooding over 30 yrs
- 0.0%
- Est. flood insurance / yr
- $473 – $860
Fire risk 1/10 · Minimal
- Est. fire insurance / yr
- $604 – $1,122
Heat risk 3/10 · Minor
- Hot days now (above 94°F)
- 7 days/yr
- Hot days in 30 yrs
- 15 days/yr
Wind risk 1/10 · Minimal
- Chance of severe wind over 30 yrs
- —
Air-quality risk 10/10 · Severe
- Unhealthy air days now
- 19 days/yr
- Unhealthy air days in 30 yrs
- 21 days/yr
Risk factors via First Street. Map © Google.
Why this score? — see what drove the D grade
The composite is a weighted blend of 9 inputs, each scored 0–100. Each bar is that input's sub-score; the figure is the points it added to the 100-point composite (weight × sub-score).
- ARV discount +15.0/15.0
- Cash flow +8.0/30.0
- Schools +4.6/10.0
- Livability +4.0/5.0
- Rent growth +3.3/5.0
- Condition / age +2.5/5.0
- DSCR +2.1/10.0
- 1% rule +1.9/10.0
- Appreciation +0.0/10.0
$185,000
🖨 Deal sheet (PDF) 📄 Offer letter ✓ Due diligence
Listing remarks MLS
This 860 SF north side bungalow is cleaned up and ready to move in!2 bed 1 bath with all new plumbing, hot water tank and electrical. New paint, base board heaters and flooring. It is small but very much move in ready. Would make a nice rental for the investor or first time home buyer. Fully fenced. Seller will pay up to 3% concessions.
Key facts
- Unfinished basement
- Large fenced yard
- Bonus room
Tags
Property features AI
Exterior
- Parking: RV parking/driveway access; Alley access
- Utilities: High-speed internet available
- Home design: Single-family residence; One-story; Residential property
- Construction: Wood siding; Composition roof; Has basement; Below-grade finished area included
- Exterior features: Fenced yard; Level lot; City bus service within ~6 blocks; City street with paved road frontage; Alley access; RV access/parking
Interior
- Kitchen: Free-standing range; Refrigerator; Microwave
- Bedrooms: 2 bedrooms
- Heating & cooling: Electric baseboard heat; Wall unit cooling; See remarks for additional heating details
- Interior features: Partial, unfinished basement with laundry area; Wall cooling unit(s)
- Laundry & utility: Washer; Dryer; Basement laundry area
Neighborhood map
What this means for you Summary
Snapshot
- This is a 2-bed/1.0-bath single-family listed at $185k.
Deal economics
- At list price, monthly cash flow is $-188 ($-2k/yr) — negative.
- To cash-flow at today's rent, offer at most $152k (18.0% below list).
- To meet the 1% rule (rent ≥ 1% of price), the offer needs to be $128k (30.6% below list).
- Recommended offer: $128k (30.6% below list) — sets the bar for 1% rule.
- Cap rate 5.1% vs local median 3.2% in Spokane — top-decile yield for the area; either an underpriced asset or a hidden risk that comps aren't pricing in. Stress-test before assuming the spread holds.
Location & tenants
- Location reads 80/100 on livability (#93 in WA, #1,822 nationally) — a professional / high-income tenant draw. Strengths: amenities A+, commute A+, housing A+; Watch: crime F.
- Spokane School District (urban): math 47% / reading 58% proficiency, ranked #136 of 291 in WA (top 47%) — acceptable for families but not a draw, mixed tenant base, ~2y average lease.
- Zoned schools: Lidgerwood Elementary (315 students, 88% FRL); Garry Middle School (569 students, 88% FRL); Rogers High School (1,536 students, 83% FRL) — zoned schools average 86% FRL vs 50% district-wide (37 pts higher); higher-poverty schools than district average — tighter screening recommended.
- Market conditions: Rents rising (+3.2%/yr); 241 active listings in the ZIP; 37 comparable units currently listed for rent nearby; rentals at typical pace (median 25d on market — plan ~3-4 weeks tenant-placement turnaround); 3,608 units permitted in Spokane County in 2024 (1,792 in 5+ unit buildings).
Forward outlook
- Local home prices are declining (-3.0%/yr); year-one equity from $1k of loan paydown is wiped out by about $6k of value loss. Plan a longer hold.
- Spokane County population projected at +13% by 2050 — modest demand growth; plan on rents tracking national, not racing it.
Negotiation context
- Only 5 days on market — expect competitive offers; lowballing is unlikely to land.
- 10 sale attempts since 26y ago with the ask held roughly flat each time — persistent listings suggest the price (not the market) is what's stuck; bring a comps-based counter.
- Current owner paid $70k; list at $185k implies a 165% gain — meaningful room to come down on a strong offer.
Risks & watch-outs
- Watch-outs: built in 1909 — expect roof / HVAC / electrical / plumbing capex.
Questions for the listing agent
- What do current leases actually rent for vs. the listed asking? Can we see a recent rent roll and the last 12 months of T-12 income?
- Built in 1909 — when were the roof, HVAC, electrical panel, plumbing, and water heater last replaced?
- Is there a deadline driving the sale (1031 exchange, divorce, estate, relocation)? That informs how much negotiation room exists.
- Schools are B-rated — typically a magnet for longer-tenancy family renters. What's the average tenant stay here, and is there a school-zone premium baked into asking?
- Crime grade is F in this area — have there been break-ins, vandalism, or insurance claims at this property in the last 3 years? What carrier currently insures it and at what premium?
- The area grade is low — what's the realistic commute time and amenity access for the typical tenant pool here? Any planned neighborhood developments (good or bad) we should know about?
- What's the average days-on-market for RENTAL listings here right now (not sales)? A rising rental-DOM trend means longer vacancies and softer asking-rent achievability than the comps imply.
- What's the recent tenant-quality profile in this submarket — average credit score on applications, eviction rate, late-payment / NSF rate, and stable-employment percentage? A property-management company in the area should have these aggregated.
- How much new for-sale + rental construction is in the pipeline within 1–3 miles? Heavy new supply typically softens prices + rents 12–24 months out; constrained supply supports both.
Investment metrics
- 1% rule
- 0.69% ✗
- Cap rate
- 5.07%
- Cash-on-cash
- -4.36%
- DSCR
- 0.81
- GRM
- 12.0
CMA / ARV
- ARV (on-the-fly)
- $251,120
- Comps found
- 12
Show comp detail 12 sales within ~0.75 mi
| Address | Dist | Beds/Ba | Sqft | Sold | Price | $/sf | Match |
|---|---|---|---|---|---|---|---|
| 1118 E Olympic Ave | 0.26mi | 2/1.0 | 864 (+0%) | 12mo | $273,000 | $316 | 77 |
| 508 E Wabash St | 0.42mi | 2/1.0 | 857 (-0%) | 10mo | $258,500 | $302 | 72 |
| 617 E Wabash Ave | 0.30mi | 2/1.0 | 808 (-6%) | 10mo | $285,000 | $353 | 68 |
| 1314 E Joseph Ave | 0.33mi | 2/1.0 | 957 (+11%) | 3mo | $235,000 | $246 | 63 |
| 1428 E North Ave | 0.34mi | 3/1.0 (+1) | 956 (+11%) | 3mo | $275,000 | $288 | 58 |
| 1127 E Central Ave | 0.42mi | 3/1.0 (+1) | 900 (+5%) | 12mo | $274,100 | $305 | 58 |
| 1307 E Princeton Ave | 0.51mi | 2/1.0 | 804 (-6%) | 11mo | $267,000 | $332 | 56 |
| 6204 N Morton St | 0.61mi | 3/1.0 (+1) | 918 (+7%) | 1mo | $175,000 | $191 | 54 |
| 1218 E Broad Ave | 0.38mi | 1/1.0 (-1) | 960 (+12%) | 12mo | $245,000 | $255 | 48 |
| 1627 E Nebraska Ave | 0.51mi | 2/1.0 | 970 (+13%) | 11mo | $170,000 | $175 | 46 |
| 222 E Hoffman Ave | 0.65mi | 2/1.0 | 984 (+14%) | 3mo | $250,000 | $254 | 43 |
| 801 E Longfellow Ave | 0.56mi | 3/1.0 (+1) | 948 (+10%) | 11mo | $277,000 | $292 | 43 |
Match score weights: distance 35% · size 25% · config 20% · recency 20%. Top-matched comps best support the ARV.
Projected returns pro-forma
-3.0% appreciation · 3.25% rent growth · sell at horizon
- IRR
- -23.4%
- Equity multiple
- 0.20×
- Total profit
- $-41,681
- Equity at exit
- $27,584
- IRR
- -17.7%
- Equity multiple
- 0.02×
- Total profit
- $-50,521
- Equity at exit
- $15,995
Cash invested: $51,800 (down + closing). Projections, not guarantees.
Landlord ↔ Tenant lean methodology
- Overall (STATE)
- 28 Tenant-Leaning
- State Washington
- 28 Tenant-Leaning · D+8
- County
- — inherits STATE
- City
- — inherits STATE
ZIP-level market 99207
- Home prices YoY
- -21.3%
- Rents YoY
- 3.2%
- Active inventory
- 241
- Price-to-rent
- 12.0×
Monthly cashflow live
- Estimated rent
- $1,284 high interval (Pro) →
- Mortgage (P&I)
- −$970
- Tax from tax record
- −$155 /mo · $1,865/yr
- Insurance
- −$77
- HOA
- −$0
- Vacancy / Maint / Mgmt
- −$270
- Net cashflow
- $-188
Break-even live
Sensitivity live
| Price | -10% $-84 | -5% $-136 | +0% $-188 | +5% $-241 | +10% $-293 |
|---|---|---|---|---|---|
| Rent | -10% $-290 | -5% $-239 | +0% $-188 | +5% $-138 | +10% $-87 |
| Rate | -1.0pp $-95 | -0.5pp $-141 | base $-188 | +0.5pp $-236 | +1.0pp $-285 |
UW: 25.0% down · 7.5% · 30yr · 1.5% tax · 5.0% vac · 8.0% maint · 8.0% mgmt
Financing live
Cash to close
- Down payment
- $46,250
- Closing costs
- $5,550
- Reserves months
- —
- Total cash needed
- —
Loan-product check · same deal, 3 products live
Conventional
25% down · 7.5% · 30yr
- Down + closing
- —
- Monthly P&I
- —
- Monthly cashflow
- —
- DSCR
- —
- Eligible?
- —
Personal DTI + credit; lowest rate.
DSCR
20% down · 8.5% · 30yr
- Down + closing
- —
- Monthly P&I
- —
- Monthly cashflow
- —
- DSCR
- —
- Eligible?
- —
No personal income docs; deal must DSCR.
Hard money
10% down · 12.0% · 12mo
- Down + closing
- —
- Monthly P&I
- —
- Monthly cashflow
- —
- DSCR
- —
- Eligible?
- —
Short-term bridge; refi at stabilization.
Rent comps 37 comps
| Address | Beds | Baths | Sqft | Rent | $/sqft | DOM | Units | Dist |
|---|---|---|---|---|---|---|---|---|
| 824 E North Ave Unit 824 Spokane, WA | 2.0 | 1.0 | 770 | $1,195 | $1.55 | 25d | 1 | 0.09mi |
| 6107 N Standard St Spokane, WA | 2.0 | 1.5 | 850 | $2,350 | $2.76 | 25d | 1 | 0.58mi |
| 6203 N Astor St Unit 2 Spokane, WA | 2.0 | 1.5 | 1100 | $1,400 | $1.27 | 23d | 1 | 0.70mi |
| 6203 N Astor St Spokane, WA | 2.0 | 1.0 | 1100 | $1,400 | $1.27 | 15d | 1 | 0.70mi |
| 617 E Houston Ave Unit HH340 Spokane, WA | 2.0 | 1.0 | 710 | $1,100 | $1.55 | 15d | 1 | 0.78mi |
| 6029 N Mayfair St Unit 7 Spokane, WA | 1.0 | 1.0 | 725 | $1,025 | $1.41 | 15d | 1 | 0.78mi |
| 6018 N Ruby St #8 Spokane, WA | 2.0 | 1.0 | 600 | $995 | $1.66 | 15d | 1 | 0.79mi |
| 910 E Holyoke Ave Spokane, WA | 1.0–2.0 | 1.0 | 755 | $1,425 | $1.89 | 15d | 4 | 0.80mi |
| 1910 E Wellesley Ave Unit 1912 Spokane, WA | 2.0 | 1.0 | 800 | $1,125 | $1.41 | 25d | 1 | 0.80mi |
| 901 E Holyoke Ave Spokane, WA | 1.0 | 1.0 | 588 | $1,075 | $1.83 | 25d | 3 | 0.84mi |
| 6603 N Standard St Unit 6605 Spokane, WA | 2.0 | 1.0 | 750 | $1,200 | $1.60 | 25d | 1 | 0.86mi |
| 709 E Kiernan Ave Spokane, WA | 1.0 | 1.0 | 728 | $1,250 | $1.72 | 25d | 1 | 0.99mi |
| 2506 E Rowan Ave Unit 2508 Spokane, WA | 2.0 | 1.0 | 760 | $1,350 | $1.78 | 25d | 1 | 1.08mi |
| 6980 N Nevada St Spokane, WA | 1.0–2.0 | 1.0 | 622 | $1,383 | $2.22 | 25d | 1 | 1.10mi |
| 121 E Wedgewood Ave Spokane, WA | 1.0–3.0 | 1.0–1.5 | 833 | $1,205 | $1.45 | 15d | 17 | 1.12mi |
| 6601 N Atlantic St Unit 6625 Spokane, WA | 2.0 | 1.0 | 697 | $1,000 | $1.43 | 15d | 1 | 1.13mi |
| 2414 E Francis Ave Unit 1 Spokane, WA | 2.0 | 1.0 | 800 | $1,200 | $1.50 | 15d | 1 | 1.18mi |
| 7024 N Colton St Spokane, WA | 2.0 | 2.0 | 1082 | $1,385 | $1.28 | 15d | 1 | 1.18mi |
| 911 E Bridgeport Ave Unit A Spokane, WA | 2.0 | 1.0 | 800 | $1,120 | $1.40 | 25d | 1 | 1.19mi |
| 1015 E Cozza Dr Unit 14 Spokane, WA | 2.0 | 1.0 | 902 | $1,110 | $1.23 | 25d | 1 | 1.22mi |
| 1015 E Cozza Dr Unit 41 Spokane, WA | 1.0 | 1.0 | 660 | $1,065 | $1.61 | 25d | 1 | 1.22mi |
| 1015 E Cozza Dr Unit 65 Spokane, WA | 1.0 | 1.0 | 660 | $1,065 | $1.61 | 15d | 1 | 1.22mi |
| 1015 E Cozza Dr Unit 165 Spokane, WA | 1.0 | 1.0 | 660 | $1,010 | $1.53 | 15d | 1 | 1.27mi |
| 1015 E Cozza Dr Unit 160 Spokane, WA | 1.0 | 1.0 | 660 | $1,010 | $1.53 | 25d | 1 | 1.28mi |
| 1015 E Cozza Dr Unit 167 Spokane, WA | 1.0 | 1.0 | 660 | $1,050 | $1.59 | 25d | 1 | 1.29mi |
| 7001 N Atlantic St Spokane, WA | 1.0 | 1.0 | 600 | $995 | $1.66 | 25d | 1 | 1.31mi |
| 2901 E Wellesley Ave Unit 1 Spokane, WA | 1.0 | 1.0 | 600 | $1,000 | $1.67 | 25d | 1 | 1.36mi |
| 6105 N Regal St Unit B Spokane, WA | 2.0 | 1.5 | 600 | $1,295 | $2.16 | 15d | 1 | 1.37mi |
| 1011 E Sharpsburg Ave Unit 574 Spokane, WA | 1.0 | 1.0 | 660 | $1,065 | $1.61 | 25d | 1 | 1.39mi |
| 1011 E Sharpsburg Ave Unit 494 Spokane, WA | 2.0 | 1.0 | 902 | $1,150 | $1.27 | 25d | 1 | 1.41mi |
| 6229 N Regal St Unit B Spokane, WA | 2.0 | 1.0 | 822 | $1,150 | $1.40 | 25d | 1 | 1.42mi |
| 3018 E Everett Ave Unit B101 Spokane, WA | 1.0 | 1.0 | 600 | $1,100 | $1.83 | 15d | 1 | 1.43mi |
| 2918 N Hamilton St Spokane, WA | 2.0 | 1.0 | 672 | $1,495 | $2.22 | 25d | 1 | 1.44mi |
| 3015 E Central Ave Apt 1 Spokane, WA | 2.0 | 1.0 | 736 | $1,000 | $1.36 | 25d | 1 | 1.47mi |
| 120 E Euclid Ave Unit 3 Spokane, WA | 2.0 | 1.0 | 640 | $1,095 | $1.71 | 25d | 1 | 1.48mi |
| 3909 N Wall St Spokane, WA | 1.0–2.0 | 1.0–2.0 | 775 | $2,340 | $3.02 | 15d | 4 | 1.48mi |
| 2909 E Rockwell Ave Unit 2909 Spokane, WA | 2.0 | 1.0 | 1008 | $1,500 | $1.49 | 23d | 1 | 1.48mi |
Listing history 30 events
-
2026-06-03status $185,000 Pending 5 DOM
-
2026-06-02days on market $185,000 Active 5 DOM
-
2026-06-01days on market $185,000 Active 4 DOM
-
2026-05-31days on market $185,000 Active 3 DOM
-
2026-05-31days on market $185,000 Active 2 DOM
-
2026-05-28$185,000 Active
-
2015-08-19soldstatus $69,900 340-char remark
Show marketing remark (340 chars)
This 860 SF north side bungalow is cleaned up and ready to move in!2 bed 1 bath with all new plumbing, hot water tank and electrical. New paint, base board heaters and flooring. It is small but very much move in ready. Would make a nice rental for the investor or first time home buyer. Fully fenced. Seller will pay up to 3% concessions.
-
2015-08-18soldstatus $69,900
-
2015-07-21historical 340-char remark
Show marketing remark (340 chars)
This 860 SF north side bungalow is cleaned up and ready to move in!2 bed 1 bath with all new plumbing, hot water tank and electrical. New paint, base board heaters and flooring. It is small but very much move in ready. Would make a nice rental for the investor or first time home buyer. Fully fenced. Seller will pay up to 3% concessions.
-
2015-05-07$69,900 340-char remark
Show marketing remark (340 chars)
This 860 SF north side bungalow is cleaned up and ready to move in!2 bed 1 bath with all new plumbing, hot water tank and electrical. New paint, base board heaters and flooring. It is small but very much move in ready. Would make a nice rental for the investor or first time home buyer. Fully fenced. Seller will pay up to 3% concessions.
-
2015-03-17historical
-
2014-12-07$49,500
-
2012-09-12historical
-
2010-11-08$50,000
-
2010-11-04historical
-
2010-04-10$70,000
-
2007-09-10soldstatus $94,700
-
2007-08-27soldstatus $94,700
-
2007-07-14$92,000
-
2007-07-14historical
-
2007-05-31$92,000
-
2005-05-03soldstatus $47,260
-
2005-03-01$46,000
-
2004-08-30historical
-
2004-04-29$56,000
-
2001-04-20historical
-
2000-12-20$59,900
-
1995-06-30soldstatus $56,000
-
1993-05-11soldstatus $54,000
-
1992-10-15soldstatus $44,950
ⓘ Source: listings_history table (triggers on properties + properties_extension) + one-shot
backfill from property_details.listing_events for pre-trigger history.
Tax reassessment forecast WA · Resets to sale price
- Current annual tax
- $1,865 · $155/mo
- Projected year-2 tax
- $1,865 · $155/mo
- Expected delta
- $0/yr ($0/mo · 0.0%)
ⓘ Screening estimate from a state-policy table — verify with the county assessor before closing.
Climate risk First Street
- Flood 1/10 Low FEMA zone X (unshaded) · 0% chance over 30 yrs
- Wildfire 1/10 Low
- Heat 3/10 Moderate 7 d/yr ≥94°F today · 15 d/yr by 30 yrs out
- Wind 1/10 Low
- Air quality 10/10 Extreme 19 unhealthy d/yr today · 21 by 30 yrs out
Nearby sold comps map
Loading sold comps map…
Walkable amenities ~0.75 mi
Loading nearby amenities…
Taxation est. · year 1
- Rental income
- $15,407
- − Mortgage interest
- −$10,363
- − Property taxes
- −$1,865
- − Insurance
- −$925
- − Repairs & maintenance
- −$1,233
- − Management
- −$1,233
- − Depreciation
- −$5,382
- Taxable loss
- −$5,593
- Est. tax savings @ 24.0%
- +$1,342
- After-tax cash flow
- $-918/yr
For passive investors: Depreciation is non-cash, so a rental often shows a tax loss while cash-flowing — sheltering income. Rental losses are passive: they offset passive income freely, and up to $25,000/yr can offset ordinary (W-2) income if you actively participate and your MAGI is under $100k (phasing out to $0 by $150k); unused losses carry forward. On sale, claimed depreciation is recaptured at up to 25%, and gains may owe capital-gains tax (a 1031 exchange can defer both). Figures are a year-1 estimate at your 24.0% rate — not tax advice; consult a CPA.
Schools (NCES district)
- District
- Spokane School District
- NCES district ID
- 5308250
- Math proficiency
- 47% ▲ 1.00%
- Reading proficiency
- 58% ▲ 1.00%
- Median HH income
- $43,187
- Composite
- 46.1/100
- National rank
- #5477
- State rank
- #136 of 291 in WA
Livability — Spokane
- Score
- 80/100
- State rank
- #93
- US rank
- #1822
Category grades
Schools grade is shown separately in the Schools card above.
Census & demographics
- Census place
- Spokane, WA
- County
- Spokane County · 496,401 people
- City population
- 298,820
- Metro
- Spokane-Spokane Valley, WA
- Population (ZIP)
- 32,770
- Household income
- $60,452
- Rent vs Own
- Severe rent burden
- 1557.0
Population outlook (Spokane County) Hauer SSP2
- Today (2025)
- 531,314 people
- By 2030
- 549,278 · +3.4%
- By 2040
- 577,822 · +8.8%
- By 2050
- 598,188 · +12.6%
- By 2075
- 630,744 · +18.7%
- By 2100
- 622,360 · +17.1%
Race, ethnicity, and origin ACS 2023
- Neighborhood character
- Predominantly White (76%)
- Race & ethnicity
- White 76% Two or more races 10% Hispanic / Latino 8% Black 4% Asian 3% Native American 1%
- Hispanic origin (detail)
- Mexican 5%
- Common ancestry
- Portuguese 3% Lithuanian 3% Slovak 3%
- Foreign-born
- 6% · Canada, Vietnam, Philippines
- Languages at home
- 90% English-only · Spanish 3% Russian/Polish/Slavic 1% Other Asian/Pacific 1%
Political lean MEDSL · Spokane
- 2024 margin
- Toss-up / Even · D 46.0% · R 51.0% · Other 3.0%
- 2008→2024 swing
- -3.8pp toward R · 2008: -1.1pp · 2024: -5.0pp
- All cycles
- 2024: R+5.0 2020: R+4.3 2016: R+8.3 2012: R+6.3 2008: R+1.1
Not yet ingested
- Civics
- —
Market trends
- HPI YoY
- ▼ -103.43%
- Current HPI
- 381.758
- Rent YoY
- ▲ 3.25%
- Metro
- Spokane-Spokane Valley, WA
- State GDP YoY
- ▲ 4.65%
- F500 in state
- 22
Industry mix (Fortune 500 HQ in WA)
| Industry | F500 HQs | Revenue |
|---|---|---|
| Retail | 2 | $269B |
|
||
| Technology / Retail | 1 | $638B |
|
||
| Technology | 1 | $245B |
|
||
| Telecommunications | 1 | $38B |
|
||
| Food / Beverage | 1 | $36B |
|
||
| Automotive / Trucks | 1 | $34B |
|
||
Price history
+311.6% since first listed25 events — show timeline
- 2026-05-28 Listed $185,000 SPOKANEMLS as Distributed by MLS Grid
- 2015-08-19 Sold (MLS) $69,900 SPOKANEMLS as Distributed by MLS Grid
- 2015-08-18 Sold (Public Records) $69,900 Public Records
- 2015-07-21 Listing Removed — SPOKANEMLS as Distributed by MLS Grid
- 2015-05-07 Listed $69,900 SPOKANEMLS as Distributed by MLS Grid
- 2015-03-17 Listing Removed — SPOKANEMLS as Distributed by MLS Grid
- 2014-12-07 Listed $49,500 SPOKANEMLS as Distributed by MLS Grid
- 2012-09-12 Listing Removed — SPOKANEMLS as Distributed by MLS Grid
- 2010-11-08 Listed $50,000 SPOKANEMLS as Distributed by MLS Grid
- 2010-11-04 Listing Removed — SPOKANEMLS as Distributed by MLS Grid
- 2010-04-10 Listed $70,000 SPOKANEMLS as Distributed by MLS Grid
- 2007-09-10 Sold (MLS) $94,700 SPOKANEMLS as Distributed by MLS Grid
- 2007-08-27 Sold (Public Records) $94,700 Public Records
- 2007-07-14 Listing Removed — SPOKANEMLS as Distributed by MLS Grid
- 2007-07-14 Listed $92,000 SPOKANEMLS as Distributed by MLS Grid
- 2007-05-31 Listed $92,000 SPOKANEMLS as Distributed by MLS Grid
- 2005-05-03 Sold (MLS) $47,260 SPOKANEMLS as Distributed by MLS Grid
- 2005-03-01 Listed $46,000 SPOKANEMLS as Distributed by MLS Grid
- 2004-08-30 Listing Removed — SPOKANEMLS as Distributed by MLS Grid
- 2004-04-29 Listed $56,000 SPOKANEMLS as Distributed by MLS Grid
- 2001-04-20 Listing Removed — SPOKANEMLS as Distributed by MLS Grid
- 2000-12-20 Listed $59,900 SPOKANEMLS as Distributed by MLS Grid
- 1995-06-30 Sold (Public Records) $56,000 Public Records
- 1993-05-11 Sold (Public Records) $54,000 Public Records
- 1992-10-15 Sold (Public Records) $44,950 Public Records
Property tax history
+7.9%/yrLatest (2026): $1,865 · +3.2% YoY. Source: county tax records.
Cash-flow waterfall
monthlySold comps — $/sqft
last 12 mo · ≤1 miLoading sold comps…