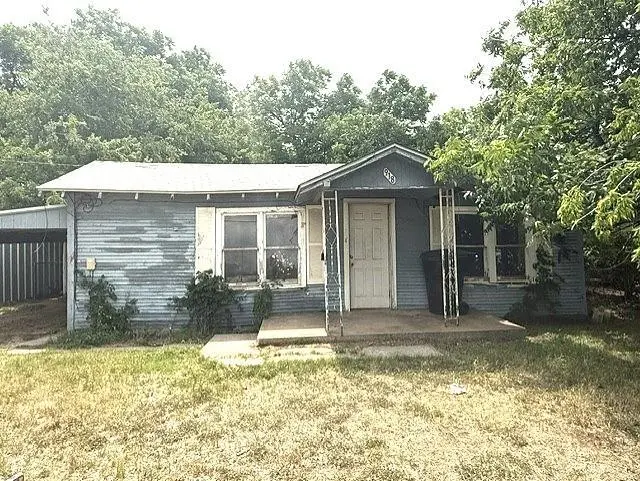
918 Sammons St · Abilene, TX
Flood risk 5/10 · Moderate
- FEMA flood zone
- AE
- Chance of flooding over 30 yrs
- 0.52%
- Est. flood insurance / yr
- $1,737 – $8,500
Fire risk 1/10 · Minimal
- Est. fire insurance / yr
- $1,222 – $2,270
Heat risk 6/10 · Moderate
- Hot days now (above 103°F)
- 7 days/yr
- Hot days in 30 yrs
- 22 days/yr
Wind risk 4/10 · Minor
- Chance of severe wind over 30 yrs
- 13.0%
Air-quality risk 1/10 · Minimal
- Unhealthy air days now
- 0 days/yr
- Unhealthy air days in 30 yrs
- 0 days/yr
Risk factors via First Street. Map © Google.
Why this score? — see what drove the B grade
The composite is a weighted blend of 9 inputs, each scored 0–100. Each bar is that input's sub-score; the figure is the points it added to the 100-point composite (weight × sub-score).
- Cash flow +30.0/30.0
- 1% rule +10.0/10.0
- DSCR +10.0/10.0
- ARV discount +7.5/15.0
- Rent growth +5.0/5.0
- Livability +3.8/5.0
- Schools +2.8/10.0
- Condition / age +2.5/5.0
- Appreciation +0.0/10.0
$65,000
🖨 Deal sheet 📄 Offer letter ✓ Due diligence
Listing remarks MLS
This ranch-style 2 bedroom, 1.1 bathroom home is in the Elmwood neighborhood. Around the corner from Rose Park Adventure Cove and in Abilene Independent School District. New hardwood flooring throughout. Wall cutout between living room and dining room plus big windows give the home a larger, sunnier feel. Lots of cabinet space in kitchen. Good sized front and back yards with a covered front porch.
Key facts
- 8,189 sq ft lot
- Built 1960
- Listed 30 days
Property features AI
Finance
- Other: Property listed as residential single-family; Interior lot size about 0.188 acre; Directions: North on Barrow, left on S 10th St, right onto Sammons; property on the left
- Financial info: Selling as cash; Special listing condition: Real Estate Owned
- HOA & community: No association
Exterior
- Parking: Driveway
- Utilities: Asphalt access; City sewer; City water; Not in a municipal utility district
- Home design: Single-family residence; Residential property; One story; Preowned (built in 1960)
- Construction: Wood construction; Composition roof; Pillar/post/pier foundation; Year built 1960
- Exterior features: Few trees; Interior lot
Interior
- Kitchen: No appliances listed
- Bedrooms: 2 bedrooms (both on main level)
- Flooring: Laminate; Wood; Other
- Bathrooms: 2 full bathrooms
- Heating & cooling: No heating; No cooling
- Interior features: One-level layout; Living room; Dining area; Other interior features
- Laundry & utility: Laundry features noted (details not specified)
Neighborhood map
What this means for you Summary
Snapshot
- This is a 2-bed/1.5-bath single-family listed at $65k.
Deal economics
- At list price, monthly cash flow is $496 ($6k/yr) — positive.
- The deal already cash-flows at list — no discount required.
- Meets the 1% rule at list price ($2k rent vs $65k).
- Recommended offer: $63k (3.0% below list) — sets the bar for market timing.
- Cap rate 23.3% vs local median 6.7% in Abilene — top-decile yield for the area; either an underpriced asset or a hidden risk that comps aren't pricing in. Stress-test before assuming the spread holds.
Location & tenants
- Location reads 75/100 on livability (#142 in TX, #4,037 nationally) — a middle-class / working-renter tenant base. Strengths: cost of living A+, housing A+, health & safety A+; Watch: crime D, commute F.
- Abilene ISD (urban): math 32% / reading 34% proficiency, ranked #575 of 826 in TX (top 70%) — families likely to look elsewhere, expect single-tenant / working-renter base with shorter leases.
- Zoned schools: Austin El (math 48% / reading 49%, grade D, #950 of 4,322 statewide, top 22%, 724 students, 60% FRL) — zoned schools at 60% FRL track the district average.
- Zoned-school proficiency averages 48% at this address vs 33% district-wide (+16 pts) — the actual schools serving this property are materially stronger than the Abilene ISD average implies; a family-tenant draw the district grade alone would hide.
- Market conditions: Rents rising fast (+32.1%/yr); 109 active listings in the ZIP; 12 comparable units currently listed for rent nearby; rentals at typical pace (median 21d on market — plan ~3-4 weeks tenant-placement turnaround); 42% of comp listings sitting > 30 days — soft ceiling on asking rent; 508 units permitted in Taylor County in 2024 (0 in 5+ unit buildings).
Forward outlook
- Local home prices are declining (-3.0%/yr); year-one equity from $449 of loan paydown is wiped out by about $2k of value loss. Plan a longer hold.
- Taylor County population projected at +16% by 2050 — long-run rental-demand tailwind backs the buy-and-hold thesis.
- At projected returns (-3.0% appreciation + 8.0% rent growth), your $18k cash investment doubles in ~4 years — after that, you're playing with house money.
Negotiation context
- It's been on market 31 days — a 3% lower offer ($63k) is reasonable based on typical stale-listing flexibility.
- 4 sale attempts since 19y ago with the ask held roughly flat each time — persistent listings suggest the price (not the market) is what's stuck; bring a comps-based counter.
Risks & watch-outs
- Watch-outs: property tax is 2.5% of price; flood insurance adds $427/mo.
- Climate carrying-cost: in FEMA flood zone AE (mandatory federal flood insurance); extreme-heat days projected 7→22/yr by 2055 (HVAC capex compounding) — expect insurance premiums to compound above CPI over the hold.
Questions for the listing agent
- It's been on market 31 days. Have you received any prior offers? Is the seller open to a 3% concession, seller financing, or rate buy-down credit?
- Built in 1960 — when were the roof, HVAC, electrical panel, plumbing, and water heater last replaced?
- Property tax is high relative to price — has the assessment been appealed recently, and will the sale trigger a re-assessment?
- What's the actual annual flood-insurance premium (NFIP or private), and is the property in a SFHA with mandatory coverage?
- Is there a deadline driving the sale (1031 exchange, divorce, estate, relocation)? That informs how much negotiation room exists.
- Schools are D-rated, which usually means shorter tenancies and higher turnover. Who's the typical renter profile here, and what's been the actual vacancy rate?
- Crime grade is D in this area — have there been break-ins, vandalism, or insurance claims at this property in the last 3 years? What carrier currently insures it and at what premium?
- What's the average days-on-market for RENTAL listings here right now (not sales)? A rising rental-DOM trend means longer vacancies and softer asking-rent achievability than the comps imply.
- What's the recent tenant-quality profile in this submarket — average credit score on applications, eviction rate, late-payment / NSF rate, and stable-employment percentage? A property-management company in the area should have these aggregated.
- How much new for-sale + rental construction is in the pipeline within 1–3 miles? Heavy new supply typically softens prices + rents 12–24 months out; constrained supply supports both.
Investment metrics
- 1% rule
- 2.78% ✓
- Cap rate
- 23.33%
- Cash-on-cash
- 60.85%
- DSCR
- 3.71
- GRM
- 3.0
CMA / ARV
- ARV (on-the-fly)
- $167,580
- Comps found
- 12
Show comp detail 12 sales within ~0.75 mi
| Address | Dist | Beds/Ba | Sqft | Sold | Price | $/sf | Match |
|---|---|---|---|---|---|---|---|
| 1142 Matador St | 0.24mi | 3/2.0 (+1) | 1,165 (+2%) | 2mo | $65,000 | $56 | 76 |
| 1333 Portland Ave | 0.56mi | 2/1.0 | 1,149 (+1%) | 4mo | $140,000 | $122 | 67 |
| 3349 S 3rd St | 0.65mi | 2/2.0 | 1,136 (-0%) | 1mo | $170,500 | $150 | 66 |
| 2433 S 11th St | 0.50mi | 2/2.0 | 1,222 (+7%) | 2mo | $180,000 | $147 | 62 |
| 3109 S 5th St | 0.46mi | 3/2.0 (+1) | 1,072 (-6%) | 1mo | $165,000 | $154 | 61 |
| 1010 Albany | 0.37mi | 2/1.0 | 1,267 (+11%) | 2mo | $215,000 | $170 | 60 |
| 3350 S 4th St | 0.62mi | 3/1.0 (+1) | 1,164 (+2%) | 1mo | $80,000 | $69 | 60 |
| 773 S Willis St | 0.31mi | 3/1.0 (+1) | 1,008 (-12%) | 1mo | $150,000 | $149 | 58 |
| 2225 Melrose St | 0.62mi | 3/1.0 (+1) | 1,080 (-5%) | 3mo | $155,000 | $144 | 53 |
| 310 S Mockingbird Ln | 0.59mi | 2/1.0 | 1,020 (-10%) | 1mo | $115,000 | $113 | 52 |
| 1425 Matador St | 0.53mi | 2/1.0 | 1,008 (-12%) | 4mo | $150,000 | $149 | 50 |
| 441 Sunset Dr | 0.48mi | 3/2.0 (+1) | 1,280 (+12%) | 4mo | $159,000 | $124 | 47 |
Match score weights: distance 35% · size 25% · config 20% · recency 20%. Top-matched comps best support the ARV.
Projected returns pro-forma
-3.0% appreciation · 8.0% rent growth · sell at horizon
- IRR
- 36.3%
- Equity multiple
- 2.70×
- Total profit
- $30,960
- Equity at exit
- $9,692
- IRR
- 46.5%
- Equity multiple
- 7.18×
- Total profit
- $112,485
- Equity at exit
- $5,620
Cash invested: $18,200 (down + closing). Projections, not guarantees.
Landlord ↔ Tenant lean methodology
- Overall (STATE)
- 87 Strongly Landlord-Friendly
- State Texas
- 87 Strongly Landlord-Friendly · R+5
- County
- — inherits STATE
- City
- — inherits STATE
ZIP-level market 79605
- Rents YoY
- 32.1%
- Active inventory
- 109
- Price-to-rent
- 3.0×
Monthly cashflow live
- Estimated rent
- $1,809 high interval (Pro) →
- Mortgage (P&I)
- −$341
- Tax from tax record
- −$138 /mo · $1,657/yr
- Insurance
- −$27
- Flood insurance flood zone
- −$427 /mo · $5,118/yr
- HOA
- −$0
- Vacancy / Maint / Mgmt
- −$380
- Net cashflow
- $496
Break-even live
UW: 25.0% down · 7.5% · 30yr · 1.5% tax · 5.0% vac · 8.0% maint · 8.0% mgmt
Financing live
Cash to close
- Down payment
- $16,250
- Closing costs
- $1,950
- Reserves months
- —
- Total cash needed
- —
Loan-product check · same deal, 3 products live
Conventional
25% down · 7.5% · 30yr
- Down + closing
- —
- Monthly P&I
- —
- Monthly cashflow
- —
- DSCR
- —
- Eligible?
- —
Personal DTI + credit; lowest rate.
DSCR
20% down · 8.5% · 30yr
- Down + closing
- —
- Monthly P&I
- —
- Monthly cashflow
- —
- DSCR
- —
- Eligible?
- —
No personal income docs; deal must DSCR.
Hard money
10% down · 12.0% · 12mo
- Down + closing
- —
- Monthly P&I
- —
- Monthly cashflow
- —
- DSCR
- —
- Eligible?
- —
Short-term bridge; refi at stabilization.
Rent comps 12 comps
| Address | Beds | Baths | Sqft | Rent | $/sqft | DOM | Units | Dist |
|---|---|---|---|---|---|---|---|---|
| 3250 College St Abilene, TX | 2.0 | 1.0 | 1148 | $1,595 | $1.39 | 21d | 1 | 0.42mi |
| 889 Ross Ave Abilene, TX | 2.0 | 1.0 | 1223 | $1,700 | $1.39 | 21d | 1 | 0.46mi |
| 3173 Hunt St Abilene, TX | 3.0 | 1.5 | 1300 | $2,250 | $1.73 | 43d | 1 | 0.72mi |
| 234 Clyde St Abilene, TX | 3.0 | 1.0 | 998 | $1,995 | $2.00 | 13d | 1 | 0.77mi |
| 1934 Portland Ave Abilene, TX | 3.0 | 2.0 | 1108 | $1,900 | $1.71 | 43d | 1 | 0.96mi |
| 1841 S 14th St Abilene, TX | 2.0 | 1.0 | 750 | $1,300 | $1.73 | 21d | 1 | 0.96mi |
| 417 Meander St Abilene, TX | 3.0 | 2.0 | 872 | $1,814 | $2.08 | 13d | 1 | 1.04mi |
| 619 Poplar St Abilene, TX | 2.0 | 1.0 | 884 | $1,695 | $1.92 | 13d | 1 | 1.26mi |
| 1649 Palm St Abilene, TX | 2.0 | 1.0 | 760 | $2,500 | $3.29 | 43d | 1 | 1.32mi |
| 1651 Palm St Abilene, TX | 2.0 | 1.0 | 760 | $2,500 | $3.29 | 43d | 1 | 1.32mi |
| 841 S San Jose Dr Abilene, TX | 2.0 | 1.0 | 1122 | $3,000 | $2.67 | 21d | 1 | 1.36mi |
| 2400 Buffalo Gap Rd Abilene, TX | 1.0 | 1.0 | 700 | $1,000 | $1.43 | 43d | 1 | 1.42mi |
Listing history 33 events
-
2026-06-19days on market $65,000 Active 31 DOM
-
2026-06-18days on market $65,000 Active 30 DOM
-
2026-06-17days on market $65,000 Active 29 DOM
-
2026-06-16days on market $65,000 Active 28 DOM
-
2026-06-15days on market $65,000 Active 27 DOM
-
2026-06-14days on market $65,000 Active 25 DOM
-
2026-06-13days on market $65,000 Active 24 DOM
-
2026-06-10days on market $65,000 Active 22 DOM
-
2026-06-09days on market $65,000 Active 21 DOM
-
2026-06-08days on market $65,000 Active 20 DOM
-
2026-06-07days on market $65,000 Active 19 DOM
-
2026-06-03days on market $65,000 Active 15 DOM
-
2026-06-02days on market $65,000 Active 14 DOM
-
2026-06-01days on market $65,000 Active 13 DOM
-
2026-05-31days on market $65,000 Active 12 DOM
-
2026-05-30days on market $65,000 Active 11 DOM
-
2026-05-19$65,000 Active
-
2021-03-02soldstatus
-
2021-02-19soldstatus Sold 400-char remark
Show marketing remark (400 chars)
This ranch-style 2 bedroom, 1.1 bathroom home is in the Elmwood neighborhood. Around the corner from Rose Park Adventure Cove and in Abilene Independent School District. New hardwood flooring throughout. Wall cutout between living room and dining room plus big windows give the home a larger, sunnier feel. Lots of cabinet space in kitchen. Good sized front and back yards with a covered front porch.
-
2021-01-15status Pending 400-char remark
Show marketing remark (400 chars)
This ranch-style 2 bedroom, 1.1 bathroom home is in the Elmwood neighborhood. Around the corner from Rose Park Adventure Cove and in Abilene Independent School District. New hardwood flooring throughout. Wall cutout between living room and dining room plus big windows give the home a larger, sunnier feel. Lots of cabinet space in kitchen. Good sized front and back yards with a covered front porch.
-
2021-01-05historical Active Option Contract 400-char remark
Show marketing remark (400 chars)
This ranch-style 2 bedroom, 1.1 bathroom home is in the Elmwood neighborhood. Around the corner from Rose Park Adventure Cove and in Abilene Independent School District. New hardwood flooring throughout. Wall cutout between living room and dining room plus big windows give the home a larger, sunnier feel. Lots of cabinet space in kitchen. Good sized front and back yards with a covered front porch.
-
2020-11-27$65,000 Active 400-char remark
Show marketing remark (400 chars)
This ranch-style 2 bedroom, 1.1 bathroom home is in the Elmwood neighborhood. Around the corner from Rose Park Adventure Cove and in Abilene Independent School District. New hardwood flooring throughout. Wall cutout between living room and dining room plus big windows give the home a larger, sunnier feel. Lots of cabinet space in kitchen. Good sized front and back yards with a covered front porch.
-
2015-01-20soldstatus $79,000
-
2015-01-16soldstatus Sold 182-char remark
Show marketing remark (182 chars)
This house is currently leased and rents for $600 per month. The potential for increased rents exist for this home as houses in this neighborhood, typically, lease for . 70 per sqft.
-
2014-12-29status Pending 182-char remark
Show marketing remark (182 chars)
This house is currently leased and rents for $600 per month. The potential for increased rents exist for this home as houses in this neighborhood, typically, lease for . 70 per sqft.
-
2014-12-18historical Active Option Contract 182-char remark
Show marketing remark (182 chars)
This house is currently leased and rents for $600 per month. The potential for increased rents exist for this home as houses in this neighborhood, typically, lease for . 70 per sqft.
-
2014-10-08price $41,000 182-char remark
Show marketing remark (182 chars)
This house is currently leased and rents for $600 per month. The potential for increased rents exist for this home as houses in this neighborhood, typically, lease for . 70 per sqft.
-
2014-10-07$42,000 Active 182-char remark
Show marketing remark (182 chars)
This house is currently leased and rents for $600 per month. The potential for increased rents exist for this home as houses in this neighborhood, typically, lease for . 70 per sqft.
-
2007-09-11soldstatus
-
2007-09-10soldstatus
-
2007-08-06historical
-
2007-06-12$31,900
-
2002-07-25soldstatus
ⓘ Source: listings_history table (triggers on properties + properties_extension) + one-shot
backfill from property_details.listing_events for pre-trigger history.
Tax reassessment forecast TX · Resets to sale price
- Current annual tax
- $1,657 · $138/mo
- Projected year-2 tax
- $1,657 · $138/mo
- Expected delta
- $0/yr ($0/mo · 0.0%)
ⓘ Screening estimate from a state-policy table — verify with the county assessor before closing.
Climate risk First Street
- Flood 5/10 Major FEMA zone AE · 52% chance over 30 yrs
- Wildfire 1/10 Low
- Heat 6/10 Major 7 d/yr ≥103°F today · 22 d/yr by 30 yrs out
- Wind 4/10 Moderate 13% chance of damaging wind over 30 yrs
- Air quality 1/10 Low 0 unhealthy d/yr today · 0 by 30 yrs out
Nearby sold comps map
Loading sold comps map…
Walkable amenities ~0.75 mi
Loading nearby amenities…
Taxation est. · year 1
- Rental income
- $21,705
- − Mortgage interest
- −$3,641
- − Property taxes
- −$1,657
- − Insurance
- −$5,444
- − Repairs & maintenance
- −$1,736
- − Management
- −$1,736
- − Depreciation
- −$1,891
- Taxable income
- $5,599
- Est. tax owed @ 24.0%
- −$1,344
- After-tax cash flow
- $4,612/yr
For passive investors: Depreciation is non-cash, so a rental often shows a tax loss while cash-flowing — sheltering income. Rental losses are passive: they offset passive income freely, and up to $25,000/yr can offset ordinary (W-2) income if you actively participate and your MAGI is under $100k (phasing out to $0 by $150k); unused losses carry forward. On sale, claimed depreciation is recaptured at up to 25%, and gains may owe capital-gains tax (a 1031 exchange can defer both). Figures are a year-1 estimate at your 24.0% rate — not tax advice; consult a CPA.
Schools (NCES district)
- District
- Abilene ISD
- NCES district ID
- 4807440
- Math proficiency
- 32% ▼ -11.00%
- Reading proficiency
- 34% ▼ -5.00%
- Median HH income
- $39,782
- Composite
- 27.71/100
- National rank
- #6909
- State rank
- #575 of 826 in TX
Livability — Abilene
- Score
- 75/100
- State rank
- #142
- US rank
- #4037
Category grades
Schools grade is shown separately in the Schools card above.
Census & demographics
- Census place
- Abilene, TX
- County
- Taylor County · 136,672 people
- City population
- 136,672
- Metro
- Abilene, TX
- Population (ZIP)
- 28,467
- Household income
- $62,929
- Rent vs Own
- Severe rent burden
- 1096.0
Population outlook (Taylor County) Hauer SSP2
- Today (2025)
- 145,270 people
- By 2030
- 150,050 · +3.3%
- By 2040
- 159,417 · +9.7%
- By 2050
- 168,883 · +16.3%
- By 2075
- 194,436 · +33.8%
- By 2100
- 203,163 · +39.9%
Race, ethnicity, and origin ACS 2023
- Neighborhood character
- Majority White (63%)
- Race & ethnicity
- White 63% Hispanic / Latino 22% Two or more races 12% Black 8% Asian 2%
- Hispanic origin (detail)
- Mexican 19%
- Common ancestry
- Slovak 2% Lithuanian 1% Serbian 1%
- Foreign-born
- 6% · Canada
- Languages at home
- 84% English-only · Spanish 14% German/W. Germanic 1% Other Asian/Pacific 0%
Political lean MEDSL · Taylor
- 2024 margin
- Solid R (+49.8) · D 24.6% · R 74.4% · Other 1.0%
- 2008→2024 swing
- -4.2pp toward R · 2008: -45.6pp · 2024: -49.8pp
- All cycles
- 2024: R+49.8 2020: R+45.3 2016: R+51.1 2012: R+53.6 2008: R+45.6
Not yet ingested
- Civics
- —
Market trends
- HPI YoY
- ▼ -181.75%
- Current HPI
- 201.2341
- Rent YoY
- ▲ 32.08%
- Metro
- Abilene, TX
- State GDP YoY
- ▲ 3.95%
- F500 in state
- 110
Industry mix (Fortune 500 HQ in TX)
| Industry | F500 HQs | Revenue |
|---|---|---|
| Energy | 16 | $1,198B |
|
||
| Technology | 5 | $198B |
|
||
| Engineering / Construction | 4 | $72B |
|
||
| Energy Services | 3 | $60B |
|
||
| Utilities | 3 | $41B |
|
||
| Healthcare | 2 | $330B |
|
||
Price history
+103.8% since first listed17 events — show timeline
- 2026-05-19 Listed $65,000 NTREIS
- 2021-03-02 Sold (Public Records) — Public Records
- 2021-02-19 Sold (MLS) — NTREIS
- 2021-01-15 Pending — NTREIS
- 2021-01-05 Contingent — NTREIS
- 2020-11-27 Listed $65,000 NTREIS
- 2015-01-20 Sold (Public Records) $79,000 Public Records
- 2015-01-16 Sold (MLS) — NTREIS
- 2014-12-29 Pending — NTREIS
- 2014-12-18 Contingent — NTREIS
- 2014-10-08 Price Changed $41,000 NTREIS
- 2014-10-07 Listed $42,000 NTREIS
- 2007-09-11 Sold (Public Records) — Public Records
- 2007-09-10 Sold (MLS) — NTREIS
- 2007-08-06 Listing Removed — NTREIS
- 2007-06-12 Listed $31,900 NTREIS
- 2002-07-25 Sold (Public Records) — Public Records
Property tax history
+7.3%/yrLatest (2025): $1,657 · -20.2% YoY. Source: county tax records.
Cash-flow waterfall
monthlySold comps — $/sqft
last 12 mo · ≤1 miLoading sold comps…