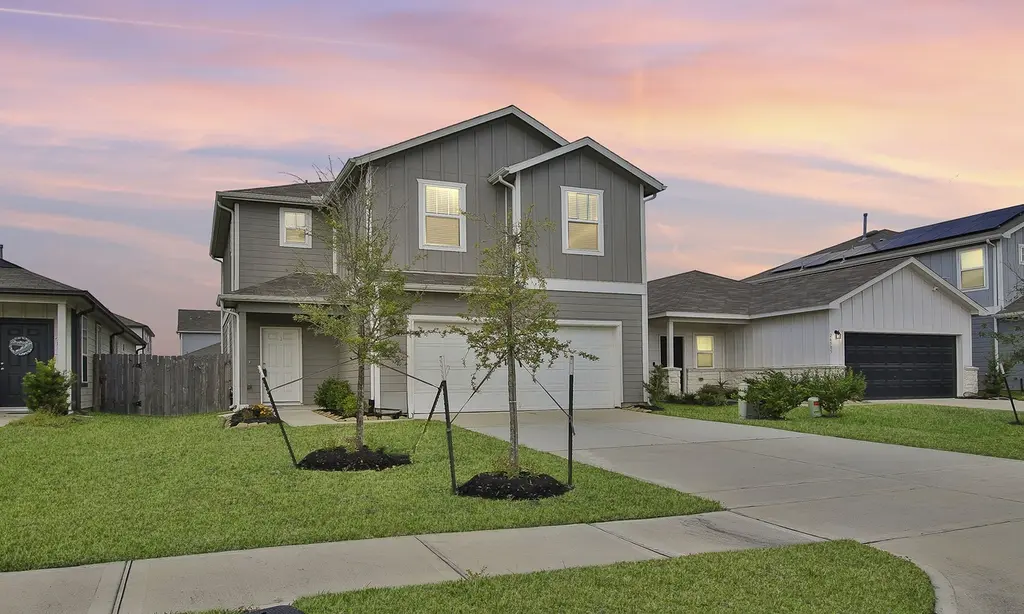
26501 Red Clover Dr · Stagecoach, TX
Flood risk 1/10 · Minimal
- FEMA flood zone
- X (unshaded)
- Chance of flooding over 30 yrs
- 0.0%
- Est. flood insurance / yr
- $507 – $1,088
Fire risk 5/10 · Moderate
- Est. fire insurance / yr
- $1,222 – $2,270
Heat risk 8/10 · Major
- Hot days now (above 110°F)
- 7 days/yr
- Hot days in 30 yrs
- 23 days/yr
Wind risk 8/10 · Major
- Chance of severe wind over 30 yrs
- 99.0%
Air-quality risk 2/10 · Minimal
- Unhealthy air days now
- 2 days/yr
- Unhealthy air days in 30 yrs
- 2 days/yr
Risk factors via First Street. Map © Google.
Why this score? — see what drove the D grade
The composite is a weighted blend of 9 inputs, each scored 0–100. Each bar is that input's sub-score; the figure is the points it added to the 100-point composite (weight × sub-score).
- ARV discount +11.1/15.0
- Cash flow +9.8/30.0
- Schools +5.8/10.0
- Condition / age +4.0/5.0
- 1% rule +3.5/10.0
- Livability +3.1/5.0
- DSCR +2.8/10.0
- Rent growth +2.5/5.0
- Appreciation +0.0/10.0
$248,000
🖨 Deal sheet (PDF) 📄 Offer letter ✓ Due diligence
Listing remarks MLS
Welcome to this delightful Centex home in the Decker Farms Community with 4 bedrooms and 2.5 baths. Luxurious vinyl plank flooring graces the first floor, perfect for entertaining in the open layout. The island kitchen boasts stainless steel appliances, ample 42" cabinetry, and stunning countertops. All bedrooms are situated upstairs for privacy, separating living and entertaining areas. Outside, the fenced backyard offers ample space for private outdoor living, pets, or gatherings.
Key facts
- Island kitchen
- Fenced backyard
- Vinyl plank flooring
Tags
Neighborhood map
What this means for you Summary
Snapshot
- This is a 4-bed/2.5-bath single-family listed at $248k. Condition is rated good.
Deal economics
- At list price, monthly cash flow is $-160 ($-2k/yr) — negative.
- To cash-flow at today's rent, offer at most $220k (11.4% below list).
- To meet the 1% rule (rent ≥ 1% of price), the offer needs to be $211k (14.7% below list).
- Recommended offer: $211k (14.7% below list) — sets the bar for 1% rule.
- Cap rate 5.5% vs local median 4.2% in Stagecoach — top-decile yield for the area; either an underpriced asset or a hidden risk that comps aren't pricing in. Stress-test before assuming the spread holds.
Location & tenants
- Location reads 61/100 on livability (#1,010 in TX) — a middle-class / working-renter tenant base. Strengths: employment A+, housing A+, crime A; Watch: amenities F, commute F, health & safety F.
- Tomball ISD (suburban): math 66% / reading 63% proficiency, ranked #25 of 826 in TX (top 3%) — acceptable for families but not a draw, mixed tenant base, ~2y average lease.
- Zoned schools: Decker Prairie El (math 29% / reading 34%, grade F, #2,396 of 4,322 statewide, top 56%, 755 students, 40% FRL); Tomball Int (math 55% / reading 45%, grade C, #347 of 1,662 statewide, top 21%, 988 students, 46% FRL); Tomball H S (math 74% / reading 69%, grade B+, #111 of 1,632 statewide, top 7%, 2,801 students, 34% FRL).
- Zoned-school proficiency averages 51% at this address vs 64% district-wide (-14 pts) — the specific schools serving this property underperform the Tomball ISD average; the district grade overstates school quality for this exact location.
- Market conditions: 556 active listings in the ZIP; 1 comparable units currently listed for rent nearby; solid renter incomes; 13,259 units permitted in Montgomery County in 2024 (1,402 in 5+ unit buildings).
Forward outlook
- Local home prices are declining (-3.0%/yr); year-one equity from $2k of loan paydown is wiped out by about $7k of value loss. Plan a longer hold.
- Montgomery County population projected at +65% by 2050 — long-run rental-demand tailwind backs the buy-and-hold thesis.
Negotiation context
- It's been on market 104 days — a 9% lower offer ($226k) is reasonable based on typical stale-listing flexibility.
- 8 sale attempts since 4y ago with the ask held roughly flat each time — persistent listings suggest the price (not the market) is what's stuck; bring a comps-based counter.
Risks & watch-outs
- Climate carrying-cost: severe wind risk, 99% chance of damaging wind over 30y; moderate wildfire risk; extreme-heat days projected 7→23/yr by 2055 (HVAC capex compounding) — expect insurance premiums to compound above CPI over the hold.
Questions for the listing agent
- What do current leases actually rent for vs. the listed asking? Can we see a recent rent roll and the last 12 months of T-12 income?
- It's been on market 104 days. Have you received any prior offers? Is the seller open to a 15% concession, seller financing, or rate buy-down credit?
- What does the HOA fee cover, when was the last increase, and are there any pending special assessments or reserve-fund shortfalls?
- Why hasn't it sold? Are there any deal-killer items the seller is aware of (foundation, flood, title, zoning, code violations)?
- Is there a deadline driving the sale (1031 exchange, divorce, estate, relocation)? That informs how much negotiation room exists.
- Schools are F-rated, which usually means shorter tenancies and higher turnover. Who's the typical renter profile here, and what's been the actual vacancy rate?
- The area grade is low — what's the realistic commute time and amenity access for the typical tenant pool here? Any planned neighborhood developments (good or bad) we should know about?
- What's the average days-on-market for RENTAL listings here right now (not sales)? A rising rental-DOM trend means longer vacancies and softer asking-rent achievability than the comps imply.
- What's the recent tenant-quality profile in this submarket — average credit score on applications, eviction rate, late-payment / NSF rate, and stable-employment percentage? A property-management company in the area should have these aggregated.
- How much new for-sale + rental construction is in the pipeline within 1–3 miles? Heavy new supply typically softens prices + rents 12–24 months out; constrained supply supports both.
Investment metrics
- 1% rule
- 0.85% ✗
- Cap rate
- 5.52%
- Cash-on-cash
- -2.76%
- DSCR
- 0.88
- GRM
- 9.8
CMA / ARV
- ARV (median comp)
- $269,566
- List price
- $248,000
- Delta
- -8.00%
- Verdict
- FAIR
- Comps
- 20 within 1.0 mi
Show comp detail 12 sales within ~0.75 mi
| Address | Dist | Beds/Ba | Sqft | Sold | Price | $/sf | Match |
|---|---|---|---|---|---|---|---|
| 26406 Cedar Sedge Dr | 0.23mi | 4/2.5 | 1,642 (-3%) | 2mo | $268,420 | $163 | 83 |
| 26294 Arrowleaf Dr | 0.29mi | 4/2.5 | 1,642 (-3%) | 2mo | $249,910 | $152 | 80 |
| 26382 Cedar Sedge Dr | 0.22mi | 4/2.0 | 1,777 (+5%) | 1mo | $239,090 | $135 | 78 |
| 26306 Arrowleaf Dr | 0.30mi | 4/2.0 | 1,777 (+5%) | 2mo | $274,755 | $155 | 73 |
| 26307 Arrowleaf Dr | 0.28mi | 4/2.5 | 1,850 (+10%) | 0mo | $259,325 | $140 | 71 |
| 26295 Arrowleaf Dr | 0.27mi | 4/2.5 | 1,850 (+10%) | 1mo | $269,040 | $145 | 70 |
| 26275 Arrowleaf Dr | 0.25mi | 4/2.5 | 1,850 (+10%) | 4mo | $288,270 | $156 | 69 |
| 26286 Arrowleaf Dr | 0.28mi | 4/2.5 | 1,850 (+10%) | 2mo | $274,050 | $148 | 69 |
| 26410 Cedar Sedge Dr | 0.24mi | 3/2.0 (-1) | 1,512 (-10%) | 2mo | $256,610 | $170 | 63 |
| 26386 Cedar Sedge Dr | 0.22mi | 3/2.0 (-1) | 1,512 (-10%) | 5mo | $261,870 | $173 | 62 |
| 26299 Arrowleaf Dr | 0.27mi | 3/2.0 (-1) | 1,512 (-10%) | 5mo | $267,310 | $177 | 59 |
| 26290 Arrowleaf Dr | 0.29mi | 3/2.0 (-1) | 1,512 (-10%) | 6mo | $256,610 | $170 | 57 |
Match score weights: distance 35% · size 25% · config 20% · recency 20%. Top-matched comps best support the ARV.
Projected returns pro-forma
-3.0% appreciation · 3.0% rent growth · sell at horizon
- IRR
- -20.8%
- Equity multiple
- 0.28×
- Total profit
- $-50,258
- Equity at exit
- $36,978
- IRR
- -14.1%
- Equity multiple
- 0.19×
- Total profit
- $-56,445
- Equity at exit
- $21,443
Cash invested: $69,440 (down + closing). Projections, not guarantees.
Landlord ↔ Tenant lean methodology
- Overall (STATE)
- 87 Strongly Landlord-Friendly
- State Texas
- 87 Strongly Landlord-Friendly · R+5
- County
- — inherits STATE
- City
- — inherits STATE
ZIP-level market 77355
- Home prices YoY
- -30.3%
- Active inventory
- 556
- Price-to-rent
- 9.8×
Monthly cashflow live
- Estimated rent
- $2,115 medium interval (Pro) →
- Mortgage (P&I)
- −$1,301
- Tax from tax record
- −$373 /mo · $4,472/yr
- Insurance
- −$103
- HOA
- −$54
- Vacancy / Maint / Mgmt
- −$444
- Net cashflow
- $-160
Break-even live
Sensitivity live
| Price | -10% $-19 | -5% $-90 | +0% $-160 | +5% $-230 | +10% $-300 |
|---|---|---|---|---|---|
| Rent | -10% $-327 | -5% $-243 | +0% $-160 | +5% $-76 | +10% $7 |
| Rate | -1.0pp $-35 | -0.5pp $-97 | base $-160 | +0.5pp $-224 | +1.0pp $-289 |
UW: 25.0% down · 7.5% · 30yr · 1.5% tax · 5.0% vac · 8.0% maint · 8.0% mgmt
Financing live
Cash to close
- Down payment
- $62,000
- Closing costs
- $7,440
- Reserves months
- —
- Total cash needed
- —
Loan-product check · same deal, 3 products live
Conventional
25% down · 7.5% · 30yr
- Down + closing
- —
- Monthly P&I
- —
- Monthly cashflow
- —
- DSCR
- —
- Eligible?
- —
Personal DTI + credit; lowest rate.
DSCR
20% down · 8.5% · 30yr
- Down + closing
- —
- Monthly P&I
- —
- Monthly cashflow
- —
- DSCR
- —
- Eligible?
- —
No personal income docs; deal must DSCR.
Hard money
10% down · 12.0% · 12mo
- Down + closing
- —
- Monthly P&I
- —
- Monthly cashflow
- —
- DSCR
- —
- Eligible?
- —
Short-term bridge; refi at stabilization.
Rent comps 1 comps
| Address | Beds | Baths | Sqft | Rent | $/sqft | DOM | Units | Dist |
|---|---|---|---|---|---|---|---|---|
| 26193 Brahman Dr Magnolia, TX | 3.0 | 2.0 | 1204 | $1,925 | $1.60 | 26d | 1 | 0.28mi |
HOA detail
- Monthly dues
- $54 · $648/yr
Listing history 43 events
-
2026-06-21days on market $248,000 Active 104 DOM
-
2026-06-18days on market $248,000 Active 101 DOM
-
2026-06-17days on market $248,000 Active 100 DOM
-
2026-06-16days on market $248,000 Active 99 DOM
-
2026-06-15days on market $248,000 Active 98 DOM
-
2026-06-13days on market $248,000 Active 96 DOM
-
2026-06-13days on market $248,000 Active 95 DOM
-
2026-06-09days on market $248,000 Active 92 DOM
-
2026-06-08days on market $248,000 Active 91 DOM
-
2026-06-07days on market $248,000 Active 90 DOM
-
2026-06-04days on market $248,000 Active 87 DOM
-
2026-06-03days on market $248,000 Active 86 DOM
-
2026-06-02days on market $248,000 Active 85 DOM
-
2026-06-01days on market $248,000 Active 84 DOM
-
2026-05-31days on market $248,000 Active 83 DOM
-
2026-03-09$248,000 Active 492-char remark
Show marketing remark (492 chars)
Welcome to this delightful Centex home in the Decker Farms Community with 4 bedrooms and 2.5 baths. Luxurious vinyl plank flooring graces the first floor, perfect for entertaining in the open layout. The island kitchen boasts stainless steel appliances, ample 42" cabinetry, and stunning countertops. All bedrooms are situated upstairs for privacy, separating living and entertaining areas. Outside, the fenced backyard offers ample space for private outdoor living, pets, or gatherings.
-
2026-03-09historical
Show marketing remark (492 chars)
Welcome to this delightful Centex home in the Decker Farms Community with 4 bedrooms and 2.5 baths. Luxurious vinyl plank flooring graces the first floor, perfect for entertaining in the open layout. The island kitchen boasts stainless steel appliances, ample 42" cabinetry, and stunning countertops. All bedrooms are situated upstairs for privacy, separating living and entertaining areas. Outside, the fenced backyard offers ample space for private outdoor living, pets, or gatherings.
-
2025-10-03$249,000 Active
-
2024-11-21historical
-
2024-11-08status Active
-
2024-11-08historical
-
2024-10-28$240,000 Active
-
2024-10-28historical
-
2024-10-10price $250,000
-
2024-09-11price $260,000
-
2024-08-15price $265,000
-
2024-06-19price $280,000
-
2024-06-19status Active
-
2024-06-15status Pending
-
2024-06-12price $274,000
-
2024-06-11status Option Pending
-
2024-06-11status Active
-
2024-06-07status Option Pending
-
2024-05-30price $282,500
-
2024-04-24price $287,500
-
2024-04-18price $290,000
-
2024-04-04$295,000 Active
-
2024-04-03historical
-
2022-11-17soldstatus Sold
-
2022-07-11status Pending
-
2022-07-08price $260,990
-
2022-06-28price $279,990
-
2022-06-13$282,490 Active
ⓘ Source: listings_history table (triggers on properties + properties_extension) + one-shot
backfill from property_details.listing_events for pre-trigger history.
Tax reassessment forecast TX · Resets to sale price
- Current annual tax
- $4,472 · $373/mo
- Projected year-2 tax
- $4,538 · $378/mo
- Expected delta
- +$66/yr (+$6/mo · 1.5%)
ⓘ Screening estimate from a state-policy table — verify with the county assessor before closing.
Climate risk First Street
- Flood 1/10 Low FEMA zone X (unshaded) · 0% chance over 30 yrs
- Wildfire 5/10 Major
- Heat 8/10 Severe 7 d/yr ≥110°F today · 23 d/yr by 30 yrs out
- Wind 8/10 Severe 99% chance of damaging wind over 30 yrs
- Air quality 2/10 Low 2 unhealthy d/yr today · 2 by 30 yrs out
Nearby sold comps map
Loading sold comps map…
Walkable amenities ~0.75 mi
Loading nearby amenities…
Taxation est. · year 1
- Rental income
- $25,379
- − Mortgage interest
- −$13,892
- − Property taxes
- −$4,472
- − Insurance
- −$1,240
- − Repairs & maintenance
- −$2,030
- − Management
- −$2,030
- − HOA
- −$648
- − Depreciation
- −$7,215
- Taxable loss
- −$6,148
- Est. tax savings @ 24.0%
- +$1,476
- After-tax cash flow
- $-442/yr
For passive investors: Depreciation is non-cash, so a rental often shows a tax loss while cash-flowing — sheltering income. Rental losses are passive: they offset passive income freely, and up to $25,000/yr can offset ordinary (W-2) income if you actively participate and your MAGI is under $100k (phasing out to $0 by $150k); unused losses carry forward. On sale, claimed depreciation is recaptured at up to 25%, and gains may owe capital-gains tax (a 1031 exchange can defer both). Figures are a year-1 estimate at your 24.0% rate — not tax advice; consult a CPA.
Condition & rehab AI · 12 photos
This Centex home in Decker Farms Community is in good condition with a good curb appeal. It has a good layout and is move-in ready with minor maintenance items to address.
Value-add opportunities
- Both Paint exterior trim — Enhances curb appeal and value.
- Both Clean gutters — Improves drainage and property value.
- Both Replace carpet with hardwood — Increases resale value and rental appeal.
- Both Install smart home devices — Enhances convenience and marketability.
Renovation cost estimate screening
Value-add ROI direction
- Both Paint exterior trim — Enhances curb appeal and value. ↑
- Both Clean gutters — Improves drainage and property value. ↑
- Both Replace carpet with hardwood — Increases resale value and rental appeal. ↑
- Both Install smart home devices — Enhances convenience and marketability. ↑
ⓘ Cost ranges are severity-bucket heuristics (US national rule-of-thumb). Get contractor quotes + a written scope before underwriting a rehab budget.
Schools (NCES district)
- District
- Tomball ISD
- NCES district ID
- 4842960
- Math proficiency
- 66% ▼ -6.00%
- Reading proficiency
- 63% ▼ -4.00%
- Median HH income
- $86,552
- Composite
- 58.32/100
- National rank
- #1014
- State rank
- #25 of 826 in TX
Livability — Stagecoach
- Score
- 61/100
- State rank
- #1010
- US rank
- #17937
Category grades
Schools grade is shown separately in the Schools card above.
Census & demographics
- County
- Montgomery County · 663,713 people
- Metro
- Houston-The Woodlands-Sugar Land, TX
- Population (ZIP)
- 32,847
- Household income
- $102,066
- Rent vs Own
- Severe rent burden
- 209.0
Population outlook (Montgomery County) Hauer SSP2
- Today (2025)
- 713,896 people
- By 2030
- 805,263 · +12.8%
- By 2040
- 992,708 · +39.1%
- By 2050
- 1,179,590 · +65.2%
- By 2075
- 1,628,084 · +128.1%
- By 2100
- 1,937,880 · +171.5%
Race, ethnicity, and origin ACS 2023
- Neighborhood character
- Predominantly White (68%)
- Race & ethnicity
- White 68% Hispanic / Latino 25% Two or more races 14% Black 2% Native American 2%
- Hispanic origin (detail)
- Mexican 18%
- Common ancestry
- Slovak 4% Serbian 2% Romanian 2%
- Foreign-born
- 7% · Canada, Jamaica
- Languages at home
- 82% English-only · Spanish 17%
Political lean MEDSL · Montgomery
- 2024 margin
- Solid R (+45.5) · D 26.8% · R 72.3%
- 2008→2024 swing
- +7.2pp toward D · 2008: -52.7pp · 2024: -45.5pp
- All cycles
- 2024: R+45.5 2020: R+43.8 2016: R+51.4 2012: R+60.7 2008: R+52.7
Not yet ingested
- Civics
- —
Market trends
- HPI YoY
- ▼ -116.90%
- Current HPI
- 268.5845
- Rent YoY
- —
- Metro
- Houston-The Woodlands-Sugar Land, TX
- State GDP YoY
- ▲ 3.95%
- F500 in state
- 110
Industry mix (Fortune 500 HQ in TX)
| Industry | F500 HQs | Revenue |
|---|---|---|
| Energy | 16 | $1,198B |
|
||
| Technology | 5 | $198B |
|
||
| Engineering / Construction | 4 | $72B |
|
||
| Energy Services | 3 | $60B |
|
||
| Utilities | 3 | $41B |
|
||
| Healthcare | 2 | $330B |
|
||
Price history
-12.2% since first listed28 events — show timeline
- 2026-03-09 Listing Removed — HARMLS
- 2026-03-09 Listed $248,000 HARMLS
- 2025-10-03 Listed $249,000 HARMLS
- 2024-11-21 Listing Removed — HARMLS
- 2024-11-08 Relisted — HARMLS
- 2024-11-08 Listing Removed — HARMLS
- 2024-10-28 Listing Removed — HARMLS
- 2024-10-28 Listed $240,000 HARMLS
- 2024-10-10 Price Changed $250,000 HARMLS
- 2024-09-11 Price Changed $260,000 HARMLS
- 2024-08-15 Price Changed $265,000 HARMLS
- 2024-06-19 Price Changed $280,000 HARMLS
- 2024-06-19 Relisted — HARMLS
- 2024-06-15 Pending — HARMLS
- 2024-06-12 Price Changed $274,000 HARMLS
- 2024-06-11 Pending — HARMLS
- 2024-06-11 Relisted — HARMLS
- 2024-06-07 Pending — HARMLS
- 2024-05-30 Price Changed $282,500 HARMLS
- 2024-04-24 Price Changed $287,500 HARMLS
- 2024-04-18 Price Changed $290,000 HARMLS
- 2024-04-04 Listed $295,000 HARMLS
- 2024-04-03 Coming Soon — HARMLS
- 2022-11-17 Sold (MLS) — HARMLS
- 2022-07-11 Pending — HARMLS
- 2022-07-08 Price Changed $260,990 HARMLS
- 2022-06-28 Price Changed $279,990 HARMLS
- 2022-06-13 Listed $282,490 HARMLS
Property tax history
+6.1%/yrLatest (2025): $4,472 · +10.0% YoY. Source: county tax records.
Cash-flow waterfall
monthlySold comps — $/sqft
last 12 mo · ≤1 miLoading sold comps…