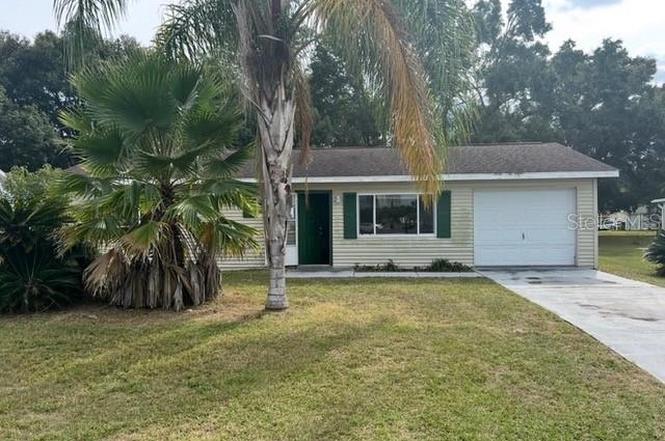
7670 SW 112th Ln · Liberty Triangle, FL
Flood risk 1/10 · Minimal
- FEMA flood zone
- X (unshaded)
- Chance of flooding over 30 yrs
- 0.0%
- Est. flood insurance / yr
- $507 – $1,088
Fire risk 4/10 · Minor
- Est. fire insurance / yr
- $947 – $1,759
Heat risk 8/10 · Major
- Hot days now (above 107°F)
- 7 days/yr
- Hot days in 30 yrs
- 22 days/yr
Wind risk 9/10 · Severe
- Chance of severe wind over 30 yrs
- 99.0%
Air-quality risk 2/10 · Minimal
- Unhealthy air days now
- 2 days/yr
- Unhealthy air days in 30 yrs
- 2 days/yr
Risk factors via First Street. Map © Google.
Why this score? — see what drove the B- grade
The composite is a weighted blend of 9 inputs, each scored 0–100. Each bar is that input's sub-score; the figure is the points it added to the 100-point composite (weight × sub-score).
- Cash flow +26.0/30.0
- ARV discount +15.0/15.0
- 1% rule +9.2/10.0
- DSCR +8.8/10.0
- Schools +3.6/10.0
- Livability +2.5/5.0
- Condition / age +2.5/5.0
- Rent growth +1.9/5.0
- Appreciation +0.0/10.0
$109,500
🖨 Deal sheet (PDF) 📄 Offer letter ✓ Due diligence
Listing remarks MLS
Foreclosure Auction Ends June 16, 2025 at 11:00 AM EST. Discover this inviting 2-bedroom, 2-bathroom home, offering a wonderful opportunity to live in a desirable Ocala neighborhood. Sold As-is with Clear Title. Explore more details and submit your bid through Federa Home App.
Key facts
- Enclosed back porch
- Fenced in backyard
- Updated flooring
Tags
Neighborhood map
What this means for you Summary
Snapshot
- This is a 2-bed/2.0-bath single-family listed at $110k.
Deal economics
- At list price, monthly cash flow is $274 ($3k/yr) — positive.
- The deal already cash-flows at list — no discount required.
- Meets the 1% rule at list price ($2k rent vs $110k).
- Recommended offer: $103k (6.0% below list) — sets the bar for market timing.
- Cap rate 9.3% vs local median 4.5% in Liberty Triangle — top-decile yield for the area; either an underpriced asset or a hidden risk that comps aren't pricing in. Stress-test before assuming the spread holds.
Location & tenants
- Location reads: area grade B — affects rentability + tenant quality, not the cash-flow math above.
- Marion (rural): math 42% / reading 43% proficiency, ranked #61 of 73 in FL (top 84%) — families likely to look elsewhere, expect single-tenant / working-renter base with shorter leases; 61% free/reduced lunch — lower-income household profile, screen leases tightly.
- Zoned schools: Marion Oaks Elementary School (math 38% / reading 39%, grade F, #1,575 of 2,144 statewide, top 74%, 939 students, 65% FRL); Liberty Middle School (math 40% / reading 41%, grade F, #360 of 571 statewide, top 64%, 1,365 students, 54% FRL); West Port High School (math 34% / reading 52%, grade F, #255 of 667 statewide, top 39%, 2,906 students, 52% FRL) — zoned schools at 57% FRL track the district average.
- Market conditions: Rents soft (-2.6%/yr); 858 active listings in the ZIP; 6 comparable units currently listed for rent nearby; rentals at typical pace (median 23d on market — plan ~3-4 weeks tenant-placement turnaround); 7,071 units permitted in Marion County in 2024 (534 in 5+ unit buildings).
Forward outlook
- Local home prices are declining (-3.0%/yr); year-one equity from $757 of loan paydown is wiped out by about $3k of value loss. Plan a longer hold.
- Marion County population projected at +13% by 2050 — modest demand growth; plan on rents tracking national, not racing it.
Negotiation context
- It's been on market 78 days — a 6% lower offer ($103k) is reasonable based on typical stale-listing flexibility.
- 7 sale attempts since 9y ago; this cycle's ask has dropped $20k (15%) from the opening price — seller is motivated, your offer sets the floor, not the list.
- Current owner paid $85k; 29% above their basis — modest negotiation headroom, anchor on the comps not their cost.
Risks & watch-outs
- Climate carrying-cost: severe wind risk, 99% chance of damaging wind over 30y; extreme-heat days projected 7→22/yr by 2055 (HVAC capex compounding) — expect insurance premiums to compound above CPI over the hold.
Questions for the listing agent
- It's been on market 78 days. Have you received any prior offers? Is the seller open to a 6% concession, seller financing, or rate buy-down credit?
- What does the HOA fee cover, when was the last increase, and are there any pending special assessments or reserve-fund shortfalls?
- Why hasn't it sold? Are there any deal-killer items the seller is aware of (foundation, flood, title, zoning, code violations)?
- Is there a deadline driving the sale (1031 exchange, divorce, estate, relocation)? That informs how much negotiation room exists.
- What's the average days-on-market for RENTAL listings here right now (not sales)? A rising rental-DOM trend means longer vacancies and softer asking-rent achievability than the comps imply.
- What's the recent tenant-quality profile in this submarket — average credit score on applications, eviction rate, late-payment / NSF rate, and stable-employment percentage? A property-management company in the area should have these aggregated.
- How much new for-sale + rental construction is in the pipeline within 1–3 miles? Heavy new supply typically softens prices + rents 12–24 months out; constrained supply supports both.
Investment metrics
- 1% rule
- 1.42% ✓
- Cap rate
- 9.30%
- Cash-on-cash
- 10.73%
- DSCR
- 1.48
- GRM
- 5.9
CMA / ARV
- ARV (on-the-fly)
- $151,200
- Comps found
- 8
Show comp detail 8 sales within ~0.75 mi
| Address | Dist | Beds/Ba | Sqft | Sold | Price | $/sf | Match |
|---|---|---|---|---|---|---|---|
| 11123 SW 76th Ter | 0.19mi | 2/2.0 | 864 (0%) | 15mo | $177,500 | $205 | 79 |
| 11068 SW 76th Ter | 0.25mi | 2/2.0 | 864 (0%) | 20mo | $162,500 | $188 | 72 |
| 11140 SW 75th Ter | 0.19mi | 2/2.0 | 960 (+11%) | 1mo | $135,000 | $141 | 72 |
| 11091 SW 76th Ter | 0.22mi | 2/2.0 | 936 (+8%) | 12mo | $164,000 | $175 | 66 |
| 8108 SW 108th Place Rd | 0.49mi | 2/2.0 | 992 (+15%) | 4mo | $160,000 | $161 | 50 |
| 8431 SW 109th Lane Rd | 0.75mi | 1/1.0 (-1) | 912 (+6%) | 4mo | $103,000 | $113 | 43 |
| 10827 SW 79th Ave | 0.55mi | 2/2.0 | 936 (+8%) | 22mo | $162,000 | $173 | 42 |
| 8105 SW 107th Pl | 0.73mi | 2/1.0 | 768 (-11%) | 21mo | $165,000 | $215 | 26 |
Match score weights: distance 35% · size 25% · config 20% · recency 20%. Top-matched comps best support the ARV.
Projected returns pro-forma
-3.0% appreciation · 0.0% rent growth · sell at horizon
- IRR
- -4.3%
- Equity multiple
- 0.85×
- Total profit
- $-4,698
- Equity at exit
- $16,327
- IRR
- 0.8%
- Equity multiple
- 1.04×
- Total profit
- $1,373
- Equity at exit
- $9,468
Cash invested: $30,660 (down + closing). Projections, not guarantees.
Landlord ↔ Tenant lean methodology
- Overall (STATE)
- 87 Strongly Landlord-Friendly
- State Florida
- 87 Strongly Landlord-Friendly · R+3
- County
- — inherits STATE
- City
- — inherits STATE
ZIP-level market 34476
- Rents YoY
- -2.6%
- Active inventory
- 858
- Price-to-rent
- 5.9×
Monthly cashflow live
- Estimated rent
- $1,554 high interval (Pro) →
- Mortgage (P&I)
- −$574
- Tax from tax record
- −$214 /mo · $2,564/yr
- Insurance
- −$46
- HOA
- −$120
- Vacancy / Maint / Mgmt
- −$326
- Net cashflow
- $274
Break-even live
Sensitivity live
| Price | -10% $336 | -5% $305 | +0% $274 | +5% $243 | +10% $212 |
|---|---|---|---|---|---|
| Rent | -10% $151 | -5% $213 | +0% $274 | +5% $335 | +10% $397 |
| Rate | -1.0pp $329 | -0.5pp $302 | base $274 | +0.5pp $246 | +1.0pp $217 |
UW: 25.0% down · 7.5% · 30yr · 1.5% tax · 5.0% vac · 8.0% maint · 8.0% mgmt
Financing live
Cash to close
- Down payment
- $27,375
- Closing costs
- $3,285
- Reserves months
- —
- Total cash needed
- —
Loan-product check · same deal, 3 products live
Conventional
25% down · 7.5% · 30yr
- Down + closing
- —
- Monthly P&I
- —
- Monthly cashflow
- —
- DSCR
- —
- Eligible?
- —
Personal DTI + credit; lowest rate.
DSCR
20% down · 8.5% · 30yr
- Down + closing
- —
- Monthly P&I
- —
- Monthly cashflow
- —
- DSCR
- —
- Eligible?
- —
No personal income docs; deal must DSCR.
Hard money
10% down · 12.0% · 12mo
- Down + closing
- —
- Monthly P&I
- —
- Monthly cashflow
- —
- DSCR
- —
- Eligible?
- —
Short-term bridge; refi at stabilization.
Rent comps 6 comps
| Address | Beds | Baths | Sqft | Rent | $/sqft | DOM | Units | Dist |
|---|---|---|---|---|---|---|---|---|
| 11112 SW 78th Ave Ocala, FL | 2.0 | 1.0 | 672 | $1,150 | $1.71 | 22d | 1 | 0.21mi |
| 8130 SW 108th Street Rd Ocala, FL | 2.0 | 2.0 | 1084 | $1,975 | $1.82 | 22d | 1 | 0.52mi |
| 10441 SW 85th Ct Ocala, FL | 2.0 | 2.0 | 1090 | $1,495 | $1.37 | 22d | 1 | 1.22mi |
| 8942 SW 109th Ln Ocala, FL | 2.0 | 2.0 | 960 | $1,450 | $1.51 | 22d | 1 | 1.26mi |
| 8947 SW 108th Pl Ocala, FL | 2.0 | 2.0 | 1096 | $1,500 | $1.37 | 22d | 1 | 1.30mi |
| 6345 SW 115th Street Rd Ocala, FL | 2.0 | 2.0 | 1008 | $1,400 | $1.39 | 22d | 1 | 1.40mi |
HOA detail
- Monthly dues
- $120 · $1,440/yr
Listing history 20 events
-
2026-04-14status Pending
-
2026-03-30status Active
-
2026-03-29status Pending
-
2026-03-17price $109,500
-
2026-03-11status Active
-
2026-02-25status Pending
-
2026-02-20status Active
-
2026-02-18status Pending
-
2026-02-13price $119,500
-
2026-01-09$129,500 Active
-
2025-06-16historical 277-char remark
Show marketing remark (277 chars)
Foreclosure Auction Ends June 16, 2025 at 11:00 AM EST. Discover this inviting 2-bedroom, 2-bathroom home, offering a wonderful opportunity to live in a desirable Ocala neighborhood. Sold As-is with Clear Title. Explore more details and submit your bid through Federa Home App.
-
2025-06-04$100,000 Active 277-char remark
Show marketing remark (277 chars)
Foreclosure Auction Ends June 16, 2025 at 11:00 AM EST. Discover this inviting 2-bedroom, 2-bathroom home, offering a wonderful opportunity to live in a desirable Ocala neighborhood. Sold As-is with Clear Title. Explore more details and submit your bid through Federa Home App.
-
2018-01-12soldstatus $84,900
-
2018-01-11soldstatus $84,900 177-char remark
Show marketing remark (177 chars)
Picture perfect 2/2/1 in back section of Palm Cay. Lots of updates including granite, vinyl plank flooring and newer appliances. Enclosed vinyl lanai off kitchen. Move-in ready.
-
2017-12-05$84,900 177-char remark
Show marketing remark (177 chars)
Picture perfect 2/2/1 in back section of Palm Cay. Lots of updates including granite, vinyl plank flooring and newer appliances. Enclosed vinyl lanai off kitchen. Move-in ready.
-
2017-06-28soldstatus $67,000
-
2017-06-22soldstatus $67,000
-
2017-05-04$69,999
-
2005-03-09soldstatus $45,000
-
1991-10-01soldstatus $49,900
ⓘ Source: listings_history table (triggers on properties + properties_extension) + one-shot
backfill from property_details.listing_events for pre-trigger history.
Tax reassessment forecast FL · Resets to sale price
- Current annual tax
- $2,564 · $214/mo
- Projected year-2 tax
- $2,564 · $214/mo
- Expected delta
- $0/yr ($0/mo · 0.0%)
ⓘ Screening estimate from a state-policy table — verify with the county assessor before closing.
Climate risk First Street
- Flood 1/10 Low FEMA zone X (unshaded) · 0% chance over 30 yrs
- Wildfire 4/10 Moderate
- Heat 8/10 Severe 7 d/yr ≥107°F today · 22 d/yr by 30 yrs out
- Wind 9/10 Extreme 99% chance of damaging wind over 30 yrs
- Air quality 2/10 Low 2 unhealthy d/yr today · 2 by 30 yrs out
Nearby sold comps map
Loading sold comps map…
Walkable amenities ~0.75 mi
Loading nearby amenities…
Taxation est. · year 1
- Rental income
- $18,646
- − Mortgage interest
- −$6,134
- − Property taxes
- −$2,564
- − Insurance
- −$548
- − Repairs & maintenance
- −$1,492
- − Management
- −$1,492
- − HOA
- −$1,440
- − Depreciation
- −$3,185
- Taxable income
- $1,793
- Est. tax owed @ 24.0%
- −$430
- After-tax cash flow
- $2,858/yr
For passive investors: Depreciation is non-cash, so a rental often shows a tax loss while cash-flowing — sheltering income. Rental losses are passive: they offset passive income freely, and up to $25,000/yr can offset ordinary (W-2) income if you actively participate and your MAGI is under $100k (phasing out to $0 by $150k); unused losses carry forward. On sale, claimed depreciation is recaptured at up to 25%, and gains may owe capital-gains tax (a 1031 exchange can defer both). Figures are a year-1 estimate at your 24.0% rate — not tax advice; consult a CPA.
Schools (NCES district)
- District
- Marion
- NCES district ID
- 1201260
- Math proficiency
- 42% ▼ -7.00%
- Reading proficiency
- 43% ▼ -4.00%
- Median HH income
- $40,015
- Composite
- 35.61/100
- National rank
- #4890
- State rank
- #61 of 73 in FL
Livability — Liberty Triangle
No livability data for this city. (Only ~50 U.S. cities are tracked.)
Census & demographics
- Census place
- Liberty Triangle, FL
- County
- Marion County · 315,796 people
- City population
- 26,397
- Metro
- Ocala, FL
- Population (ZIP)
- 28,997
- Household income
- $65,860
- Rent vs Own
- Severe rent burden
- 204.0
Population outlook (Marion County) Hauer SSP2
- Today (2025)
- 365,905 people
- By 2030
- 376,768 · +3.0%
- By 2040
- 396,555 · +8.4%
- By 2050
- 412,723 · +12.8%
- By 2075
- 446,090 · +21.9%
- By 2100
- 436,193 · +19.2%
Race, ethnicity, and origin ACS 2023
- Neighborhood character
- Diverse neighborhood (Simpson 0.55)
- Race & ethnicity
- White 63% Hispanic / Latino 18% Black 13% Two or more races 10% Asian 1%
- Hispanic origin (detail)
- Mexican 3% Puerto Rican 8% Cuban 3%
- Common ancestry
- Romanian 3% Slovak 3% Lithuanian 3%
- Foreign-born
- 15% · Canada, Jamaica, Dominican Republic
- Languages at home
- 83% English-only · Spanish 14% Other Indo-European 1% German/W. Germanic 1%
Political lean MEDSL · Marion
- 2024 margin
- Solid R (+31.6) · D 33.8% · R 65.5%
- 2008→2024 swing
- -20.0pp toward R · 2008: -11.6pp · 2024: -31.6pp
- All cycles
- 2024: R+31.6 2020: R+25.9 2016: R+26.2 2012: R+16.2 2008: R+11.6
Not yet ingested
- Civics
- —
Market trends
- HPI YoY
- ▼ -105.22%
- Current HPI
- 189.0869
- Rent YoY
- ▼ -2.57%
- Metro
- Ocala, FL
- State GDP YoY
- ▲ 3.28%
- F500 in state
- 36
Industry mix (Fortune 500 HQ in FL)
| Industry | F500 HQs | Revenue |
|---|---|---|
| Industrial Technology | 2 | $29B |
|
||
| Insurance | 2 | $17B |
|
||
| Retail | 1 | $60B |
|
||
| Technology Distribution | 1 | $58B |
|
||
| Homebuilding | 1 | $35B |
|
||
| Technology Manufacturing | 1 | $35B |
|
||
Price history
+119.4% since first listed20 events — show timeline
- 2026-04-14 Pending — Stellar MLS as Distributed by MLS Grid
- 2026-03-30 Relisted — Stellar MLS as Distributed by MLS Grid
- 2026-03-29 Pending — Stellar MLS as Distributed by MLS Grid
- 2026-03-17 Price Changed $109,500 Stellar MLS as Distributed by MLS Grid
- 2026-03-11 Relisted — Stellar MLS as Distributed by MLS Grid
- 2026-02-25 Pending — Stellar MLS as Distributed by MLS Grid
- 2026-02-20 Relisted — Stellar MLS as Distributed by MLS Grid
- 2026-02-18 Pending — Stellar MLS as Distributed by MLS Grid
- 2026-02-13 Price Changed $119,500 Stellar MLS as Distributed by MLS Grid
- 2026-01-09 Listed $129,500 Stellar MLS as Distributed by MLS Grid
- 2025-06-16 Listing Removed — realMLS
- 2025-06-04 Listed $100,000 realMLS
- 2018-01-12 Sold (Public Records) $84,900 Public Records
- 2018-01-11 Sold (MLS) $84,900 Stellar MLS as Distributed by MLS Grid
- 2017-12-05 Listed $84,900 Stellar MLS as Distributed by MLS Grid
- 2017-06-28 Sold (Public Records) $67,000 Public Records
- 2017-06-22 Sold (MLS) $67,000 Stellar MLS as Distributed by MLS Grid
- 2017-05-04 Listed $69,999 Stellar MLS as Distributed by MLS Grid
- 2005-03-09 Sold (Public Records) $45,000 Public Records
- 1991-10-01 Sold (Public Records) $49,900 Public Records
Property tax history
+15.8%/yrLatest (2025): $2,564 · -1.9% YoY. Source: county tax records.
Cash-flow waterfall
monthlySold comps — $/sqft
last 12 mo · ≤1 miLoading sold comps…