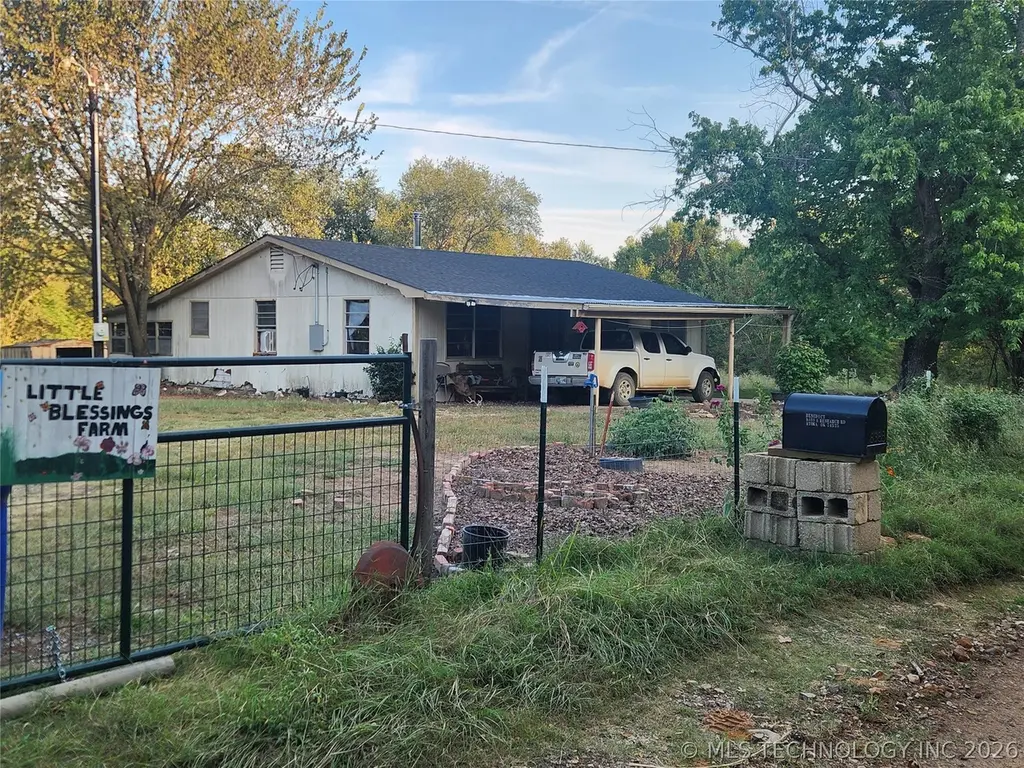
8388 Research Rd · Lane, OK
Flood risk 1/10 · Minimal
- FEMA flood zone
- X
- Chance of flooding over 30 yrs
- 0.0%
- Est. flood insurance / yr
- $507 – $1,088
Fire risk 5/10 · Moderate
- Est. fire insurance / yr
- $2,463 – $4,575
Heat risk 6/10 · Moderate
- Hot days now (above 112°F)
- 7 days/yr
- Hot days in 30 yrs
- 19 days/yr
Wind risk 4/10 · Minor
- Chance of severe wind over 30 yrs
- 13.0%
Air-quality risk 2/10 · Minimal
- Unhealthy air days now
- 0 days/yr
- Unhealthy air days in 30 yrs
- 1 days/yr
Risk factors via First Street. Map © Google.
Why this score? — see what drove the D grade
The composite is a weighted blend of 9 inputs, each scored 0–100. Each bar is that input's sub-score; the figure is the points it added to the 100-point composite (weight × sub-score).
- Cash flow +12.3/30.0
- ARV discount +7.5/15.0
- Appreciation +6.2/10.0
- DSCR +3.6/10.0
- Schools +3.2/10.0
- Livability +2.7/5.0
- Rent growth +2.5/5.0
- Condition / age +2.5/5.0
- 1% rule +2.2/10.0
$144,000
🖨 Deal sheet (PDF) 📄 Offer letter ✓ Due diligence
Key facts
- 5 acre lot
- Garage
- Built 1970
Property features AI
Exterior
- Parking: Attached garage; Carport; 1 garage space
- Security: No safety shelter
- Utilities: Electricity available; Water available; Well water; Septic tank
- Home design: Single-story; Faces north; Crawlspace foundation
- Construction: Built (year per public records); Wood siding and wood frame construction; Asphalt/fiberglass roof
- Exterior features: Shed(s); Partial wire/barbed wire fencing; Farm and ranch setting; Fruit trees; Mature trees; Rolling slope; Stream/creek and spring; Wooded areas; Horses allowed
Interior
- Kitchen: Oven; Range; Stove
- Flooring: Vinyl; Wood
- Bathrooms: 2 full bathrooms
- Heating & cooling: Wood heating
- Interior features: Laminate counters; Aluminum window frames; Electric oven connection; Electric range connection; Other interior features
- Laundry & utility: Washer hookup; Electric dryer hookup; Electric water heater
Neighborhood map
What this means for you Summary
Snapshot
- This is a 3-bed/2.0-bath single-family listed at $144k.
Deal economics
- At list price, monthly cash flow is $-27 ($-327/yr) — negative.
- To cash-flow at today's rent, offer at most $139k (3.3% below list).
- To meet the 1% rule (rent ≥ 1% of price), the offer needs to be $104k (27.8% below list).
- Recommended offer: $104k (27.8% below list) — sets the bar for 1% rule.
Location & tenants
- Location reads 53/100 on livability (#609 in OK) — a working-class tenant base; expect higher turnover. Strengths: cost of living A+, housing A+; Watch: employment D, crime F, amenities F.
- Lane (rural): math 40% / reading 30% proficiency, ranked #181 of 513 in OK (top 35%) — families likely to look elsewhere, expect single-tenant / working-renter base with shorter leases; 69% free/reduced lunch — lower-income household profile, screen leases tightly.
- Zoned schools: Lane Public School (math 32% / reading 32%, grade F, #213 of 845 statewide, top 28%, 262 students, 0% FRL) — zoned schools average 0% FRL vs 69% district-wide (69 pts lower); this property's tenant base skews higher-income than the district average.
- Market conditions: 58 active listings in the ZIP.
Forward outlook
- In year one you build about $4k of equity ($996 loan paydown + $3k appreciation (2.4% local appreciation)).
- Atoka County population projected at -18% by 2050 — secular population decline; favor cash flow + early exit over multi-decade hold.
- At projected returns (2.4% appreciation + 3.0% rent growth), your $40k cash investment doubles in ~8 years — after that, you're playing with house money.
- By year 8, paydown + projected appreciation supports a ~$33k cash-out refi (75% LTV) — recoverable capital for the next deal without selling this one.
Negotiation context
- It's been on market 59 days — a 3% lower offer ($140k) is reasonable based on typical stale-listing flexibility.
- 5 sale attempts since 5y ago with the ask held roughly flat each time — persistent listings suggest the price (not the market) is what's stuck; bring a comps-based counter.
- Current owner paid $120k; 20% above their basis — modest negotiation headroom, anchor on the comps not their cost.
Risks & watch-outs
- Climate carrying-cost: moderate wildfire risk; extreme-heat days projected 7→19/yr by 2055 (HVAC capex compounding) — expect insurance premiums to compound above CPI over the hold.
Questions for the listing agent
- What do current leases actually rent for vs. the listed asking? Can we see a recent rent roll and the last 12 months of T-12 income?
- It's been on market 59 days. Have you received any prior offers? Is the seller open to a 28% concession, seller financing, or rate buy-down credit?
- Built in 1970 — when were the roof, HVAC, electrical panel, plumbing, and water heater last replaced?
- Is there a deadline driving the sale (1031 exchange, divorce, estate, relocation)? That informs how much negotiation room exists.
- Schools are F-rated, which usually means shorter tenancies and higher turnover. Who's the typical renter profile here, and what's been the actual vacancy rate?
- Crime grade is F in this area — have there been break-ins, vandalism, or insurance claims at this property in the last 3 years? What carrier currently insures it and at what premium?
- The area grade is low — what's the realistic commute time and amenity access for the typical tenant pool here? Any planned neighborhood developments (good or bad) we should know about?
- What's the average days-on-market for RENTAL listings here right now (not sales)? A rising rental-DOM trend means longer vacancies and softer asking-rent achievability than the comps imply.
- What's the recent tenant-quality profile in this submarket — average credit score on applications, eviction rate, late-payment / NSF rate, and stable-employment percentage? A property-management company in the area should have these aggregated.
- How much new for-sale + rental construction is in the pipeline within 1–3 miles? Heavy new supply typically softens prices + rents 12–24 months out; constrained supply supports both.
Investment metrics
- 1% rule
- 0.72% ✗
- Cap rate
- 6.07%
- Cash-on-cash
- -0.81%
- DSCR
- 0.96
- GRM
- 11.5
CMA / ARV
No comps found within radius.
Projected returns pro-forma
2.43% appreciation · 3.0% rent growth · sell at horizon
- IRR
- 5.0%
- Equity multiple
- 1.28×
- Total profit
- $11,220
- Equity at exit
- $60,157
- IRR
- 8.3%
- Equity multiple
- 2.19×
- Total profit
- $47,791
- Equity at exit
- $89,285
Cash invested: $40,320 (down + closing). Projections, not guarantees.
Landlord ↔ Tenant lean methodology
- Overall (STATE)
- 83 Strongly Landlord-Friendly
- State Oklahoma
- 83 Strongly Landlord-Friendly · R+20
- County
- — inherits STATE
- City
- — inherits STATE
ZIP-level market 74525
- Home prices YoY
- 1.1%
- Active inventory
- 58
- Price-to-rent
- 11.5×
Monthly cashflow live
- Estimated rent
- $1,040 medium interval (Pro) →
- Mortgage (P&I)
- −$755
- Tax from tax record
- −$34 /mo · $406/yr
- Insurance
- −$60
- HOA
- −$0
- Vacancy / Maint / Mgmt
- −$218
- Net cashflow
- $-27
Break-even live
Sensitivity live
| Price | -10% $54 | -5% $13 | +0% $-27 | +5% $-68 | +10% $-109 |
|---|---|---|---|---|---|
| Rent | -10% $-109 | -5% $-68 | +0% $-27 | +5% $14 | +10% $55 |
| Rate | -1.0pp $45 | -0.5pp $9 | base $-27 | +0.5pp $-65 | +1.0pp $-103 |
UW: 25.0% down · 7.5% · 30yr · 1.5% tax · 5.0% vac · 8.0% maint · 8.0% mgmt
Financing live
Cash to close
- Down payment
- $36,000
- Closing costs
- $4,320
- Reserves months
- —
- Total cash needed
- —
Loan-product check · same deal, 3 products live
Conventional
25% down · 7.5% · 30yr
- Down + closing
- —
- Monthly P&I
- —
- Monthly cashflow
- —
- DSCR
- —
- Eligible?
- —
Personal DTI + credit; lowest rate.
DSCR
20% down · 8.5% · 30yr
- Down + closing
- —
- Monthly P&I
- —
- Monthly cashflow
- —
- DSCR
- —
- Eligible?
- —
No personal income docs; deal must DSCR.
Hard money
10% down · 12.0% · 12mo
- Down + closing
- —
- Monthly P&I
- —
- Monthly cashflow
- —
- DSCR
- —
- Eligible?
- —
Short-term bridge; refi at stabilization.
Listing history 26 events
-
2026-06-21days on market $144,000 Active 59 DOM
-
2026-06-21days on market $144,000 Active 58 DOM
-
2026-06-18days on market $144,000 Active 56 DOM
-
2026-06-17days on market $144,000 Active 55 DOM
-
2026-06-16days on market $144,000 Active 54 DOM
-
2026-06-15days on market $144,000 Active 53 DOM
-
2026-06-13days on market $144,000 Active 51 DOM
-
2026-06-12days on market $144,000 Active 50 DOM
-
2026-06-09days on market $144,000 Active 47 DOM
-
2026-06-08days on market $144,000 Active 46 DOM
-
2026-06-08days on market $144,000 Active 45 DOM
-
2026-06-05days on market $144,000 Active 43 DOM
-
2026-06-04days on market $144,000 Active 41 DOM
-
2026-06-02days on market $144,000 Active 40 DOM
-
2026-06-01days on market $144,000 Active 39 DOM
-
2026-05-31days on market $144,000 Active 38 DOM
-
2026-04-20$65,000 Active
-
2026-04-20$144,000 Active
-
2026-03-31historical
-
2025-09-26$194,200 Active
-
2022-06-10soldstatus $120,000 Sold
-
2022-06-06status Pending
-
2022-04-07$128,000 Active
-
2021-08-20soldstatus $66,000 Closed
-
2021-05-25status Pending
-
2021-05-18$60,000 Active
ⓘ Source: listings_history table (triggers on properties + properties_extension) + one-shot
backfill from property_details.listing_events for pre-trigger history.
Tax reassessment forecast OK · Resets to sale price
- Current annual tax
- $406 · $34/mo
- Projected year-2 tax
- $1,296 · $108/mo
- Expected delta
- +$890/yr (+$74/mo · 219.2%)
ⓘ Screening estimate from a state-policy table — verify with the county assessor before closing.
Climate risk First Street
- Flood 1/10 Low FEMA zone X · 0% chance over 30 yrs
- Wildfire 5/10 Major
- Heat 6/10 Major 7 d/yr ≥112°F today · 19 d/yr by 30 yrs out
- Wind 4/10 Moderate 13% chance of damaging wind over 30 yrs
- Air quality 2/10 Low 0 unhealthy d/yr today · 1 by 30 yrs out
Nearby sold comps map
Loading sold comps map…
Walkable amenities ~0.75 mi
Loading nearby amenities…
Taxation est. · year 1
- Rental income
- $12,482
- − Mortgage interest
- −$8,066
- − Property taxes
- −$406
- − Insurance
- −$720
- − Repairs & maintenance
- −$999
- − Management
- −$999
- − Depreciation
- −$4,189
- Taxable loss
- −$2,897
- Est. tax savings @ 24.0%
- +$695
- After-tax cash flow
- $368/yr
For passive investors: Depreciation is non-cash, so a rental often shows a tax loss while cash-flowing — sheltering income. Rental losses are passive: they offset passive income freely, and up to $25,000/yr can offset ordinary (W-2) income if you actively participate and your MAGI is under $100k (phasing out to $0 by $150k); unused losses carry forward. On sale, claimed depreciation is recaptured at up to 25%, and gains may owe capital-gains tax (a 1031 exchange can defer both). Figures are a year-1 estimate at your 24.0% rate — not tax advice; consult a CPA.
Schools (NCES district)
- District
- Lane
- NCES district ID
- 4017040
- Math proficiency
- 40% ▬ 0.00%
- Reading proficiency
- 30% ▬ 0.00%
- Median HH income
- $36,302
- Composite
- 31.69/100
- National rank
- #11116
- State rank
- #181 of 513 in OK
Livability — Lane
- Score
- 53/100
- State rank
- #609
- US rank
- #24316
Category grades
Schools grade is shown separately in the Schools card above.
Census & demographics
- Population (ZIP)
- 10,420
Population outlook (Atoka County) Hauer SSP2
- Today (2025)
- 13,004 people
- By 2030
- 12,522 · -3.7%
- By 2040
- 11,595 · -10.8%
- By 2050
- 10,709 · -17.6%
- By 2075
- 8,957 · -31.1%
- By 2100
- 7,452 · -42.7%
Race, ethnicity, and origin ACS 2023
- Neighborhood character
- Diverse neighborhood (Simpson 0.56)
- Race & ethnicity
- White 66% Two or more races 18% Native American 9% Hispanic / Latino 5% Black 4%
- Hispanic origin (detail)
- Mexican 4%
- Common ancestry
- Lithuanian 1% European 1% Slovak 1%
- Foreign-born
- 2% · Philippines, Canada
- Languages at home
- 95% English-only · Spanish 3% Other Asian/Pacific 1%
Political lean MEDSL · Atoka
- 2024 margin
- Solid R (+71.6) · D 13.8% · R 85.3%
- 2008→2024 swing
- -27.7pp toward R · 2008: -43.9pp · 2024: -71.6pp
- All cycles
- 2024: R+71.6 2020: R+70.4 2016: R+65.4 2012: R+48.0 2008: R+43.9
Not yet ingested
- Civics
- —
Market trends
- HPI YoY
- ▲ 2.43%
- Current HPI
- 213.5144
- Rent YoY
- —
- Metro
- —
- State GDP YoY
- ▲ 1.55%
- F500 in state
- 6
Industry mix (Fortune 500 HQ in OK)
| Industry | F500 HQs | Revenue |
|---|---|---|
| Energy | 3 | $48B |
|
||
Price history
+140.0% since first listed10 events — show timeline
- 2026-04-20 Listed $144,000 MLS Technology, Inc.
- 2026-04-20 Listed $65,000 MLS Technology, Inc.
- 2026-03-31 Listing Removed — MLS Technology, Inc.
- 2025-09-26 Listed $194,200 MLS Technology, Inc.
- 2022-06-10 Sold (MLS) $120,000 MLSOK
- 2022-06-06 Pending — MLSOK
- 2022-04-07 Listed $128,000 MLSOK
- 2021-08-20 Sold (MLS) $66,000 MLS Technology, Inc.
- 2021-05-25 Pending — MLS Technology, Inc.
- 2021-05-18 Listed $60,000 MLS Technology, Inc.
Property tax history
+6.6%/yrLatest (2025): $406 · +2.5% YoY. Source: county tax records.
Cash-flow waterfall
monthlySold comps — $/sqft
last 12 mo · ≤1 miLoading sold comps…