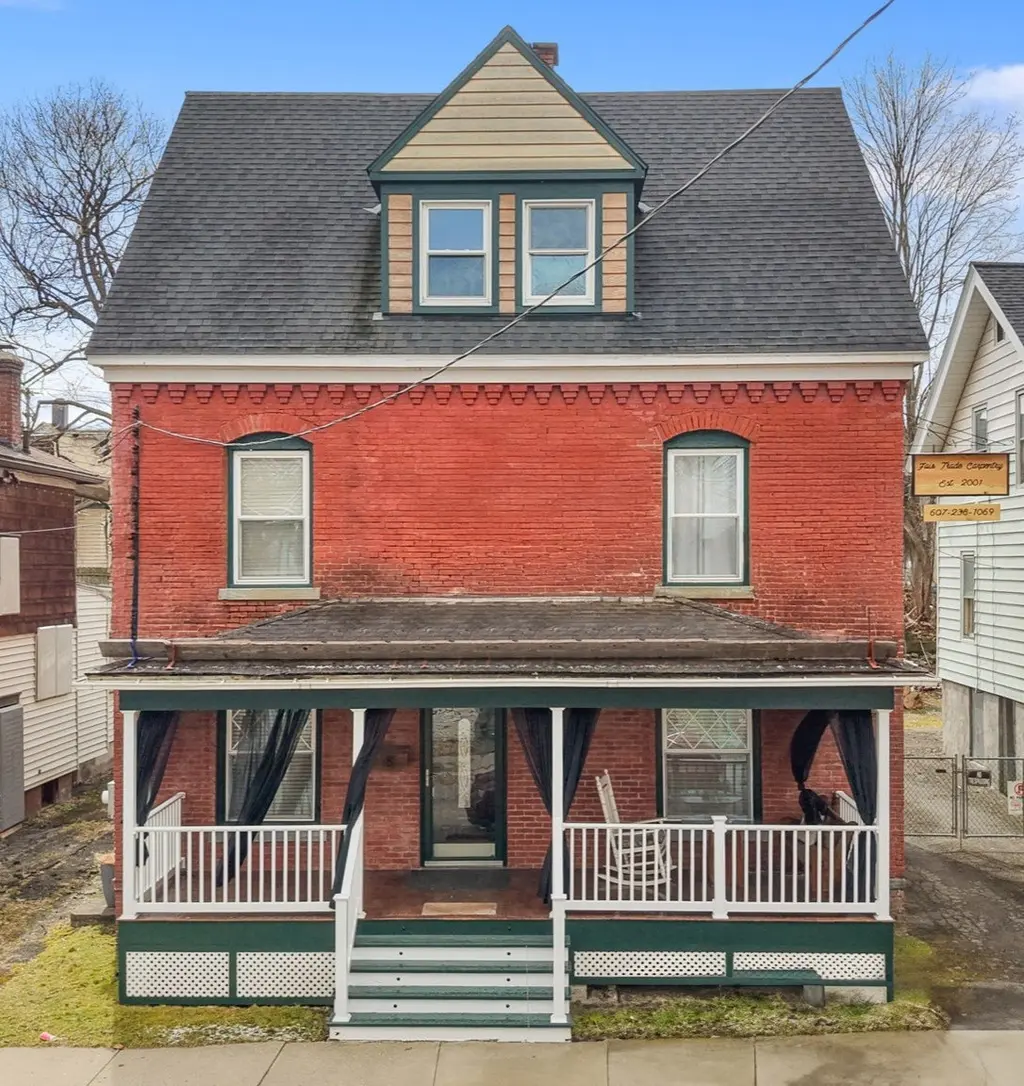
8 Amsbry St · Binghamton, NY
Flood risk 6/10 · Moderate
- FEMA flood zone
- X
- Chance of flooding over 30 yrs
- 0.27%
- Est. flood insurance / yr
- $473 – $860
Fire risk 1/10 · Minimal
- Est. fire insurance / yr
- $691 – $1,283
Heat risk 3/10 · Minor
- Hot days now (above 94°F)
- 7 days/yr
- Hot days in 30 yrs
- 16 days/yr
Wind risk 2/10 · Minimal
- Chance of severe wind over 30 yrs
- 1.0%
Air-quality risk 2/10 · Minimal
- Unhealthy air days now
- 0 days/yr
- Unhealthy air days in 30 yrs
- 1 days/yr
Risk factors via First Street. Map © Google.
Why this score? — see what drove the F grade
The composite is a weighted blend of 9 inputs, each scored 0–100. Each bar is that input's sub-score; the figure is the points it added to the 100-point composite (weight × sub-score).
- ARV discount +15.0/15.0
- Cash flow +6.0/30.0
- Livability +3.9/5.0
- Schools +3.0/10.0
- Rent growth +2.5/5.0
- Condition / age +2.5/5.0
- 1% rule +1.7/10.0
- DSCR +0.4/10.0
- Appreciation +0.0/10.0
$249,900
🖨 Deal sheet (PDF) 📄 Offer letter ✓ Due diligence
Listing remarks MLS
Get ready for this beautifully updated home which blends classic charm with a fresh, modern feel. From the moment you step onto the tastefully updated front porch, you’ll see! Inside, you'll find an open floor plan, featuring gorgeous Brazilian tiger wood floors and handcrafted updates throughout. The style has a NYC feel with many modern touches. The bedrooms offer tall ceilings, making everything feel even more open and airy. The partially finished basement is a fun bonus space, complete with a custom kids’ playhouse and movie theater. The third floor is already laid out in a way that could easily work as a separate apartment, or guest space. 3rd Floor has its own utilities and plumbing. Out back, you’ll find a yard that’s ready to enjoy, with a kids’ playground, a hydro garden, a nice lounging deck, and a spacious workshop. This place wasn't just given a face lift, much of it was gutted and redone!
Key facts
- Open floor plan
- Movie theater
- Updated front porch
Tags
Neighborhood map
What this means for you Summary
Snapshot
- This is a 4-bed/1.5-bath single-family listed at $250k.
Deal economics
- At list price, monthly cash flow is $-474 ($-6k/yr) — negative.
- To cash-flow at today's rent, offer at most $166k (33.5% below list).
- To meet the 1% rule (rent ≥ 1% of price), the offer needs to be $166k (33.5% below list).
- Recommended offer: $166k (33.5% below list) — sets the bar for cash-flow.
- Cap rate 4.0% vs local median 6.4% in Binghamton — below-typical yield; the buyer is paying a premium for something (appreciation thesis, condition, location) that the cap rate doesn't capture.
Location & tenants
- Location reads 78/100 on livability (#174 in NY, #2,710 nationally) — a middle-class / working-renter tenant base. Strengths: amenities A+, commute A+, cost of living A+; Watch: crime F, employment F.
- Binghamton City School District (urban): math 30% / reading 44% proficiency, ranked #557 of 590 in NY (top 94%) — families likely to look elsewhere, expect single-tenant / working-renter base with shorter leases; 61% free/reduced lunch — lower-income household profile, screen leases tightly.
- Zoned schools: Binghamton High School (math 71% / reading 79%, grade A-, #631 of 1,100 statewide, top 58%, 1,341 students, 69% FRL).
- Zoned-school proficiency averages 75% at this address vs 37% district-wide (+38 pts) — the actual schools serving this property are materially stronger than the Binghamton City School District average implies; a family-tenant draw the district grade alone would hide.
- Market conditions: 92 active listings in the ZIP; 4 comparable units currently listed for rent nearby; rentals at typical pace (median 23d on market — plan ~3-4 weeks tenant-placement turnaround); 340 units permitted in Broome County in 2024 (269 in 5+ unit buildings).
Forward outlook
- Local home prices are declining (-3.0%/yr); year-one equity from $2k of loan paydown is wiped out by about $7k of value loss. Plan a longer hold.
- Broome County population projected at -13% by 2050 — secular population decline; favor cash flow + early exit over multi-decade hold.
Negotiation context
- It's been on market 93 days — a 9% lower offer ($227k) is reasonable based on typical stale-listing flexibility.
- 3 sale attempts since 20y ago with the ask held roughly flat each time — persistent listings suggest the price (not the market) is what's stuck; bring a comps-based counter.
- Current owner paid $65k; list at $250k implies a 284% gain — meaningful room to come down on a strong offer.
Risks & watch-outs
- Watch-outs: built in 1910 — expect roof / HVAC / electrical / plumbing capex.
- Climate carrying-cost: major flood risk — expect insurance premiums to compound above CPI over the hold.
Questions for the listing agent
- What do current leases actually rent for vs. the listed asking? Can we see a recent rent roll and the last 12 months of T-12 income?
- It's been on market 93 days. Have you received any prior offers? Is the seller open to a 34% concession, seller financing, or rate buy-down credit?
- Built in 1910 — when were the roof, HVAC, electrical panel, plumbing, and water heater last replaced?
- Why hasn't it sold? Are there any deal-killer items the seller is aware of (foundation, flood, title, zoning, code violations)?
- Is there a deadline driving the sale (1031 exchange, divorce, estate, relocation)? That informs how much negotiation room exists.
- Schools are D-rated, which usually means shorter tenancies and higher turnover. Who's the typical renter profile here, and what's been the actual vacancy rate?
- Crime grade is F in this area — have there been break-ins, vandalism, or insurance claims at this property in the last 3 years? What carrier currently insures it and at what premium?
- The area grade is low — what's the realistic commute time and amenity access for the typical tenant pool here? Any planned neighborhood developments (good or bad) we should know about?
- What's the average days-on-market for RENTAL listings here right now (not sales)? A rising rental-DOM trend means longer vacancies and softer asking-rent achievability than the comps imply.
- What's the recent tenant-quality profile in this submarket — average credit score on applications, eviction rate, late-payment / NSF rate, and stable-employment percentage? A property-management company in the area should have these aggregated.
- How much new for-sale + rental construction is in the pipeline within 1–3 miles? Heavy new supply typically softens prices + rents 12–24 months out; constrained supply supports both.
Investment metrics
- 1% rule
- 0.67% ✗
- Cap rate
- 4.02%
- Cash-on-cash
- -8.13%
- DSCR
- 0.64
- GRM
- 12.5
CMA / ARV
- ARV (median comp)
- $301,471
- List price
- $249,900
- Delta
- -17.11%
- Verdict
- UNDERPRICED
- Comps
- 4 within 1.0 mi
Show comp detail 9 sales within ~0.75 mi
| Address | Dist | Beds/Ba | Sqft | Sold | Price | $/sf | Match |
|---|---|---|---|---|---|---|---|
| 32 Dennison Ave | 0.14mi | 3/2.0 (-1) | 1,656 (-1%) | 1mo | $182,500 | $110 | 83 |
| 31 Dennison Ave | 0.12mi | 4/1.5 | 1,856 (+10%) | 11mo | $132,000 | $71 | 67 |
| 5 Allen St | 0.66mi | 4/1.5 | 1,704 (+1%) | 4mo | $160,000 | $94 | 63 |
| 6 Lockwood St | 0.41mi | 4/1.5 | 1,782 (+6%) | 13mo | $132,000 | $74 | 60 |
| 20 Lockwood St | 0.38mi | 3/1.0 (-1) | 1,781 (+6%) | 11mo | $149,900 | $84 | 56 |
| 24 Cary St | 0.36mi | 4/2.0 | 1,594 (-5%) | 23mo | $59,000 | $37 | 54 |
| 30 Rosedale Dr | 0.73mi | 3/1.5 (-1) | 1,825 (+9%) | 8mo | $246,000 | $135 | 40 |
| 717 Chenango St | 0.74mi | 4/1.5 | 1,800 (+7%) | 18mo | $225,000 | $125 | 38 |
| 18 Pleasant Ct | 0.66mi | 3/1.0 (-1) | 1,626 (-3%) | 24mo | $154,900 | $95 | 37 |
Match score weights: distance 35% · size 25% · config 20% · recency 20%. Top-matched comps best support the ARV.
Projected returns pro-forma
-3.0% appreciation · 3.0% rent growth · sell at horizon
- IRR
- -30.6%
- Equity multiple
- -0.01×
- Total profit
- $-70,618
- Equity at exit
- $37,261
- IRR
- -32.6%
- Equity multiple
- -0.43×
- Total profit
- $-100,109
- Equity at exit
- $21,607
Cash invested: $69,972 (down + closing). Projections, not guarantees.
Landlord ↔ Tenant lean methodology
- Overall (STATE)
- 15 Strongly Tenant-Friendly
- State New York
- 15 Strongly Tenant-Friendly · D+10
- County
- — inherits STATE
- City
- — inherits STATE
ZIP-level market 13901
- Home prices YoY
- -5.1%
- Active inventory
- 92
- Price-to-rent
- 12.5×
Monthly cashflow live
- Estimated rent
- $1,663 medium interval (Pro) →
- Mortgage (P&I)
- −$1,311
- Tax from tax record
- −$373 /mo · $4,474/yr
- Insurance
- −$104
- HOA
- −$0
- Vacancy / Maint / Mgmt
- −$349
- Net cashflow
- $-474
Break-even live
Sensitivity live
| Price | -10% $-332 | -5% $-403 | +0% $-474 | +5% $-545 | +10% $-615 |
|---|---|---|---|---|---|
| Rent | -10% $-605 | -5% $-540 | +0% $-474 | +5% $-408 | +10% $-343 |
| Rate | -1.0pp $-348 | -0.5pp $-410 | base $-474 | +0.5pp $-539 | +1.0pp $-605 |
UW: 25.0% down · 7.5% · 30yr · 1.5% tax · 5.0% vac · 8.0% maint · 8.0% mgmt
Financing live
Cash to close
- Down payment
- $62,475
- Closing costs
- $7,497
- Reserves months
- —
- Total cash needed
- —
Loan-product check · same deal, 3 products live
Conventional
25% down · 7.5% · 30yr
- Down + closing
- —
- Monthly P&I
- —
- Monthly cashflow
- —
- DSCR
- —
- Eligible?
- —
Personal DTI + credit; lowest rate.
DSCR
20% down · 8.5% · 30yr
- Down + closing
- —
- Monthly P&I
- —
- Monthly cashflow
- —
- DSCR
- —
- Eligible?
- —
No personal income docs; deal must DSCR.
Hard money
10% down · 12.0% · 12mo
- Down + closing
- —
- Monthly P&I
- —
- Monthly cashflow
- —
- DSCR
- —
- Eligible?
- —
Short-term bridge; refi at stabilization.
Rent comps 4 comps
| Address | Beds | Baths | Sqft | Rent | $/sqft | DOM | Units | Dist |
|---|---|---|---|---|---|---|---|---|
| 8 Roosevelt Ave Binghamton, NY | 3.0 | 1.0 | 1400 | $1,450 | $1.04 | 22d | 1 | 0.08mi |
| 8 Roosevelt Ave Unit 2 Binghamton, NY | 3.0 | 1.0 | 1400 | $1,500 | $1.07 | 45d | 1 | 0.08mi |
| 528 Chenango St Unit 1 Binghamton, NY | 3.0 | 1.0 | 1250 | $1,500 | $1.20 | 15d | 1 | 0.28mi |
| 40 Fuller St Unit 40A Binghamton, NY | 3.0 | 2.0 | 1600 | $2,700 | $1.69 | 22d | 1 | 0.90mi |
Listing history 21 events
-
2026-06-21days on market $249,900 Active 93 DOM
-
2026-06-19days on market $249,900 Active 91 DOM
-
2026-06-18days on market $249,900 Active 90 DOM
-
2026-06-17days on market $249,900 Active 89 DOM
-
2026-06-16days on market $249,900 Active 88 DOM
-
2026-06-15days on market $249,900 Active 87 DOM
-
2026-06-14days on market $249,900 Active 85 DOM
-
2026-06-13days on market $249,900 Active 84 DOM
-
2026-06-10days on market $249,900 Active 82 DOM
-
2026-06-09days on market $249,900 Active 81 DOM
-
2026-06-08days on market $249,900 Active 80 DOM
-
2026-06-07days on market $249,900 Active 79 DOM
-
2026-06-03days on market $249,900 Active 75 DOM
-
2026-06-02days on market $249,900 Active 74 DOM
-
2026-06-01days on market $249,900 Active 73 DOM
-
2026-05-31days on market $249,900 Active 72 DOM
-
2026-05-30days on market $249,900 Active 71 DOM
-
2026-03-20$249,900 Active 948-char remark
Show marketing remark (948 chars)
Get ready for this beautifully updated home which blends classic charm with a fresh, modern feel. From the moment you step onto the tastefully updated front porch, you’ll see! Inside, you'll find an open floor plan, featuring gorgeous Brazilian tiger wood floors and handcrafted updates throughout. The style has a NYC feel with many modern touches. The bedrooms offer tall ceilings, making everything feel even more open and airy. The partially finished basement is a fun bonus space, complete with a custom kids’ playhouse and movie theater. The third floor is already laid out in a way that could easily work as a separate apartment, or guest space. 3rd Floor has its own utilities and plumbing. Out back, you’ll find a yard that’s ready to enjoy, with a kids’ playground, a hydro garden, a nice lounging deck, and a spacious workshop. This place wasn't just given a face lift, much of it was gutted and redone!
-
2024-09-05$239,900 Active
-
2007-07-16soldstatus $65,000
-
2006-07-22$85,000
ⓘ Source: listings_history table (triggers on properties + properties_extension) + one-shot
backfill from property_details.listing_events for pre-trigger history.
Tax reassessment forecast NY · Partial reset (capped growth)
- Current annual tax
- $4,474 · $373/mo
- Projected year-2 tax
- $4,474 · $373/mo
- Expected delta
- $0/yr ($0/mo · 0.0%)
ⓘ Screening estimate from a state-policy table — verify with the county assessor before closing.
Climate risk First Street
- Flood 6/10 Major FEMA zone X · 27% chance over 30 yrs
- Wildfire 1/10 Low
- Heat 3/10 Moderate 7 d/yr ≥94°F today · 16 d/yr by 30 yrs out
- Wind 2/10 Low 100% chance of damaging wind over 30 yrs
- Air quality 2/10 Low 0 unhealthy d/yr today · 1 by 30 yrs out
Nearby sold comps map
Loading sold comps map…
Walkable amenities ~0.75 mi
Loading nearby amenities…
Taxation est. · year 1
- Rental income
- $19,952
- − Mortgage interest
- −$13,998
- − Property taxes
- −$4,474
- − Insurance
- −$1,250
- − Repairs & maintenance
- −$1,596
- − Management
- −$1,596
- − Depreciation
- −$7,270
- Taxable loss
- −$10,232
- Est. tax savings @ 24.0%
- +$2,456
- After-tax cash flow
- $-3,232/yr
For passive investors: Depreciation is non-cash, so a rental often shows a tax loss while cash-flowing — sheltering income. Rental losses are passive: they offset passive income freely, and up to $25,000/yr can offset ordinary (W-2) income if you actively participate and your MAGI is under $100k (phasing out to $0 by $150k); unused losses carry forward. On sale, claimed depreciation is recaptured at up to 25%, and gains may owe capital-gains tax (a 1031 exchange can defer both). Figures are a year-1 estimate at your 24.0% rate — not tax advice; consult a CPA.
Schools (NCES district)
- District
- Binghamton City School District
- NCES district ID
- 3604870
- Math proficiency
- 30% ▬ 0.00%
- Reading proficiency
- 44% ▲ 15.00%
- Median HH income
- $30,475
- Composite
- 30.09/100
- National rank
- #6342
- State rank
- #557 of 590 in NY
Livability — Binghamton
- Score
- 78/100
- State rank
- #174
- US rank
- #2710
Category grades
Schools grade is shown separately in the Schools card above.
Census & demographics
- Census place
- Binghamton, NY
- County
- Broome County · 126,805 people
- City population
- 65,170
- Metro
- Binghamton, NY
- Population (ZIP)
- 19,613
- Household income
- $55,523
- Rent vs Own
- Severe rent burden
- 1230.0
Population outlook (Broome County) Hauer SSP2
- Today (2025)
- 187,989 people
- By 2030
- 183,066 · -2.6%
- By 2040
- 172,228 · -8.4%
- By 2050
- 163,161 · -13.2%
- By 2075
- 153,641 · -18.3%
- By 2100
- 140,851 · -25.1%
Race, ethnicity, and origin ACS 2023
- Neighborhood character
- Predominantly White (80%)
- Race & ethnicity
- White 80% Two or more races 7% Hispanic / Latino 7% Black 5% Asian 2%
- Hispanic origin (detail)
- Puerto Rican 3%
- Common ancestry
- Romanian 6% Lithuanian 1% Italian 1%
- Foreign-born
- 5% · Canada, Jamaica
- Languages at home
- 93% English-only · Spanish 3% Russian/Polish/Slavic 1% Other Indo-European 1%
Political lean MEDSL · Broome
- 2024 margin
- Toss-up / Even · D 50.2% · R 49.8%
- 2008→2024 swing
- -7.6pp toward R · 2008: 8.0pp · 2024: 0.4pp
- All cycles
- 2024: D+0.4 2020: D+3.5 2016: R+3.7 2012: D+4.6 2008: D+8.0
Not yet ingested
- Civics
- —
Market trends
- HPI YoY
- ▼ -16.13%
- Current HPI
- 300.7692
- Rent YoY
- —
- Metro
- Binghamton, NY
- State GDP YoY
- ▲ 2.60%
- F500 in state
- 92
Industry mix (Fortune 500 HQ in NY)
| Industry | F500 HQs | Revenue |
|---|---|---|
| Financial Services | 10 | $950B |
|
||
| Consumer Goods | 9 | $162B |
|
||
| Insurance | 4 | $225B |
|
||
| Telecommunications | 2 | $144B |
|
||
| Pharmaceuticals | 2 | $112B |
|
||
| Media / Entertainment | 2 | $69B |
|
||
Price history
+194.0% since first listed4 events — show timeline
- 2026-03-20 Listed $249,900 GBAOR
- 2024-09-05 Listed $239,900 GBAOR
- 2007-07-16 Sold (Public Records) $65,000 Public Records
- 2006-07-22 Listed $85,000 GBAOR
Property tax history
+7.2%/yrLatest (2025): $4,474 · +0.9% YoY. Source: county tax records.
Cash-flow waterfall
monthlySold comps — $/sqft
last 12 mo · ≤1 miLoading sold comps…