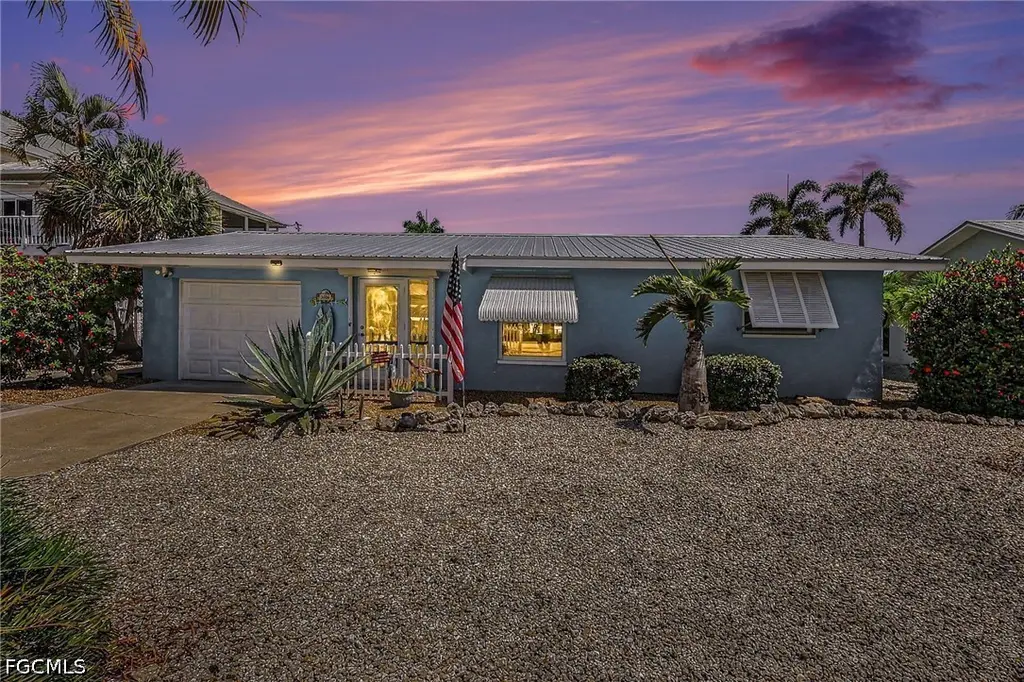
3608 Rita Ln · St. James City, FL
Flood risk 9/10 · Severe
- FEMA flood zone
- AE
- Chance of flooding over 30 yrs
- 0.99%
- Est. flood insurance / yr
- $1,737 – $8,500
Fire risk 1/10 · Minimal
- Est. fire insurance / yr
- $947 – $1,759
Heat risk 10/10 · Severe
- Hot days now (above 107°F)
- 7 days/yr
- Hot days in 30 yrs
- 28 days/yr
Wind risk 10/10 · Severe
- Chance of severe wind over 30 yrs
- 99.0%
Air-quality risk 2/10 · Minimal
- Unhealthy air days now
- 1 days/yr
- Unhealthy air days in 30 yrs
- 2 days/yr
Risk factors via First Street. Map © Google.
Why this score? — see what drove the D- grade
The composite is a weighted blend of 9 inputs, each scored 0–100. Each bar is that input's sub-score; the figure is the points it added to the 100-point composite (weight × sub-score).
- Cash flow +18.1/30.0
- DSCR +5.7/10.0
- 1% rule +4.1/10.0
- Schools +4.1/10.0
- Rent growth +2.5/5.0
- Livability +2.5/5.0
- Condition / age +2.5/5.0
- ARV discount +0.0/15.0
- Appreciation +0.0/10.0
$559,900
🖨 Deal sheet 📄 Offer letter ✓ Due diligence
Listing remarks MLS
REDUCED!! SWEET HOUSE. .. .. Remodeled Gulf Access home with a very quick boat ride to the amazing beaches of Sanibel, Captiva and the out islands. Custom kitchen, high end appliances including side by side 19cu foot refrigerator AND a 19cu foot freezer! There is an enclosed Florida room AND a new screened lanai. Perfect set-up for a pool! Professionally landscaped yards and a fenced area for your dog. There is a very large wrap-around dock with a 10,000lb boat lift. This home has been very nicely updated- just move right in!! Please make an appointment today to view this really nice comfortable home!
Key facts
- Direct gulf access
- One-car garage
- Large boat lift
Tags
Property features AI
Finance
- Financial info: Pets allowed
- HOA & community: Community offers boat facilities; No association fee
Exterior
- Parking: Attached garage (1 covered space); Driveway; Paved parking; RV access/parking; Two parking spaces total
- Security: Smoke detectors
- Utilities: Public water; Septic tank; Cable available; High-speed internet available
- Home design: Single-story home; Entry on level 1; Faces south; Resale property; Has view
- Construction: Built with block, concrete and stucco; Metal roof
- Exterior features: Courtyard; Open patio and porch; Patio; Porch; Room for pool; Storage; Outbuilding; Seawall; Canal access (navigable water); North exposure; Rectangular lot; Public maintained road
Interior
- Kitchen: Electric cooktop; Microwave; Dishwasher; Refrigerator with ice maker; Icemaker
- Bedrooms: Bedroom on main level; Great room
- Flooring: Terrazzo; Tile
- Bathrooms: 2 full bathrooms
- Heating & cooling: Central heating (electric); Central air; Ceiling fans
- Interior features: Breakfast bar; Family/dining room combination; Kitchen island; Living/dining room; Window treatments; Shutters; Single-hung windows; Furnished
- Laundry & utility: Washer; Dryer; Laundry tub; Laundry area in garage
Neighborhood map
What this means for you Summary
Snapshot
- This is a 2-bed/2.0-bath single-family listed at $560k.
Deal economics
- At list price, monthly cash flow is $63 ($757/yr) — positive.
- The deal already cash-flows at list — no discount required.
- To meet the 1% rule (rent ≥ 1% of price), the offer needs to be $509k (9.0% below list).
- Recommended offer: $509k (9.0% below list) — sets the bar for 1% rule.
- Cap rate 7.3% vs local median 4.9% in St. James City — top-decile yield for the area; either an underpriced asset or a hidden risk that comps aren't pricing in. Stress-test before assuming the spread holds.
Location & tenants
- Location reads: area grade D — affects rentability + tenant quality, not the cash-flow math above.
- Lee (suburban): math 47% / reading 50% proficiency, ranked #42 of 73 in FL (top 58%) — families likely to look elsewhere, expect single-tenant / working-renter base with shorter leases.
- Market conditions: 287 active listings in the ZIP; 5 comparable units currently listed for rent nearby; rentals at typical pace (median 24d on market — plan ~3-4 weeks tenant-placement turnaround); 15,411 units permitted in Lee County in 2024 (4,686 in 5+ unit buildings).
Forward outlook
- Local home prices are declining (-3.0%/yr); year-one equity from $4k of loan paydown is wiped out by about $17k of value loss. Plan a longer hold.
- Lee County population projected at +44% by 2050 — long-run rental-demand tailwind backs the buy-and-hold thesis.
Negotiation context
- Only 6 days on market — expect competitive offers; lowballing is unlikely to land.
- 3 sale attempts since 7y ago with the ask held roughly flat each time — persistent listings suggest the price (not the market) is what's stuck; bring a comps-based counter.
- Current owner paid $370k; list at $560k implies a 51% gain — meaningful room to come down on a strong offer.
Risks & watch-outs
- Watch-outs: flood insurance adds $427/mo.
- Climate carrying-cost: in FEMA flood zone AE (mandatory federal flood insurance); severe wind risk, 99% chance of damaging wind over 30y; extreme-heat days projected 7→28/yr by 2055 (HVAC capex compounding) — expect insurance premiums to compound above CPI over the hold.
Questions for the listing agent
- Built in 1974 — when were the roof, HVAC, electrical panel, plumbing, and water heater last replaced?
- What's the actual annual flood-insurance premium (NFIP or private), and is the property in a SFHA with mandatory coverage?
- Is there a deadline driving the sale (1031 exchange, divorce, estate, relocation)? That informs how much negotiation room exists.
- The area grade is low — what's the realistic commute time and amenity access for the typical tenant pool here? Any planned neighborhood developments (good or bad) we should know about?
- What's the average days-on-market for RENTAL listings here right now (not sales)? A rising rental-DOM trend means longer vacancies and softer asking-rent achievability than the comps imply.
- What's the recent tenant-quality profile in this submarket — average credit score on applications, eviction rate, late-payment / NSF rate, and stable-employment percentage? A property-management company in the area should have these aggregated.
- How much new for-sale + rental construction is in the pipeline within 1–3 miles? Heavy new supply typically softens prices + rents 12–24 months out; constrained supply supports both.
Investment metrics
- 1% rule
- 0.91% ✗
- Cap rate
- 7.34%
- Cash-on-cash
- 3.75%
- DSCR
- 1.17
- GRM
- 9.2
CMA / ARV
- ARV (on-the-fly)
- $470,436
- Comps found
- 7
Show comp detail 7 sales within ~0.75 mi
| Address | Dist | Beds/Ba | Sqft | Sold | Price | $/sf | Match |
|---|---|---|---|---|---|---|---|
| 3947 Coconut Dr | 0.58mi | 2/2.0 | 1,167 (-2%) | 5mo | $634,000 | $543 | 65 |
| 2472 York Rd | 0.35mi | 2/1.5 | 1,104 (-8%) | 12mo | $395,000 | $358 | 59 |
| 2411 Oleander St | 0.26mi | 2/1.0 | 1,117 (-6%) | 22mo | $475,000 | $425 | 55 |
| 3177 Vacation Ln | 0.40mi | 2/3.0 | 1,344 (+13%) | 13mo | $1,040,000 | $774 | 46 |
| 2288 Sycamore St | 0.57mi | 2/2.0 | 1,371 (+15%) | 4mo | $540,000 | $394 | 46 |
| 3289 8th Ave | 0.66mi | 2/2.0 | 1,049 (-12%) | 15mo | $305,000 | $291 | 36 |
| 2371 Baybreeze St | 0.50mi | 3/2.0 (+1) | 1,327 (+11%) | 23mo | $307,500 | $232 | 34 |
Match score weights: distance 35% · size 25% · config 20% · recency 20%. Top-matched comps best support the ARV.
Projected returns pro-forma
-3.0% appreciation · 3.0% rent growth · sell at horizon
- IRR
- -15.5%
- Equity multiple
- 0.45×
- Total profit
- $-86,577
- Equity at exit
- $83,483
- IRR
- -7.0%
- Equity multiple
- 0.56×
- Total profit
- $-69,676
- Equity at exit
- $48,410
Cash invested: $156,772 (down + closing). Projections, not guarantees.
Landlord ↔ Tenant lean methodology
- Overall (STATE)
- 87 Strongly Landlord-Friendly
- State Florida
- 87 Strongly Landlord-Friendly · R+3
- County
- — inherits STATE
- City
- — inherits STATE
ZIP-level market 33956
- Home prices YoY
- -16.3%
- Active inventory
- 287
- Price-to-rent
- 9.2×
Monthly cashflow live
- Estimated rent
- $5,093 medium interval (Pro) →
- Mortgage (P&I)
- −$2,936
- Tax from tax record
- −$365 /mo · $4,374/yr
- Insurance
- −$233
- Flood insurance flood zone
- −$427 /mo · $5,118/yr
- HOA
- −$0
- Vacancy / Maint / Mgmt
- −$1,070
- Net cashflow
- $63
Break-even live
UW: 25.0% down · 7.5% · 30yr · 1.5% tax · 5.0% vac · 8.0% maint · 8.0% mgmt
Financing live
Cash to close
- Down payment
- $139,975
- Closing costs
- $16,797
- Reserves months
- —
- Total cash needed
- —
Loan-product check · same deal, 3 products live
Conventional
25% down · 7.5% · 30yr
- Down + closing
- —
- Monthly P&I
- —
- Monthly cashflow
- —
- DSCR
- —
- Eligible?
- —
Personal DTI + credit; lowest rate.
DSCR
20% down · 8.5% · 30yr
- Down + closing
- —
- Monthly P&I
- —
- Monthly cashflow
- —
- DSCR
- —
- Eligible?
- —
No personal income docs; deal must DSCR.
Hard money
10% down · 12.0% · 12mo
- Down + closing
- —
- Monthly P&I
- —
- Monthly cashflow
- —
- DSCR
- —
- Eligible?
- —
Short-term bridge; refi at stabilization.
Rent comps 5 comps
| Address | Beds | Baths | Sqft | Rent | $/sqft | DOM | Units | Dist |
|---|---|---|---|---|---|---|---|---|
| 3811 Emerald Ave Saint James City, FL | 3.0 | 2.5 | 1500 | $5,500 | $3.67 | 23d | 1 | 0.24mi |
| 3864 Royal Palm Dr Saint James City, FL | 2.0 | 1.0 | 960 | $1,650 | $1.72 | 23d | 1 | 0.62mi |
| 2744 Sanderling Ct Saint James City, FL | 2.0 | 1.0 | 841 | $5,300 | $6.30 | 23d | 1 | 0.73mi |
| 2951 York Rd Saint James City, FL | 2.0 | 2.0 | 1444 | $5,500 | $3.81 | 23d | 1 | 0.79mi |
| 3103 Harpoon Ln Saint James City, FL | 2.0 | 2.0 | 1094 | $3,000 | $2.74 | 23d | 1 | 0.98mi |
Listing history 6 events
-
2026-06-18days on market $559,900 Active 6 DOM
-
2026-06-17days on market $559,900 Active 5 DOM
-
2026-06-16days on market $559,900 Active 4 DOM
-
2026-06-15days on market $559,900 Active 3 DOM
-
2026-06-13remarks 687-char remark
-
2026-06-13$559,900 Active 1 DOM
ⓘ Source: listings_history table (triggers on properties + properties_extension) + one-shot
backfill from property_details.listing_events for pre-trigger history.
Tax reassessment forecast FL · Resets to sale price
- Current annual tax
- $4,374 · $365/mo
- Projected year-2 tax
- $4,647 · $387/mo
- Expected delta
- +$273/yr (+$23/mo · 6.2%)
ⓘ Screening estimate from a state-policy table — verify with the county assessor before closing.
Climate risk First Street
- Flood 9/10 Extreme FEMA zone AE · 99% chance over 30 yrs
- Wildfire 1/10 Low
- Heat 10/10 Extreme 7 d/yr ≥107°F today · 28 d/yr by 30 yrs out
- Wind 10/10 Extreme 99% chance of damaging wind over 30 yrs
- Air quality 2/10 Low 1 unhealthy d/yr today · 2 by 30 yrs out
Nearby sold comps map
Loading sold comps map…
Walkable amenities ~0.75 mi
Loading nearby amenities…
Taxation est. · year 1
- Rental income
- $61,118
- − Mortgage interest
- −$31,363
- − Property taxes
- −$4,374
- − Insurance
- −$7,918
- − Repairs & maintenance
- −$4,889
- − Management
- −$4,889
- − Depreciation
- −$16,288
- Taxable loss
- −$8,604
- Est. tax savings @ 24.0%
- +$2,065
- After-tax cash flow
- $2,822/yr
For passive investors: Depreciation is non-cash, so a rental often shows a tax loss while cash-flowing — sheltering income. Rental losses are passive: they offset passive income freely, and up to $25,000/yr can offset ordinary (W-2) income if you actively participate and your MAGI is under $100k (phasing out to $0 by $150k); unused losses carry forward. On sale, claimed depreciation is recaptured at up to 25%, and gains may owe capital-gains tax (a 1031 exchange can defer both). Figures are a year-1 estimate at your 24.0% rate — not tax advice; consult a CPA.
Schools (NCES district)
- District
- Lee
- NCES district ID
- 1201080
- Math proficiency
- 47% ▼ -11.00%
- Reading proficiency
- 50% ▼ -4.00%
- Median HH income
- $49,518
- Composite
- 41.49/100
- National rank
- #3458
- State rank
- #42 of 73 in FL
Livability — St. James City
No livability data for this city. (Only ~50 U.S. cities are tracked.)
Census & demographics
- Census place
- St. James City, FL
- Population (ZIP)
- 3,846
Population outlook (Lee County) Hauer SSP2
- Today (2025)
- 871,946 people
- By 2030
- 955,468 · +9.6%
- By 2040
- 1,113,587 · +27.7%
- By 2050
- 1,256,891 · +44.1%
- By 2075
- 1,560,270 · +78.9%
- By 2100
- 1,726,848 · +98.0%
Race, ethnicity, and origin ACS 2023
- Neighborhood character
- Predominantly White (94%)
- Race & ethnicity
- White 94% Two or more races 3% Pacific Islander 2% Hispanic / Latino 1%
- Common ancestry
- Romanian 6% Slovak 4% Iranian 3%
- Foreign-born
- 5% · Canada
- Languages at home
- 95% English-only · French/Haitian/Cajun 2% German/W. Germanic 2% Russian/Polish/Slavic 1%
Political lean MEDSL · Lee
- 2024 margin
- Strong R (+28.4) · D 35.5% · R 63.9%
- 2008→2024 swing
- -18.0pp toward R · 2008: -10.4pp · 2024: -28.4pp
- All cycles
- 2024: R+28.4 2020: R+19.2 2016: R+20.4 2012: R+16.6 2008: R+10.4
Not yet ingested
- Civics
- —
Market trends
- HPI YoY
- ▼ -58.47%
- Current HPI
- 300.1416
- Rent YoY
- —
- Metro
- —
- State GDP YoY
- ▲ 3.28%
- F500 in state
- 36
Industry mix (Fortune 500 HQ in FL)
| Industry | F500 HQs | Revenue |
|---|---|---|
| Industrial Technology | 2 | $29B |
|
||
| Insurance | 2 | $17B |
|
||
| Retail | 1 | $60B |
|
||
| Technology Distribution | 1 | $58B |
|
||
| Homebuilding | 1 | $35B |
|
||
| Technology Manufacturing | 1 | $35B |
|
||
Price history
+94.4% since first listed12 events — show timeline
- 2026-06-05 Listed $559,900 FORTMLS
- 2020-03-30 Sold (Public Records) $370,000 Public Records
- 2020-03-27 Sold (MLS) $370,000 FORTMLS
- 2020-02-12 Pending — FORTMLS
- 2020-01-29 Relisted — FORTMLS
- 2020-01-15 Pending — FORTMLS
- 2020-01-06 Price Changed $399,900 FORTMLS
- 2019-10-21 Price Changed $425,000 FORTMLS
- 2019-06-25 Listed $439,000 FORTMLS
- 2010-03-13 Sold (MLS) $278,000 FORTMLS
- 2010-03-12 Sold (Public Records) $278,000 Public Records
- 2010-02-25 Price Changed $288,000 FORTMLS
Property tax history
+3.6%/yrLatest (2025): $4,374 · +4.0% YoY. Source: county tax records.
Cash-flow waterfall
monthlySold comps — $/sqft
last 12 mo · ≤1 miLoading sold comps…