1342 Conklin Ave · Augusta-Richmond County consolidated government (balance), GA
Flood risk 1/10 · Minimal
- FEMA flood zone
- X (unshaded)
- Chance of flooding over 30 yrs
- 0.0%
- Est. flood insurance / yr
- $507 – $1,088
Fire risk 4/10 · Minor
- Est. fire insurance / yr
- $963 – $1,789
Heat risk 8/10 · Major
- Hot days now (above 108°F)
- 7 days/yr
- Hot days in 30 yrs
- 17 days/yr
Wind risk 6/10 · Moderate
- Chance of severe wind over 30 yrs
- 62.0%
Air-quality risk 4/10 · Minor
- Unhealthy air days now
- 4 days/yr
- Unhealthy air days in 30 yrs
- 4 days/yr
Risk factors via First Street. Map © Google.
Why this score? — see what drove the B grade
The composite is a weighted blend of 9 inputs, each scored 0–100. Each bar is that input's sub-score; the figure is the points it added to the 100-point composite (weight × sub-score).
- Cash flow +30.0/30.0
- DSCR +10.0/10.0
- Appreciation +9.1/10.0
- 1% rule +8.4/10.0
- ARV discount +7.5/15.0
- Livability +2.5/5.0
- Condition / age +2.5/5.0
- Rent growth +2.2/5.0
- Schools +1.3/10.0
$99,000
🖨 Deal sheet 📄 Offer letter ✓ Due diligence
Listing remarks MLS
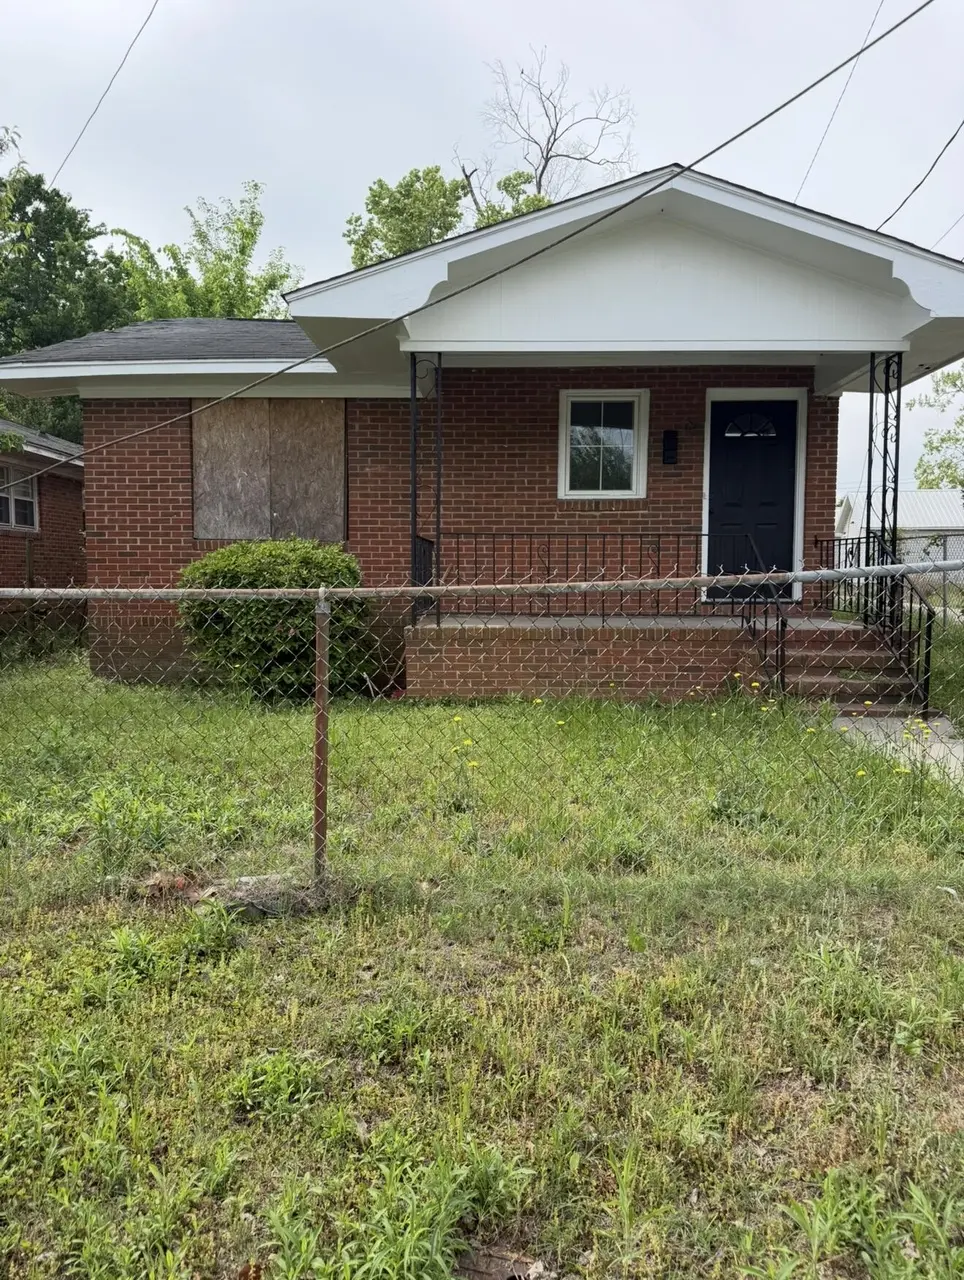
Remodeled 2 bedroom, 1 bathroom home offering comfort throughout. On a fully fenced lot. This home is move in ready and waiting for its new owners.
Key facts
- Move in ready
- Fully fenced lot
- 2,614 sq ft lot
Tags
Property features AI
Exterior
- Parking: Asphalt parking
- Utilities: Other utilities
- Home design: Single-family residence; One story; Entry level: 1
- Construction: Brick construction; Composition roof; Crawl space / no basement
- Exterior features: Porch; Back yard fencing; Has a view; No additional exterior features listed
Interior
- Bathrooms: 1 full bathroom
- Heating & cooling: Central air conditioning; Electric forced-air heating
- Interior features: Other interior features
Neighborhood map
What this means for you Summary
Snapshot
- This is a 3-bed/1.0-bath single-family listed at $99k.
Deal economics
- At list price, monthly cash flow is $396 ($5k/yr) — positive.
- The deal already cash-flows at list — no discount required.
- Meets the 1% rule at list price ($1k rent vs $99k).
- Recommended offer: $98k (1.5% below list) — sets the bar for market timing.
- Cap rate 11.1% vs local median 5.3% in Augusta-Richmond County consolidated government (balance) — top-decile yield for the area; either an underpriced asset or a hidden risk that comps aren't pricing in. Stress-test before assuming the spread holds.
Location & tenants
- Location reads: area grade B — affects rentability + tenant quality, not the cash-flow math above.
- Richmond County (urban): math 12% / reading 20% proficiency, ranked #154 of 174 in GA (top 88%) — low school quality limits family demand, transient renter base, plan for 1-2y turnover; 72% free/reduced lunch — lower-income household profile, screen leases tightly.
- Zoned schools: Jenkins-White Elementary School (math 8% / reading 8%, grade F, #1,125 of 1,228 statewide, top 93%, 389 students, 98% FRL); W.S. Hornsby Middle School (math 2% / reading 5%, grade F, #468 of 470 statewide, top 100%, 399 students, 98% FRL) — zoned schools average 98% FRL vs 72% district-wide (26 pts higher); higher-poverty schools than district average — tighter screening recommended.
- Market conditions: Rents soft (-1.3%/yr); 129 active listings in the ZIP; 32 comparable units currently listed for rent nearby; rentals lingering (median 44d on market — plan ~5-8 weeks vacancy on turnover, expect pricing pressure); 53% of comp listings sitting > 30 days — soft ceiling on asking rent; lower-income renter base — watch delinquency; 561 units permitted in Richmond County in 2024 (0 in 5+ unit buildings).
- At $1,330/mo this rent would consume 63% of the median local household income ($25k/yr) (locally 2063% of renters already pay >50% of income on rent) — very limited rent-growth headroom before tenants either downsize or default.
Forward outlook
- In year one you build about $9k of equity ($684 loan paydown + $8k appreciation (8.2% local appreciation)).
- Richmond County population projected to shrink 5% by 2050 — rents likely to lag national; underwrite the cash flow, not the appreciation.
- At projected returns (8.2% appreciation + 0.0% rent growth), your $28k cash investment doubles in ~2 years — after that, you're playing with house money.
- By year 4, paydown + projected appreciation supports a ~$31k cash-out refi (75% LTV) — recoverable capital for the next deal without selling this one.
Negotiation context
- It's been on market 24 days — a 2% lower offer ($98k) is reasonable based on typical stale-listing flexibility.
- 2 sale attempts with the ask held roughly flat each time — persistent listings suggest the price (not the market) is what's stuck; bring a comps-based counter.
Risks & watch-outs
- Climate carrying-cost: major wind risk, 62% chance of damaging wind over 30y; extreme-heat days projected 7→17/yr by 2055 (HVAC capex compounding) — expect insurance premiums to compound above CPI over the hold.
Questions for the listing agent
- Built in 1966 — when were the roof, HVAC, electrical panel, plumbing, and water heater last replaced?
- Is there a deadline driving the sale (1031 exchange, divorce, estate, relocation)? That informs how much negotiation room exists.
- What's the average days-on-market for RENTAL listings here right now (not sales)? A rising rental-DOM trend means longer vacancies and softer asking-rent achievability than the comps imply.
- What's the recent tenant-quality profile in this submarket — average credit score on applications, eviction rate, late-payment / NSF rate, and stable-employment percentage? A property-management company in the area should have these aggregated.
- How much new for-sale + rental construction is in the pipeline within 1–3 miles? Heavy new supply typically softens prices + rents 12–24 months out; constrained supply supports both.
Investment metrics
- 1% rule
- 1.34% ✓
- Cap rate
- 11.09%
- Cash-on-cash
- 17.12%
- DSCR
- 1.76
- GRM
- 6.2
CMA / ARV
- ARV (on-the-fly)
- $40,836
- Comps found
- 12
Show comp detail 12 sales within ~0.75 mi
| Address | Dist | Beds/Ba | Sqft | Sold | Price | $/sf | Match |
|---|---|---|---|---|---|---|---|
| 1434 Perry Ave | 0.17mi | 2/1.0 (-1) | 937 (-6%) | 10mo | $30,000 | $32 | 68 |
| 1502 12th St | 0.40mi | 3/1.0 | 950 (-5%) | 6mo | $80,000 | $84 | 68 |
| 1421 Chestnut St | 0.24mi | 2/1.0 (-1) | 1,022 (+3%) | 20mo | $18,000 | $18 | 63 |
| 1439 Dewitt Street St | 0.58mi | 3/1.0 | 1,014 (+2%) | 8mo | $25,000 | $25 | 63 |
| 1151 Roselle St | 0.53mi | 2/2.0 (-1) | 1,000 (+0%) | 4mo | $129,800 | $130 | 62 |
| 1635 Carpenter St | 0.49mi | 3/1.0 | 984 (-1%) | 17mo | $40,000 | $41 | 61 |
| 1586 Lee Beard Way | 0.30mi | 2/1.0 (-1) | 896 (-10%) | 8mo | $115,350 | $129 | 57 |
| 1442 Essie Mcintyre Blvd | 0.73mi | 2/1.0 (-1) | 948 (-5%) | 5mo | $23,000 | $24 | 49 |
| 1426 Essie Mcintyre Blvd | 0.75mi | 2/1.0 (-1) | 1,015 (+2%) | 10mo | $54,000 | $53 | 49 |
| 1237 11th Street St | 0.58mi | 3/1.5 | 914 (-8%) | 13mo | $160,000 | $175 | 47 |
| 1043 Cs Hamilton Way | 0.63mi | 2/1.0 (-1) | 888 (-11%) | 8mo | $30,000 | $34 | 41 |
| 1041 Cs Hamilton Way | 0.63mi | 2/1.0 (-1) | 888 (-11%) | 8mo | $30,000 | $34 | 41 |
Match score weights: distance 35% · size 25% · config 20% · recency 20%. Top-matched comps best support the ARV.
Projected returns pro-forma
8.18% appreciation · 0.0% rent growth · sell at horizon
- IRR
- 32.2%
- Equity multiple
- 3.28×
- Total profit
- $63,222
- Equity at exit
- $76,430
- IRR
- 27.5%
- Equity multiple
- 6.69×
- Total profit
- $157,625
- Equity at exit
- $152,889
Cash invested: $27,720 (down + closing). Projections, not guarantees.
Landlord ↔ Tenant lean methodology
- Overall (STATE)
- 90 Strongly Landlord-Friendly
- State Georgia
- 90 Strongly Landlord-Friendly · R+3
- County
- — inherits STATE
- City
- — inherits STATE
ZIP-level market 30901
- Home prices YoY
- 4.1%
- Rents YoY
- -1.3%
- Active inventory
- 129
- Price-to-rent
- 6.2×
Monthly cashflow live
- Estimated rent
- $1,330 high interval (Pro) →
- Mortgage (P&I)
- −$519
- Tax from tax record
- −$95 /mo · $1,140/yr
- Insurance
- −$41
- HOA
- −$0
- Vacancy / Maint / Mgmt
- −$279
- Net cashflow
- $396
Break-even live
UW: 25.0% down · 7.5% · 30yr · 1.5% tax · 5.0% vac · 8.0% maint · 8.0% mgmt
Financing live
Cash to close
- Down payment
- $24,750
- Closing costs
- $2,970
- Reserves months
- —
- Total cash needed
- —
Loan-product check · same deal, 3 products live
Conventional
25% down · 7.5% · 30yr
- Down + closing
- —
- Monthly P&I
- —
- Monthly cashflow
- —
- DSCR
- —
- Eligible?
- —
Personal DTI + credit; lowest rate.
DSCR
20% down · 8.5% · 30yr
- Down + closing
- —
- Monthly P&I
- —
- Monthly cashflow
- —
- DSCR
- —
- Eligible?
- —
No personal income docs; deal must DSCR.
Hard money
10% down · 12.0% · 12mo
- Down + closing
- —
- Monthly P&I
- —
- Monthly cashflow
- —
- DSCR
- —
- Eligible?
- —
Short-term bridge; refi at stabilization.
Rent comps 32 comps
| Address | Beds | Baths | Sqft | Rent | $/sqft | DOM | Units | Dist |
|---|---|---|---|---|---|---|---|---|
| 1425 Lee Beard Way Augusta, GA | 1.0–2.0 | 1.0 | 776 | $1,181 | $1.52 | 44d | 1 | 0.20mi |
| 1480 Wrightsboro Rd Augusta, GA | 1.0–3.0 | 1.0–2.0 | 1046 | $2,375 | $2.27 | 21d | 13 | 0.33mi |
| 1601 12th St Unit 1601 Augusta, GA | 2.0 | 1.0 | 550 | $875 | $1.59 | 44d | 1 | 0.44mi |
| 1232 12th St Unit D Augusta, GA | 2.0 | 1.0 | 800 | $1,000 | $1.25 | 44d | 1 | 0.53mi |
| 1016 Laney Walker Blvd Augusta, GA | 1.0–2.0 | 1.0 | 794 | $995 | $1.25 | 23d | 4 | 0.66mi |
| 1016 Laney Walker Blvd Augusta, GA | 2.0 | 1.0 | 885 | $935 | $1.06 | 44d | 5 | 0.66mi |
| 953 Hopkins St Augusta, GA | 3.0 | 1.0 | 806 | $1,100 | $1.36 | 44d | 1 | 0.79mi |
| 1246 Holden Dr Augusta, GA | 3.0 | 1.0 | 816 | $1,195 | $1.46 | 14d | 1 | 0.85mi |
| 1244 Holden Dr Augusta, GA | 3.0 | 1.0 | 816 | $1,195 | $1.46 | 14d | 1 | 0.86mi |
| 1239 Holden Dr Augusta, GA | 3.0 | 1.0 | 816 | $1,095 | $1.34 | 14d | 1 | 0.86mi |
| 1240 Holden Dr Augusta, GA | 2.0 | 1.0 | 675 | $1,095 | $1.62 | 44d | 1 | 0.87mi |
| 1399 Walton Way Augusta, GA | 2.0 | 2.0 | 1017 | $1,690 | $1.66 | 23d | 1 | 0.88mi |
| 1220 Holden Dr Augusta, GA | 2.0 | 1.0 | 675 | $1,095 | $1.62 | 44d | 1 | 0.92mi |
| 1313 Wilson St Apt C Augusta, GA | 2.0 | 2.0 | 900 | $1,350 | $1.50 | 44d | 1 | 0.99mi |
| 1202 Holden Dr Augusta, GA | 2.0 | 1.0 | 675 | $1,150 | $1.70 | 44d | 1 | 1.00mi |
| 1750 Essie McIntyre Blvd Augusta, GA | 2.0 | 1.0 | 720 | $950 | $1.32 | 44d | 1 | 1.02mi |
| 1328 Baker Ave Augusta, GA | 2.0 | 1.0 | 761 | $975 | $1.28 | 44d | 1 | 1.04mi |
| 709 Hall St Augusta, GA | 2.0 | 1.0 | 600 | $990 | $1.65 | 44d | 1 | 1.05mi |
| 505 13th St Augusta, GA | 2.0 | 2.0 | 950 | $1,122 | $1.18 | 44d | 3 | 1.08mi |
| 1912 Richmond Ave Unit 1912 Augusta, GA | 2.0 | 1.0 | 812 | $1,195 | $1.47 | 14d | 1 | 1.11mi |
| 913 Walker St Augusta, GA | 2.0 | 2.0 | 1000 | $1,200 | $1.20 | 14d | 1 | 1.25mi |
| 1610 Cornell Dr Augusta, GA | 3.0 | 1.0 | 1025 | $1,100 | $1.07 | 23d | 1 | 1.34mi |
| 1610 Cornell Dr Augusta, GA | 3.0 | 1.0 | 1025 | $1,100 | $1.07 | 44d | 1 | 1.34mi |
| 1838 Watkins St Augusta, GA | 2.0 | 1.0 | 672 | $1,050 | $1.56 | 23d | 1 | 1.35mi |
| 1730 Hicks St Apt A Augusta, GA | 2.0 | 1.0 | 750 | $750 | $1.00 | 14d | 1 | 1.37mi |
| 1606 Broad St Augusta, GA | 2.0 | 2.0 | 1066 | $1,200 | $1.13 | 23d | 1 | 1.39mi |
| 1030 Broad St Unit C Augusta, GA | 2.0 | 1.0 | 900 | $1,225 | $1.36 | 23d | 1 | 1.42mi |
| 1030 Broad St Unit D Augusta, GA | 2.0 | 1.0 | 880 | $1,015 | $1.15 | 23d | 1 | 1.42mi |
| 1030 Broad St Unit D Augusta, GA | 2.0 | 1.0 | 880 | $1,015 | $1.15 | 44d | 1 | 1.42mi |
| 2230 Hollis Rd Augusta, GA | 2.0 | 1.0 | 1000 | $975 | $0.97 | 44d | 1 | 1.42mi |
| 1030 Broad St Augusta, GA | 2.0 | 1.0 | 880 | $1,225 | $1.39 | 44d | 1 | 1.43mi |
| 1701 Goodrich St Augusta, GA | 1.0–3.0 | 1.0–2.0 | 1056 | $2,756 | $2.61 | 14d | 11 | 1.50mi |
Listing history 16 events
-
2026-06-18days on market $99,000 Active 24 DOM
-
2026-06-17days on market $99,000 Active 23 DOM
-
2026-06-16days on market $99,000 Active 22 DOM
-
2026-06-15days on market $99,000 Active 21 DOM
-
2026-06-14days on market $99,000 Active 19 DOM
-
2026-06-10days on market $99,000 Active 16 DOM
-
2026-06-09days on market $99,000 Active 15 DOM
-
2026-06-08days on market $99,000 Active 14 DOM
-
2026-06-07days on market $99,000 Active 13 DOM
-
2026-06-03days on market $99,000 Active 9 DOM
-
2026-06-02days on market $99,000 Active 8 DOM
-
2026-06-01days on market $99,000 Active 7 DOM
-
2026-05-31days on market $99,000 Active 6 DOM
-
2026-05-30days on market $99,000 Active 5 DOM
-
2026-05-26$99,000 Active 147-char remark
Show marketing remark (147 chars)
Remodeled 2 bedroom, 1 bathroom home offering comfort throughout. On a fully fenced lot. This home is move in ready and waiting for its new owners.
-
2026-05-26$99,000 Active
Show marketing remark (147 chars)
Remodeled 2 bedroom, 1 bathroom home offering comfort throughout. On a fully fenced lot. This home is move in ready and waiting for its new owners.
ⓘ Source: listings_history table (triggers on properties + properties_extension) + one-shot
backfill from property_details.listing_events for pre-trigger history.
Tax reassessment forecast GA · Resets to sale price
- Current annual tax
- $1,140 · $95/mo
- Projected year-2 tax
- $1,140 · $95/mo
- Expected delta
- $0/yr ($0/mo · 0.0%)
ⓘ Screening estimate from a state-policy table — verify with the county assessor before closing.
Climate risk First Street
- Flood 1/10 Low FEMA zone X (unshaded) · 0% chance over 30 yrs
- Wildfire 4/10 Moderate
- Heat 8/10 Severe 7 d/yr ≥108°F today · 17 d/yr by 30 yrs out
- Wind 6/10 Major 62% chance of damaging wind over 30 yrs
- Air quality 4/10 Moderate 4 unhealthy d/yr today · 4 by 30 yrs out
Nearby sold comps map
Loading sold comps map…
Walkable amenities ~0.75 mi
Loading nearby amenities…
Taxation est. · year 1
- Rental income
- $15,964
- − Mortgage interest
- −$5,546
- − Property taxes
- −$1,140
- − Insurance
- −$495
- − Repairs & maintenance
- −$1,277
- − Management
- −$1,277
- − Depreciation
- −$2,880
- Taxable income
- $3,349
- Est. tax owed @ 24.0%
- −$804
- After-tax cash flow
- $3,943/yr
For passive investors: Depreciation is non-cash, so a rental often shows a tax loss while cash-flowing — sheltering income. Rental losses are passive: they offset passive income freely, and up to $25,000/yr can offset ordinary (W-2) income if you actively participate and your MAGI is under $100k (phasing out to $0 by $150k); unused losses carry forward. On sale, claimed depreciation is recaptured at up to 25%, and gains may owe capital-gains tax (a 1031 exchange can defer both). Figures are a year-1 estimate at your 24.0% rate — not tax advice; consult a CPA.
Schools (NCES district)
- District
- Richmond County
- NCES district ID
- 1304380
- Math proficiency
- 12% ▼ -9.00%
- Reading proficiency
- 20% ▼ -6.00%
- Median HH income
- $38,069
- Composite
- 13.43/100
- National rank
- #9524
- State rank
- #154 of 174 in GA
Livability — Augusta-Richmond County consolidated government (balance)
No livability data for this city. (Only ~50 U.S. cities are tracked.)
Census & demographics
- Census place
- Augusta-Richmond County consolidated government (balance), GA
- County
- Richmond County · 190,917 people
- City population
- 154,035
- Metro
- Augusta-Richmond County, GA-SC
- Population (ZIP)
- 16,484
- Household income
- $25,163
- Rent vs Own
- Severe rent burden
- 2063.0
Population outlook (Richmond County) Hauer SSP2
- Today (2025)
- 200,753 people
- By 2030
- 200,232 · -0.3%
- By 2040
- 196,813 · -2.0%
- By 2050
- 190,347 · -5.2%
- By 2075
- 172,496 · -14.1%
- By 2100
- 146,284 · -27.1%
Race, ethnicity, and origin ACS 2023
- Neighborhood character
- Predominantly Black (78%)
- Race & ethnicity
- Black 78% White 15% Two or more races 4% Hispanic / Latino 2%
- Common ancestry
- Lithuanian 1% Slovak 1%
- Foreign-born
- 1% · Canada
- Languages at home
- 97% English-only · Spanish 1%
Political lean MEDSL · Richmond
- 2024 margin
- Solid D (+36.1) · D 67.8% · R 31.7%
- 2008→2024 swing
- +4.3pp toward D · 2008: 31.8pp · 2024: 36.1pp
- All cycles
- 2024: D+36.1 2020: D+37.2 2016: D+32.4 2012: D+33.8 2008: D+31.8
Not yet ingested
- Civics
- —
Market trends
- HPI YoY
- ▲ 8.18%
- Current HPI
- 206.3145
- Rent YoY
- ▼ -1.31%
- Metro
- Augusta-Richmond County, GA-SC
- State GDP YoY
- ▲ 2.66%
- F500 in state
- 28
Industry mix (Fortune 500 HQ in GA)
| Industry | F500 HQs | Revenue |
|---|---|---|
| Paper / Packaging | 2 | $29B |
|
||
| Retail | 1 | $160B |
|
||
| Transportation / Logistics | 1 | $91B |
|
||
| Airlines | 1 | $62B |
|
||
| Consumer Goods | 1 | $47B |
|
||
| Utilities | 1 | $25B |
|
||
Price history
+0.0% since first listed2 events — show timeline
- 2026-05-26 Listed $99,000 AMLS
- 2026-05-26 Listed $99,000 Hive MLS
Property tax history
+7.1%/yrLatest (2025): $1,140 · +8.9% YoY. Source: county tax records.
Cash-flow waterfall
monthlySold comps — $/sqft
last 12 mo · ≤1 miLoading sold comps…