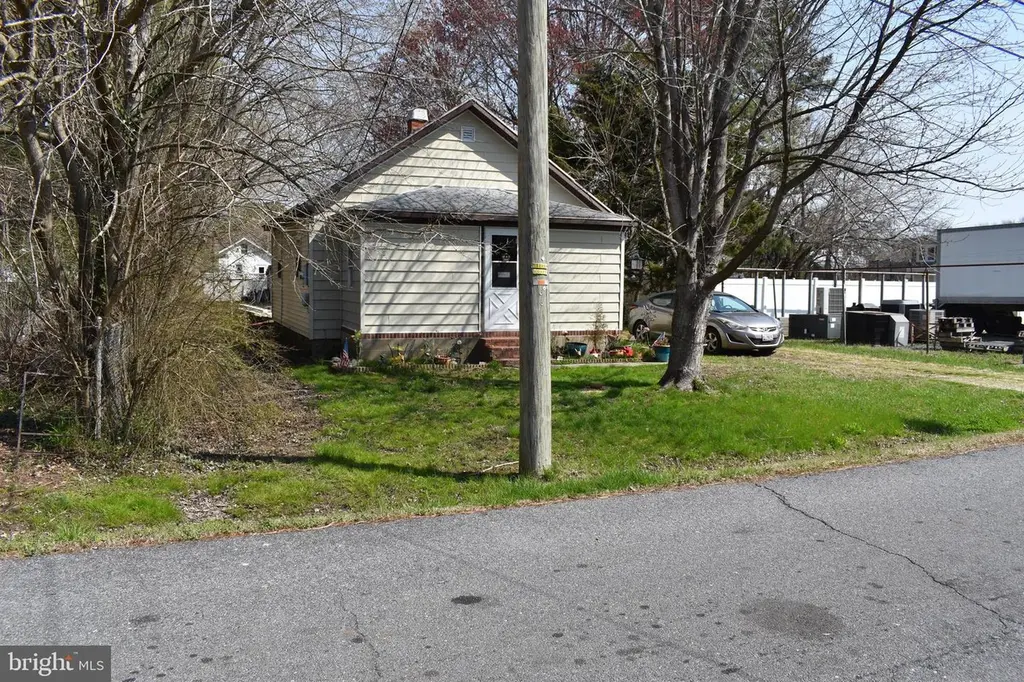
501 Harrington Ave · Cambridge, MD
Flood risk 1/10 · Minimal
- FEMA flood zone
- X (unshaded)
- Chance of flooding over 30 yrs
- 0.0%
- Est. flood insurance / yr
- $507 – $1,088
Fire risk 2/10 · Minimal
- Est. fire insurance / yr
- $755 – $1,403
Heat risk 9/10 · Severe
- Hot days now (above 104°F)
- 7 days/yr
- Hot days in 30 yrs
- 16 days/yr
Wind risk 6/10 · Moderate
- Chance of severe wind over 30 yrs
- 75.0%
Air-quality risk 3/10 · Minor
- Unhealthy air days now
- 2 days/yr
- Unhealthy air days in 30 yrs
- 3 days/yr
Risk factors via First Street. Map © Google.
Why this score? — see what drove the D grade
The composite is a weighted blend of 9 inputs, each scored 0–100. Each bar is that input's sub-score; the figure is the points it added to the 100-point composite (weight × sub-score).
- Cash flow +22.1/30.0
- DSCR +7.1/10.0
- 1% rule +5.5/10.0
- Livability +3.2/5.0
- Rent growth +2.5/5.0
- Condition / age +2.5/5.0
- Schools +1.5/10.0
- ARV discount +0.0/15.0
- Appreciation +0.0/10.0
$94,900
🖨 Deal sheet (PDF) 📄 Offer letter ✓ Due diligence
Listing remarks MLS
2 bedroom 1 bath bugalow being sold "AS IS. " The unit currently has tenants renting at $1,300 month. This one will not last long!!
Key facts
- 6,000 sq ft lot
- Built 1940
- Listed 58 days
Neighborhood map
What this means for you Summary
Snapshot
- This is a 2-bed/1.0-bath single-family listed at $95k.
Deal economics
- At list price, monthly cash flow is $152 ($2k/yr) — positive.
- The deal already cash-flows at list — no discount required.
- Meets the 1% rule at list price ($995 rent vs $95k).
- Recommended offer: $92k (3.0% below list) — sets the bar for market timing.
- Cap rate 8.2% vs local median 4.2% in Cambridge — top-decile yield for the area; either an underpriced asset or a hidden risk that comps aren't pricing in. Stress-test before assuming the spread holds.
Location & tenants
- Location reads 65/100 on livability (#255 in MD) — a middle-class / working-renter tenant base. Strengths: cost of living A+, health & safety A+, housing B+; Watch: amenities D, crime F, employment F.
- Dorchester County Public Schools (rural): math 10% / reading 23% proficiency, ranked #23 of 24 in MD (top 96%) — low school quality limits family demand, transient renter base, plan for 1-2y turnover.
- Zoned schools: Choptank Elementary School (math 2% / reading 2%, grade F, #826 of 860 statewide, top 100%, 375 students, 100% FRL); Mace'S Lane Middle School (math 2% / reading 16%, grade F, #212 of 225 statewide, top 95%, 481 students, 100% FRL); Cambridge-South Dorchester High School (math 22% / reading 42%, grade F, #151 of 222 statewide, top 68%, 784 students, 100% FRL) — zoned schools average 100% FRL vs 58% district-wide (42 pts higher); higher-poverty schools than district average — tighter screening recommended.
- Market conditions: 292 active listings in the ZIP; 1 comparable units currently listed for rent nearby; 81 units permitted in Dorchester County in 2024 (0 in 5+ unit buildings).
Forward outlook
- Local home prices are declining (-3.0%/yr); year-one equity from $656 of loan paydown is wiped out by about $3k of value loss. Plan a longer hold.
- Dorchester County population projected to shrink 10% by 2050 — rents likely to lag national; underwrite the cash flow, not the appreciation.
Negotiation context
- It's been on market 58 days — a 3% lower offer ($92k) is reasonable based on typical stale-listing flexibility.
- Current owner paid $23k; list at $95k implies a 313% gain — meaningful room to come down on a strong offer.
Risks & watch-outs
- Watch-outs: built in 1940 — expect roof / HVAC / electrical / plumbing capex.
- Climate carrying-cost: major wind risk, 75% chance of damaging wind over 30y; extreme-heat days projected 7→16/yr by 2055 (HVAC capex compounding) — expect insurance premiums to compound above CPI over the hold.
Questions for the listing agent
- It's been on market 58 days. Have you received any prior offers? Is the seller open to a 3% concession, seller financing, or rate buy-down credit?
- Built in 1940 — when were the roof, HVAC, electrical panel, plumbing, and water heater last replaced?
- Is there a deadline driving the sale (1031 exchange, divorce, estate, relocation)? That informs how much negotiation room exists.
- Schools are F-rated, which usually means shorter tenancies and higher turnover. Who's the typical renter profile here, and what's been the actual vacancy rate?
- Crime grade is F in this area — have there been break-ins, vandalism, or insurance claims at this property in the last 3 years? What carrier currently insures it and at what premium?
- The area grade is low — what's the realistic commute time and amenity access for the typical tenant pool here? Any planned neighborhood developments (good or bad) we should know about?
- What's the average days-on-market for RENTAL listings here right now (not sales)? A rising rental-DOM trend means longer vacancies and softer asking-rent achievability than the comps imply.
- What's the recent tenant-quality profile in this submarket — average credit score on applications, eviction rate, late-payment / NSF rate, and stable-employment percentage? A property-management company in the area should have these aggregated.
- How much new for-sale + rental construction is in the pipeline within 1–3 miles? Heavy new supply typically softens prices + rents 12–24 months out; constrained supply supports both.
Investment metrics
- 1% rule
- 1.05% ✓
- Cap rate
- 8.22%
- Cash-on-cash
- 6.88%
- DSCR
- 1.31
- GRM
- 7.9
CMA / ARV
- ARV (median comp)
- $66,370
- List price
- $94,900
- Delta
- 42.99%
- Verdict
- OVERPRICED
- Comps
- 20 within 1.0 mi
Show comp detail 10 sales within ~0.75 mi
| Address | Dist | Beds/Ba | Sqft | Sold | Price | $/sf | Match |
|---|---|---|---|---|---|---|---|
| 501 Harrington Ave | 0.00mi | 2/1.0 | 618 (0%) | 0mo | $85,000 | $138 | 100 |
| 510 Goldsborough Ave | 0.11mi | 2/1.0 | 660 (+7%) | 17mo | $156,000 | $236 | 70 |
| 601 Moores Ave | 0.59mi | 2/1.0 | 648 (+5%) | 2mo | $59,500 | $92 | 63 |
| 605 Robbins St | 0.63mi | 2/1.0 | 648 (+5%) | 5mo | $85,000 | $131 | 58 |
| 909 Pine St | 0.60mi | 2/1.0 | 672 (+9%) | 2mo | $64,900 | $97 | 56 |
| 818 Center St | 0.64mi | 1/1.0 (-1) | 576 (-7%) | 1mo | $58,300 | $101 | 53 |
| 814 Center St | 0.65mi | 2/1.0 | 696 (+13%) | 1mo | $58,300 | $84 | 48 |
| 810 Center St | 0.66mi | 2/1.0 | 696 (+13%) | 2mo | $67,840 | $97 | 47 |
| 816 Center St | 0.64mi | 1/1.0 (-1) | 576 (-7%) | 11mo | $54,060 | $94 | 45 |
| 913 Pine St | 0.59mi | 2/1.0 | 672 (+9%) | 16mo | $49,900 | $74 | 44 |
Match score weights: distance 35% · size 25% · config 20% · recency 20%. Top-matched comps best support the ARV.
Projected returns pro-forma
-3.0% appreciation · 3.0% rent growth · sell at horizon
- IRR
- -5.7%
- Equity multiple
- 0.79×
- Total profit
- $-5,678
- Equity at exit
- $14,150
- IRR
- 3.9%
- Equity multiple
- 1.28×
- Total profit
- $7,549
- Equity at exit
- $8,205
Cash invested: $26,572 (down + closing). Projections, not guarantees.
Landlord ↔ Tenant lean methodology
- Overall (STATE)
- 27 Tenant-Leaning
- State Maryland
- 27 Tenant-Leaning · D+14
- County
- — inherits STATE
- City
- — inherits STATE
ZIP-level market 21613
- Home prices YoY
- -25.1%
- Active inventory
- 292
- Price-to-rent
- 7.9×
Monthly cashflow live
- Estimated rent
- $995 medium interval (Pro) →
- Mortgage (P&I)
- −$498
- Tax from tax record
- −$97 /mo · $1,159/yr
- Insurance
- −$40
- HOA
- −$0
- Vacancy / Maint / Mgmt
- −$209
- Net cashflow
- $152
Break-even live
Sensitivity live
| Price | -10% $206 | -5% $179 | +0% $152 | +5% $125 | +10% $99 |
|---|---|---|---|---|---|
| Rent | -10% $74 | -5% $113 | +0% $152 | +5% $192 | +10% $231 |
| Rate | -1.0pp $200 | -0.5pp $176 | base $152 | +0.5pp $128 | +1.0pp $103 |
UW: 25.0% down · 7.5% · 30yr · 1.5% tax · 5.0% vac · 8.0% maint · 8.0% mgmt
Financing live
Cash to close
- Down payment
- $23,725
- Closing costs
- $2,847
- Reserves months
- —
- Total cash needed
- —
Loan-product check · same deal, 3 products live
Conventional
25% down · 7.5% · 30yr
- Down + closing
- —
- Monthly P&I
- —
- Monthly cashflow
- —
- DSCR
- —
- Eligible?
- —
Personal DTI + credit; lowest rate.
DSCR
20% down · 8.5% · 30yr
- Down + closing
- —
- Monthly P&I
- —
- Monthly cashflow
- —
- DSCR
- —
- Eligible?
- —
No personal income docs; deal must DSCR.
Hard money
10% down · 12.0% · 12mo
- Down + closing
- —
- Monthly P&I
- —
- Monthly cashflow
- —
- DSCR
- —
- Eligible?
- —
Short-term bridge; refi at stabilization.
Rent comps 1 comps
| Address | Beds | Baths | Sqft | Rent | $/sqft | DOM | Units | Dist |
|---|---|---|---|---|---|---|---|---|
| 824 Park Ln Cambridge, MD | 1.0 | 1.0 | 500 | $995 | $1.99 | 45d | 1 | 1.04mi |
Listing history 3 events
-
2026-05-13price $94,900 141-char remark
Show marketing remark (141 chars)
2 bedroom 1 bath bugalow being sold "AS IS. " The unit currently has tenants renting at $1,300 month. This one will not last long!!
-
2026-03-27$110,000 Active 141-char remark
Show marketing remark (141 chars)
2 bedroom 1 bath bugalow being sold "AS IS. " The unit currently has tenants renting at $1,300 month. This one will not last long!!
-
1990-12-14soldstatus $23,000
ⓘ Source: listings_history table (triggers on properties + properties_extension) + one-shot
backfill from property_details.listing_events for pre-trigger history.
Tax reassessment forecast MD · Partial reset (capped growth)
- Current annual tax
- $1,159 · $97/mo
- Projected year-2 tax
- $1,159 · $97/mo
- Expected delta
- $0/yr ($0/mo · 0.0%)
ⓘ Screening estimate from a state-policy table — verify with the county assessor before closing.
Climate risk First Street
- Flood 1/10 Low FEMA zone X (unshaded) · 0% chance over 30 yrs
- Wildfire 2/10 Low
- Heat 9/10 Extreme 7 d/yr ≥104°F today · 16 d/yr by 30 yrs out
- Wind 6/10 Major 75% chance of damaging wind over 30 yrs
- Air quality 3/10 Moderate 2 unhealthy d/yr today · 3 by 30 yrs out
Nearby sold comps map
Loading sold comps map…
Walkable amenities ~0.75 mi
Loading nearby amenities…
Taxation est. · year 1
- Rental income
- $11,940
- − Mortgage interest
- −$5,316
- − Property taxes
- −$1,159
- − Insurance
- −$474
- − Repairs & maintenance
- −$955
- − Management
- −$955
- − Depreciation
- −$2,761
- Taxable income
- $320
- Est. tax owed @ 24.0%
- −$77
- After-tax cash flow
- $1,751/yr
For passive investors: Depreciation is non-cash, so a rental often shows a tax loss while cash-flowing — sheltering income. Rental losses are passive: they offset passive income freely, and up to $25,000/yr can offset ordinary (W-2) income if you actively participate and your MAGI is under $100k (phasing out to $0 by $150k); unused losses carry forward. On sale, claimed depreciation is recaptured at up to 25%, and gains may owe capital-gains tax (a 1031 exchange can defer both). Figures are a year-1 estimate at your 24.0% rate — not tax advice; consult a CPA.
Schools (NCES district)
- District
- Dorchester County Public Schools
- NCES district ID
- 2400300
- Math proficiency
- 10% ▼ -14.00%
- Reading proficiency
- 23% ▼ -12.00%
- Median HH income
- $46,767
- Composite
- 14.65/100
- National rank
- #9404
- State rank
- #23 of 24 in MD
Livability — Cambridge
- Score
- 65/100
- State rank
- #255
- US rank
- #13046
Category grades
Schools grade is shown separately in the Schools card above.
Census & demographics
- Census place
- Cambridge, MD
- Population (ZIP)
- 18,167
Population outlook (Dorchester County) Hauer SSP2
- Today (2025)
- 31,699 people
- By 2030
- 31,054 · -2.0%
- By 2040
- 29,712 · -6.3%
- By 2050
- 28,618 · -9.7%
- By 2075
- 28,436 · -10.3%
- By 2100
- 28,937 · -8.7%
Race, ethnicity, and origin ACS 2023
- Neighborhood character
- Diverse neighborhood (Simpson 0.62)
- Race & ethnicity
- White 52% Black 33% Two or more races 10% Hispanic / Latino 6% Asian 2%
- Hispanic origin (detail)
- Puerto Rican 3%
- Common ancestry
- Romanian 1% Lithuanian 1% Italian 1%
- Foreign-born
- 4% · Canada
- Languages at home
- 95% English-only · Spanish 3% Other Indo-European 1% German/W. Germanic 1%
Political lean MEDSL · Dorchester
- 2024 margin
- R (+14.6) · D 41.6% · R 56.1% · Other 2.3%
- 2008→2024 swing
- -6.3pp toward R · 2008: -8.2pp · 2024: -14.6pp
- All cycles
- 2024: R+14.6 2020: R+11.9 2016: R+16.0 2012: R+6.6 2008: R+8.2
Not yet ingested
- Civics
- —
Market trends
- HPI YoY
- ▼ -91.03%
- Current HPI
- 271.1127
- Rent YoY
- —
- Metro
- —
- State GDP YoY
- ▲ 2.97%
- F500 in state
- 12
Industry mix (Fortune 500 HQ in MD)
| Industry | F500 HQs | Revenue |
|---|---|---|
| Aerospace / Defense | 1 | $71B |
|
||
| Utilities | 1 | $25B |
|
||
| Hotels | 1 | $24B |
|
||
| Consumer Goods | 1 | $7B |
|
||
| Real Estate | 1 | $6B |
|
||
| Chemicals | 1 | $2B |
|
||
Price history
+312.6% since first listed3 events — show timeline
- 2026-05-13 Price Changed $94,900 BRIGHT MLS
- 2026-03-27 Listed $110,000 BRIGHT MLS
- 1990-12-14 Sold (Public Records) $23,000 Public Records
Property tax history
+2.5%/yrLatest (2025): $1,159 · +8.7% YoY. Source: county tax records.
Cash-flow waterfall
monthlySold comps — $/sqft
last 12 mo · ≤1 miLoading sold comps…