 🏗️ New Construction
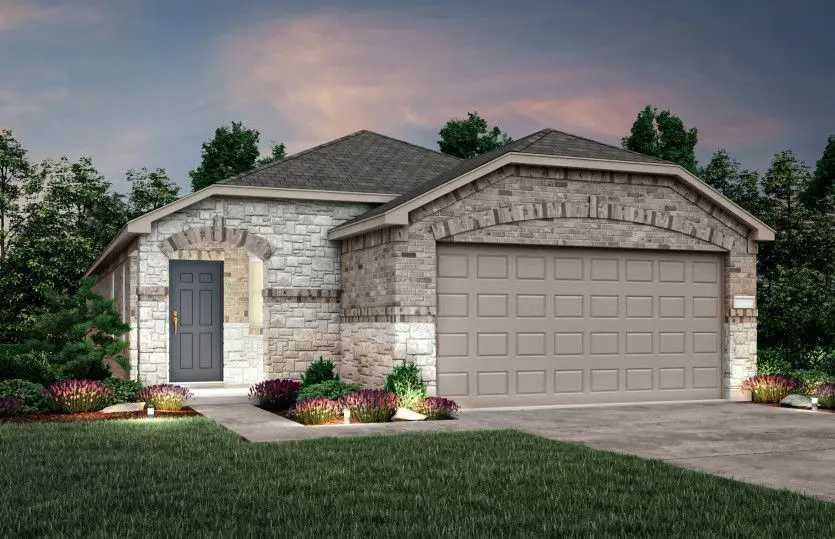
Taft Plan · Grangerland, TX
Flood risk No data
- FEMA flood zone
- —
- Chance of flooding over 30 yrs
- —
- Est. flood insurance / yr
- —
Fire risk No data
- Est. fire insurance / yr
- —
Heat risk No data
- Hot days now (above threshold)
- —
- Hot days in 30 yrs
- —
Wind risk No data
- Chance of severe wind over 30 yrs
- —
Air-quality risk No data
- Unhealthy air days now
- —
- Unhealthy air days in 30 yrs
- —
Risk factors via First Street. Map © Google.
Why this score? — see what drove the D- grade
The composite is a weighted blend of 9 inputs, each scored 0–100. Each bar is that input's sub-score; the figure is the points it added to the 100-point composite (weight × sub-score).
- Cash flow +10.4/30.0
- ARV discount +7.5/15.0
- Schools +5.1/10.0
- Condition / age +4.0/5.0
- Rent growth +3.3/5.0
- 1% rule +3.1/10.0
- DSCR +3.0/10.0
- Livability +2.5/5.0
- Appreciation +0.0/10.0
$238,990
🖨 Deal sheet 📄 Offer letter ✓ Due diligence
Listing remarks MLS
The one-story Taft offers easy living for families and couples alike, featuring an exclusive owner's suite with a spa-like bath, and a pair of secondary bedrooms for family members of guests. A separate dining room and gourmet kitchen provide the perfect backdrop for entertaining family or friends, and the family room offers a casual retreat.
Key facts
- Listed 952 days
Neighborhood map
What this means for you Summary
Snapshot
- This is a 3-bed/2.0-bath single-family listed at $239k. Condition is rated good.
Deal economics
- At list price, monthly cash flow is $-142 ($-2k/yr) — negative.
- The deal already cash-flows at list — no discount required.
- To meet the 1% rule (rent ≥ 1% of price), the offer needs to be $218k (8.9% below list).
- Recommended offer: $210k (12.0% below list) — sets the bar for market timing.
Location & tenants
- Location reads: area grade D — affects rentability + tenant quality, not the cash-flow math above.
- Conroe ISD (other): math 57% / reading 57% proficiency, ranked #69 of 826 in TX (top 8%) — acceptable for families but not a draw, mixed tenant base, ~2y average lease.
- Market conditions: Rents rising (+3.3%/yr); 1111 active listings in the ZIP; 2 comparable units currently listed for rent nearby; solid renter incomes; 13,259 units permitted in Montgomery County in 2024 (1,402 in 5+ unit buildings).
- This rent runs 31% of the median local income ($85k/yr) — at the standard rent-burdened threshold; future hikes will face affordability resistance.
Forward outlook
- Local home prices are declining (-3.0%/yr); year-one equity from $2k of loan paydown is wiped out by about $8k of value loss. Plan a longer hold.
- Montgomery County population projected at +65% by 2050 — long-run rental-demand tailwind backs the buy-and-hold thesis.
Negotiation context
- It's been on market 953 days — a 12% lower offer ($210k) is reasonable based on typical stale-listing flexibility.
Questions for the listing agent
- What do current leases actually rent for vs. the listed asking? Can we see a recent rent roll and the last 12 months of T-12 income?
- It's been on market 953 days. Have you received any prior offers? Is the seller open to a 12% concession, seller financing, or rate buy-down credit?
- Why hasn't it sold? Are there any deal-killer items the seller is aware of (foundation, flood, title, zoning, code violations)?
- Is there a deadline driving the sale (1031 exchange, divorce, estate, relocation)? That informs how much negotiation room exists.
- The area grade is low — what's the realistic commute time and amenity access for the typical tenant pool here? Any planned neighborhood developments (good or bad) we should know about?
- What's the average days-on-market for RENTAL listings here right now (not sales)? A rising rental-DOM trend means longer vacancies and softer asking-rent achievability than the comps imply.
- What's the recent tenant-quality profile in this submarket — average credit score on applications, eviction rate, late-payment / NSF rate, and stable-employment percentage? A property-management company in the area should have these aggregated.
- How much new for-sale + rental construction is in the pipeline within 1–3 miles? Heavy new supply typically softens prices + rents 12–24 months out; constrained supply supports both.
Investment metrics
- 1% rule
- 0.81% ✗
- Cap rate
- 5.66%
- Cash-on-cash
- -2.25%
- DSCR
- 0.90
- GRM
- 10.3
CMA / ARV
- ARV (median comp)
- $269,394
- List price
- $238,990
- Delta
- -11.29%
- Verdict
- UNDERPRICED
- Comps
- 20 within 1.0 mi
Show comp detail 12 sales within ~0.75 mi
| Address | Dist | Beds/Ba | Sqft | Sold | Price | $/sf | Match |
|---|---|---|---|---|---|---|---|
| 16136 Sepia Manor St | 0.00mi | 3/2.0 | 1,512 (0%) | 2mo | $262,339 | $174 | 98 |
| 15022 English Rose Rd | 0.00mi | 3/2.0 | 1,512 (0%) | 3mo | $258,510 | $171 | 97 |
| 16128 Sepia Manor St | 0.00mi | 3/2.0 | 1,512 (0%) | 5mo | $264,630 | $175 | 96 |
| 14526 Rustic Birch Dr | 0.31mi | 3/2.0 | 1,533 (+1%) | 2mo | $235,000 | $153 | 82 |
| 16215 Palermo Oaks | 0.27mi | 3/2.0 | 1,581 (+5%) | 9mo | $249,900 | $158 | 72 |
| 14531 Cedar Ledge Ln | 0.44mi | 3/2.0 | 1,512 (0%) | 16mo | $271,088 | $179 | 66 |
| 14558 Rustic Birch Dr | 0.37mi | 3/2.0 | 1,590 (+5%) | 12mo | $249,990 | $157 | 64 |
| 14519 Cedar Ledge Ln | 0.42mi | 3/2.0 | 1,580 (+4%) | 13mo | $276,939 | $175 | 62 |
| 14914 Ash Landing Dr | 0.74mi | 3/2.0 | 1,496 (-1%) | 15mo | $274,860 | $184 | 51 |
| 14960 Scarlet Branch Dr | 0.74mi | 3/2.0 | 1,674 (+11%) | 0mo | $295,000 | $176 | 47 |
| 15881 Hayes Market Loop | 0.43mi | 3/2.0 | 1,725 (+14%) | 16mo | $309,000 | $179 | 44 |
| 16766 Lake Cir | 0.74mi | 4/2.0 (+1) | 1,438 (-5%) | 17mo | $170,000 | $118 | 38 |
Match score weights: distance 35% · size 25% · config 20% · recency 20%. Top-matched comps best support the ARV.
Projected returns pro-forma
-3.0% appreciation · 3.3% rent growth · sell at horizon
- IRR
- -19.7%
- Equity multiple
- 0.31×
- Total profit
- $-51,976
- Equity at exit
- $40,168
- IRR
- -11.9%
- Equity multiple
- 0.28×
- Total profit
- $-54,013
- Equity at exit
- $23,292
Cash invested: $75,430 (down + closing). Projections, not guarantees.
Landlord ↔ Tenant lean methodology
- Overall (STATE)
- 87 Strongly Landlord-Friendly
- State Texas
- 87 Strongly Landlord-Friendly · R+5
- County
- — inherits STATE
- City
- — inherits STATE
ZIP-level market 77302
- Rents YoY
- 3.3%
- Active inventory
- 1111
- Price-to-rent
- 9.1×
Monthly cashflow live
- Estimated rent
- $2,177 medium interval (Pro) →
- Mortgage (P&I)
- −$1,413
- Tax est. 1.5%
- −$337 /mo · $4,041/yr
- Insurance
- −$112
- HOA
- −$0
- Vacancy / Maint / Mgmt
- −$457
- Net cashflow
- $-142
Break-even live
UW: 25.0% down · 7.5% · 30yr · 1.5% tax · 5.0% vac · 8.0% maint · 8.0% mgmt
Financing live
Cash to close
- Down payment
- $67,349
- Closing costs
- $8,082
- Reserves months
- —
- Total cash needed
- —
Loan-product check · same deal, 3 products live
Conventional
25% down · 7.5% · 30yr
- Down + closing
- —
- Monthly P&I
- —
- Monthly cashflow
- —
- DSCR
- —
- Eligible?
- —
Personal DTI + credit; lowest rate.
DSCR
20% down · 8.5% · 30yr
- Down + closing
- —
- Monthly P&I
- —
- Monthly cashflow
- —
- DSCR
- —
- Eligible?
- —
No personal income docs; deal must DSCR.
Hard money
10% down · 12.0% · 12mo
- Down + closing
- —
- Monthly P&I
- —
- Monthly cashflow
- —
- DSCR
- —
- Eligible?
- —
Short-term bridge; refi at stabilization.
Rent comps 2 comps
| Address | Beds | Baths | Sqft | Rent | $/sqft | DOM | Units | Dist |
|---|---|---|---|---|---|---|---|---|
| 16350 Many Trees Ln Conroe, TX | 3.0 | 2.0 | 1550 | $1,500 | $0.97 | 24d | 1 | 1.07mi |
| 16393 Many Trees Ln Conroe, TX | 3.0 | 2.0 | 1540 | $1,795 | $1.17 | 43d | 1 | 1.18mi |
Listing history 16 events
-
2026-06-18days on market $238,990 Active 953 DOM
-
2026-06-17days on market $238,990 Active 952 DOM
-
2026-06-16days on market $238,990 Active 951 DOM
-
2026-06-15days on market $238,990 Active 950 DOM
-
2026-06-13days on market $238,990 Active 948 DOM
-
2026-06-09days on market $238,990 Active 944 DOM
-
2026-06-08days on market $238,990 Active 943 DOM
-
2026-06-07days on market $238,990 Active 942 DOM
-
2026-06-04days on market $238,990 Active 939 DOM
-
2026-06-03days on market $238,990 Active 938 DOM
-
2026-06-01days on market $238,990 Active 936 DOM
-
2026-05-31days on market $238,990 Active 935 DOM
-
2025-12-28price $238,990 344-char remark
Show marketing remark (344 chars)
The one-story Taft offers easy living for families and couples alike, featuring an exclusive owner's suite with a spa-like bath, and a pair of secondary bedrooms for family members of guests. A separate dining room and gourmet kitchen provide the perfect backdrop for entertaining family or friends, and the family room offers a casual retreat.
-
2024-09-18price $248,990 344-char remark
Show marketing remark (344 chars)
The one-story Taft offers easy living for families and couples alike, featuring an exclusive owner's suite with a spa-like bath, and a pair of secondary bedrooms for family members of guests. A separate dining room and gourmet kitchen provide the perfect backdrop for entertaining family or friends, and the family room offers a casual retreat.
-
2024-06-13price $246,990 344-char remark
Show marketing remark (344 chars)
The one-story Taft offers easy living for families and couples alike, featuring an exclusive owner's suite with a spa-like bath, and a pair of secondary bedrooms for family members of guests. A separate dining room and gourmet kitchen provide the perfect backdrop for entertaining family or friends, and the family room offers a casual retreat.
-
2023-11-08$263,490 Active 344-char remark
Show marketing remark (344 chars)
The one-story Taft offers easy living for families and couples alike, featuring an exclusive owner's suite with a spa-like bath, and a pair of secondary bedrooms for family members of guests. A separate dining room and gourmet kitchen provide the perfect backdrop for entertaining family or friends, and the family room offers a casual retreat.
ⓘ Source: listings_history table (triggers on properties + properties_extension) + one-shot
backfill from property_details.listing_events for pre-trigger history.
Nearby sold comps map
Loading sold comps map…
Walkable amenities ~0.75 mi
Loading nearby amenities…
Taxation est. · year 1
- Rental income
- $26,129
- − Mortgage interest
- −$15,090
- − Property taxes
- −$4,041
- − Insurance
- −$1,347
- − Repairs & maintenance
- −$2,090
- − Management
- −$2,090
- − Depreciation
- −$7,837
- Taxable loss
- −$6,366
- Est. tax savings @ 24.0%
- +$1,528
- After-tax cash flow
- $-171/yr
For passive investors: Depreciation is non-cash, so a rental often shows a tax loss while cash-flowing — sheltering income. Rental losses are passive: they offset passive income freely, and up to $25,000/yr can offset ordinary (W-2) income if you actively participate and your MAGI is under $100k (phasing out to $0 by $150k); unused losses carry forward. On sale, claimed depreciation is recaptured at up to 25%, and gains may owe capital-gains tax (a 1031 exchange can defer both). Figures are a year-1 estimate at your 24.0% rate — not tax advice; consult a CPA.
Condition & rehab AI · 12 photos
This one-story home is in good condition with a modern kitchen and well-maintained exterior. Minor updates to the exterior and landscaping can further enhance its curb appeal and value.
Value-add opportunities
- Resale Paint exterior siding — Fresh paint can enhance curb appeal and property value.
- Resale Trim and paint exterior trim — Well-maintained trim can improve the home's appearance.
- Both Clean and maintain landscaping — A well-maintained yard can increase both resale and rental value.
- Both Replace light fixtures — Modern light fixtures can enhance the home's curb appeal and functionality.
- Both Install smart home devices — Smart home devices can increase convenience and appeal to potential buyers/renters.
- Both Add smart thermostat — A smart thermostat can improve energy efficiency and comfort, attracting more buyers/renters.
Renovation cost estimate screening
Value-add ROI direction
- Resale Paint exterior siding — Fresh paint can enhance curb appeal and property value. ↑
- Resale Trim and paint exterior trim — Well-maintained trim can improve the home's appearance. ↑
- Both Clean and maintain landscaping — A well-maintained yard can increase both resale and rental value. ↑
- Both Replace light fixtures — Modern light fixtures can enhance the home's curb appeal and functionality. ↑
- Both Install smart home devices — Smart home devices can increase convenience and appeal to potential buyers/renters. ↑
- Both Add smart thermostat — A smart thermostat can improve energy efficiency and comfort, attracting more buyers/renters. ↑
ⓘ Cost ranges are severity-bucket heuristics (US national rule-of-thumb). Get contractor quotes + a written scope before underwriting a rehab budget.
Schools (NCES district)
- District
- Conroe ISD
- NCES district ID
- 4815000
- Math proficiency
- 57% ▼ -6.00%
- Reading proficiency
- 57% ▼ -1.00%
- Median HH income
- $71,541
- Composite
- 50.65/100
- National rank
- #1833
- State rank
- #69 of 826 in TX
Livability — Grangerland
No livability data for this city. (Only ~50 U.S. cities are tracked.)
Census & demographics
- County
- Montgomery County · 663,713 people
- Metro
- Houston-The Woodlands-Sugar Land, TX
- Population (ZIP)
- 21,546
- Household income
- $84,673
- Rent vs Own
- Severe rent burden
- 205.0
Population outlook (Montgomery County) Hauer SSP2
- Today (2025)
- 713,896 people
- By 2030
- 805,263 · +12.8%
- By 2040
- 992,708 · +39.1%
- By 2050
- 1,179,590 · +65.2%
- By 2075
- 1,628,084 · +128.1%
- By 2100
- 1,937,880 · +171.5%
Race, ethnicity, and origin ACS 2023
- Neighborhood character
- Majority White (63%)
- Race & ethnicity
- White 63% Hispanic / Latino 29% Two or more races 19% Black 3% Asian 1%
- Hispanic origin (detail)
- Mexican 26% Puerto Rican 1%
- Common ancestry
- Lithuanian 3% Italian 2% Slovak 2%
- Foreign-born
- 13% · Canada, Vietnam, China
- Languages at home
- 78% English-only · Spanish 20% Russian/Polish/Slavic 1% Other Indo-European 0%
Political lean MEDSL · Montgomery
- 2024 margin
- Solid R (+45.5) · D 26.8% · R 72.3%
- 2008→2024 swing
- +7.2pp toward D · 2008: -52.7pp · 2024: -45.5pp
- All cycles
- 2024: R+45.5 2020: R+43.8 2016: R+51.4 2012: R+60.7 2008: R+52.7
Not yet ingested
- Civics
- —
Market trends
- HPI YoY
- ▼ -187.56%
- Current HPI
- 262.1879
- Rent YoY
- ▲ 3.30%
- Metro
- Houston-The Woodlands-Sugar Land, TX
- State GDP YoY
- ▲ 3.95%
- F500 in state
- 110
Industry mix (Fortune 500 HQ in TX)
| Industry | F500 HQs | Revenue |
|---|---|---|
| Energy | 16 | $1,198B |
|
||
| Technology | 5 | $198B |
|
||
| Engineering / Construction | 4 | $72B |
|
||
| Energy Services | 3 | $60B |
|
||
| Utilities | 3 | $41B |
|
||
| Healthcare | 2 | $330B |
|
||
Price history
-9.3% since first listed4 events — show timeline
- 2025-12-28 Price Changed $238,990 Zillow
- 2024-09-18 Price Changed $248,990 Zillow
- 2024-06-13 Price Changed $246,990 Zillow
- 2023-11-08 Listed $263,490 Zillow
Cash-flow waterfall
monthlySold comps — $/sqft
last 12 mo · ≤1 miLoading sold comps…