 🏷️ Likely Rental
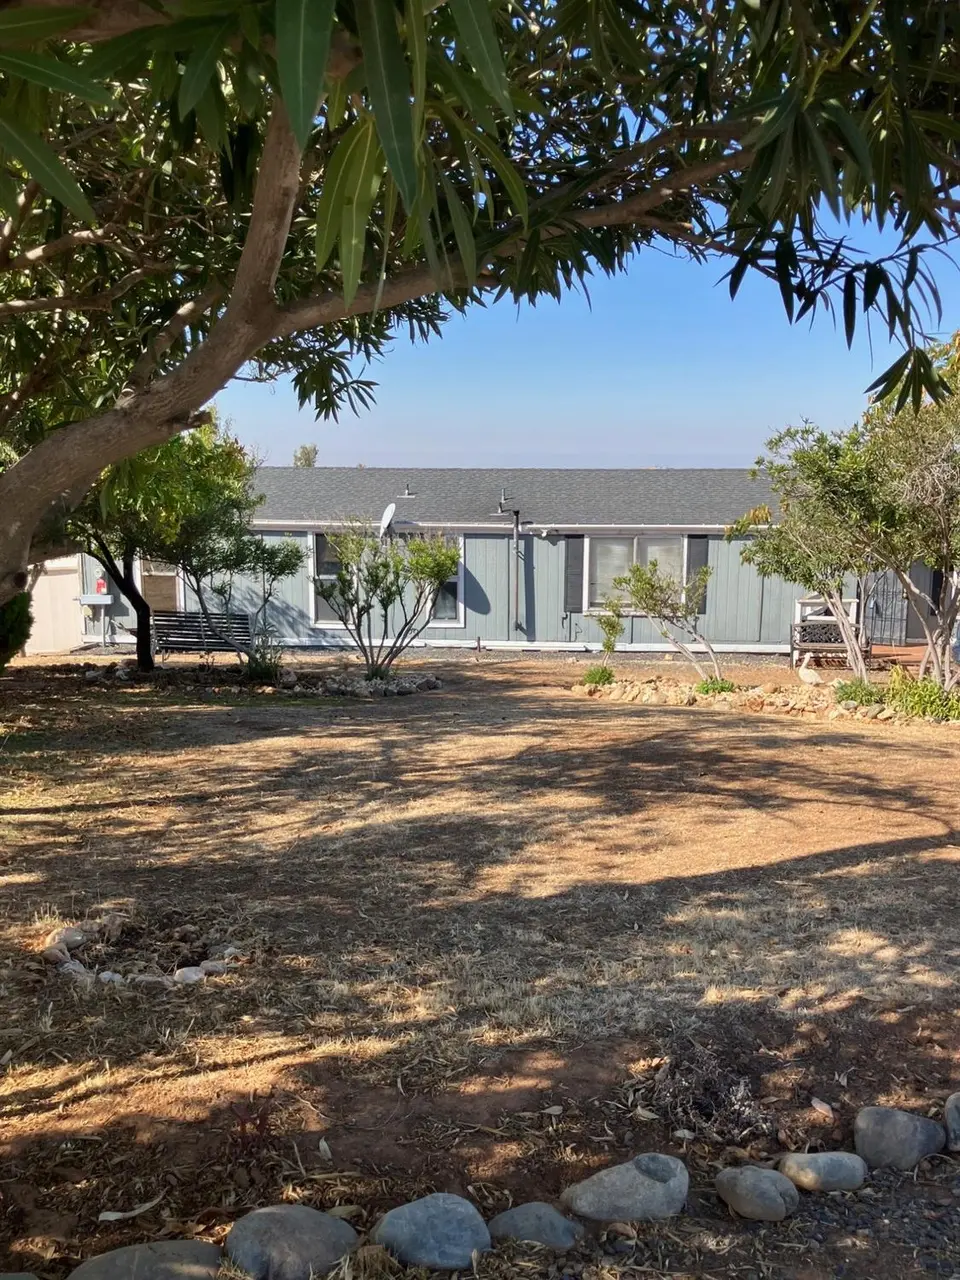
9717 Alamo · Lake Don Pedro, CA
Flood risk 1/10 · Minimal
- FEMA flood zone
- X (unshaded)
- Chance of flooding over 30 yrs
- 0.0%
- Est. flood insurance / yr
- $507 – $1,088
Fire risk 5/10 · Moderate
- Est. fire insurance / yr
- $659 – $1,223
Heat risk 7/10 · Major
- Hot days now (above 105°F)
- 6 days/yr
- Hot days in 30 yrs
- 15 days/yr
Wind risk 1/10 · Minimal
- Chance of severe wind over 30 yrs
- —
Air-quality risk 10/10 · Severe
- Unhealthy air days now
- 35 days/yr
- Unhealthy air days in 30 yrs
- 44 days/yr
Risk factors via First Street. Map © Google.
Why this score? — see what drove the B- grade
The composite is a weighted blend of 9 inputs, each scored 0–100. Each bar is that input's sub-score; the figure is the points it added to the 100-point composite (weight × sub-score).
- Cash flow +22.9/30.0
- ARV discount +15.0/15.0
- DSCR +7.4/10.0
- Appreciation +5.8/10.0
- 1% rule +5.1/10.0
- Schools +3.0/10.0
- Livability +2.8/5.0
- Rent growth +2.5/5.0
- Condition / age +2.5/5.0
$246,900
🖨 Deal sheet 📄 Offer letter ✓ Due diligence
Listing remarks
Back on market. Great opportunity to own a property with 1.4 acres with gorgeous views all around. This 2 bedroom (possible 3rd bedroom, 2 bath home boasts 1536 sq feet of living space. Open floor plan with cathedral ceilings. Sit on back deck and enjoy the sunset view. Club house for only $12.00 per month offers full gym, pool, spa, play ground area with full equipment and more. Don't miss out. Need some work in home and property, but at this price its worth it. NEWER Solar lease only $201.00 per month offers substantial savings.
Key facts
- 1.4 acres
- Full gym
- Sunset view
Tags
Neighborhood map
What this means for you Summary
Snapshot
- This is a 2-bed/2.0-bath single-family listed at $247k.
Deal economics
- At list price, monthly cash flow is $435 ($5k/yr) — positive.
- The deal already cash-flows at list — no discount required.
- Meets the 1% rule at list price ($2k rent vs $247k).
- Recommended offer: $217k (12.0% below list) — sets the bar for market timing.
- Cap rate 8.4% vs local median 3.8% in Lake Don Pedro — top-decile yield for the area; either an underpriced asset or a hidden risk that comps aren't pricing in. Stress-test before assuming the spread holds.
Location & tenants
- Location reads 55/100 on livability (#867 in CA) — a working-class tenant base; expect higher turnover. Strengths: crime A-, housing B+; Watch: schools D-, amenities F, commute F.
- Mariposa County Unified (rural): math 27% / reading 42% proficiency, ranked #282 of 517 in CA (top 54%) — families likely to look elsewhere, expect single-tenant / working-renter base with shorter leases.
- Market conditions: 111 active listings in the ZIP; 1 comparable units currently listed for rent nearby; 89 units permitted in Mariposa County in 2024 (0 in 5+ unit buildings).
Forward outlook
- In year one you build about $6k of equity ($2k loan paydown + $4k appreciation (1.6% local appreciation)).
- Mariposa County population projected at -23% by 2050 — secular population decline; favor cash flow + early exit over multi-decade hold.
- At projected returns (1.6% appreciation + 3.0% rent growth), your $69k cash investment doubles in ~6 years — after that, you're playing with house money.
- By year 6, paydown + projected appreciation supports a ~$31k cash-out refi (75% LTV) — recoverable capital for the next deal without selling this one.
Negotiation context
- It's been on market 244 days — a 12% lower offer ($217k) is reasonable based on typical stale-listing flexibility.
Risks & watch-outs
- Climate carrying-cost: moderate wildfire risk; extreme-heat days projected 6→15/yr by 2055 (HVAC capex compounding) — expect insurance premiums to compound above CPI over the hold.
Questions for the listing agent
- It's been on market 244 days. Have you received any prior offers? Is the seller open to a 12% concession, seller financing, or rate buy-down credit?
- What does the HOA fee cover, when was the last increase, and are there any pending special assessments or reserve-fund shortfalls?
- Why hasn't it sold? Are there any deal-killer items the seller is aware of (foundation, flood, title, zoning, code violations)?
- Is there a deadline driving the sale (1031 exchange, divorce, estate, relocation)? That informs how much negotiation room exists.
- Schools are D-rated, which usually means shorter tenancies and higher turnover. Who's the typical renter profile here, and what's been the actual vacancy rate?
- What's the average days-on-market for RENTAL listings here right now (not sales)? A rising rental-DOM trend means longer vacancies and softer asking-rent achievability than the comps imply.
- What's the recent tenant-quality profile in this submarket — average credit score on applications, eviction rate, late-payment / NSF rate, and stable-employment percentage? A property-management company in the area should have these aggregated.
- How much new for-sale + rental construction is in the pipeline within 1–3 miles? Heavy new supply typically softens prices + rents 12–24 months out; constrained supply supports both.
Investment metrics
- 1% rule
- 1.01% ✓
- Cap rate
- 8.41%
- Cash-on-cash
- 7.55%
- DSCR
- 1.34
- GRM
- 8.2
CMA / ARV
- ARV (median comp)
- $349,670
- List price
- $246,900
- Delta
- -26.57%
- Verdict
- UNDERPRICED
- Comps
- 5 within 1.0 mi
Show comp detail 4 sales within ~0.75 mi
| Address | Dist | Beds/Ba | Sqft | Sold | Price | $/sf | Match |
|---|---|---|---|---|---|---|---|
| 9844 Banderilla Dr | 0.60mi | 3/3.0 (+1) | 1,547 (+1%) | 0mo | $340,000 | $220 | 61 |
| 9539-9539 Paraiso | 0.73mi | 3/2.0 (+1) | 1,603 (+4%) | 8mo | $442,000 | $276 | 48 |
| 9573 Dolorosa St | 0.60mi | 3/2.0 (+1) | 1,510 (-2%) | 23mo | $339,000 | $225 | 46 |
| 9791 Villarreal | 0.59mi | 3/2.0 (+1) | 1,386 (-10%) | 13mo | $312,000 | $225 | 40 |
Match score weights: distance 35% · size 25% · config 20% · recency 20%. Top-matched comps best support the ARV.
Projected returns pro-forma
1.58% appreciation · 3.0% rent growth · sell at horizon
- IRR
- 10.8%
- Equity multiple
- 1.57×
- Total profit
- $39,342
- Equity at exit
- $91,819
- IRR
- 14.1%
- Equity multiple
- 2.81×
- Total profit
- $124,974
- Equity at exit
- $128,073
Cash invested: $69,132 (down + closing). Projections, not guarantees.
Landlord ↔ Tenant lean methodology
- Overall (STATE)
- 18 Strongly Tenant-Friendly
- State California
- 18 Strongly Tenant-Friendly · D+13
- County
- — inherits STATE
- City
- — inherits STATE
ZIP-level market 95329
- Home prices YoY
- 1.0%
- Active inventory
- 111
- Price-to-rent
- 8.2×
Monthly cashflow live
- Estimated rent
- $2,500 medium interval (Pro) →
- Mortgage (P&I)
- −$1,295
- Tax from tax record
- −$130 /mo · $1,564/yr
- Insurance
- −$103
- HOA
- −$12
- Vacancy / Maint / Mgmt
- −$525
- Net cashflow
- $435
Break-even live
UW: 25.0% down · 7.5% · 30yr · 1.5% tax · 5.0% vac · 8.0% maint · 8.0% mgmt
Financing live
Cash to close
- Down payment
- $61,725
- Closing costs
- $7,407
- Reserves months
- —
- Total cash needed
- —
Loan-product check · same deal, 3 products live
Conventional
25% down · 7.5% · 30yr
- Down + closing
- —
- Monthly P&I
- —
- Monthly cashflow
- —
- DSCR
- —
- Eligible?
- —
Personal DTI + credit; lowest rate.
DSCR
20% down · 8.5% · 30yr
- Down + closing
- —
- Monthly P&I
- —
- Monthly cashflow
- —
- DSCR
- —
- Eligible?
- —
No personal income docs; deal must DSCR.
Hard money
10% down · 12.0% · 12mo
- Down + closing
- —
- Monthly P&I
- —
- Monthly cashflow
- —
- DSCR
- —
- Eligible?
- —
Short-term bridge; refi at stabilization.
Rent comps 1 comps
| Address | Beds | Baths | Sqft | Rent | $/sqft | DOM | Units | Dist |
|---|---|---|---|---|---|---|---|---|
| 14575 Avenida Central La Grange, CA | 3.0 | 2.0 | 1982 | $2,500 | $1.26 | 13d | 1 | 0.97mi |
HOA detail
- Monthly dues
- $12 · $144/yr
- Likely covers
- poolgym
Listing history 18 events
-
2026-06-19pricedays on market $246,900 Active 244 DOM
-
2026-06-18days on market $256,750 Active 243 DOM
-
2026-06-17days on market $256,750 Active 242 DOM
-
2026-06-16days on market $256,750 Active 241 DOM
-
2026-06-15days on market $256,750 Active 240 DOM
-
2026-06-14remarks 536-char remark
-
2026-06-14days on market $256,750 Active 238 DOM
-
2026-06-13days on market $256,750 Active 237 DOM
-
2026-06-10days on market $256,750 Active 235 DOM
-
2026-06-09days on market $256,750 Active 234 DOM
-
2026-06-08days on market $256,750 Active 233 DOM
-
2026-06-07days on market $256,750 Active 232 DOM
-
2026-06-05days on market $256,750 Active 229 DOM
-
2026-06-03days on market $256,750 Active 228 DOM
-
2026-06-02days on market $256,750 Active 227 DOM
-
2026-06-01days on market $256,750 Active 226 DOM
-
2026-05-31days on market $256,750 Active 225 DOM
-
2026-05-30days on market $256,750 Active 224 DOM
ⓘ Source: listings_history table (triggers on properties + properties_extension) + one-shot
backfill from property_details.listing_events for pre-trigger history.
Tax reassessment forecast CA · Resets to sale price
- Current annual tax
- $1,564 · $130/mo
- Projected year-2 tax
- $1,876 · $156/mo
- Expected delta
- +$313/yr (+$26/mo · 20.0%)
ⓘ Screening estimate from a state-policy table — verify with the county assessor before closing.
Climate risk First Street
- Flood 1/10 Low FEMA zone X (unshaded) · 0% chance over 30 yrs
- Wildfire 5/10 Major
- Heat 7/10 Severe 6 d/yr ≥105°F today · 15 d/yr by 30 yrs out
- Wind 1/10 Low
- Air quality 10/10 Extreme 35 unhealthy d/yr today · 44 by 30 yrs out
Nearby sold comps map
Loading sold comps map…
Walkable amenities ~0.75 mi
Loading nearby amenities…
Taxation est. · year 1
- Rental income
- $30,000
- − Mortgage interest
- −$13,830
- − Property taxes
- −$1,564
- − Insurance
- −$1,234
- − Repairs & maintenance
- −$2,400
- − Management
- −$2,400
- − HOA
- −$144
- − Depreciation
- −$7,183
- Taxable income
- $1,245
- Est. tax owed @ 24.0%
- −$299
- After-tax cash flow
- $4,922/yr
For passive investors: Depreciation is non-cash, so a rental often shows a tax loss while cash-flowing — sheltering income. Rental losses are passive: they offset passive income freely, and up to $25,000/yr can offset ordinary (W-2) income if you actively participate and your MAGI is under $100k (phasing out to $0 by $150k); unused losses carry forward. On sale, claimed depreciation is recaptured at up to 25%, and gains may owe capital-gains tax (a 1031 exchange can defer both). Figures are a year-1 estimate at your 24.0% rate — not tax advice; consult a CPA.
Schools (NCES district)
- District
- Mariposa County Unified
- NCES district ID
- 0623940
- Math proficiency
- 27% ▼ -12.00%
- Reading proficiency
- 42% ▼ -5.00%
- Median HH income
- $48,669
- Composite
- 29.75/100
- National rank
- #6438
- State rank
- #282 of 517 in CA
Livability — Lake Don Pedro
- Score
- 55/100
- State rank
- #867
- US rank
- #23601
Category grades
Schools grade is shown separately in the Schools card above.
Census & demographics
- Census place
- Lake Don Pedro, CA
- Population (ZIP)
- 2,339
Population outlook (Mariposa County) Hauer SSP2
- Today (2025)
- 15,956 people
- By 2030
- 15,078 · -5.5%
- By 2040
- 13,413 · -15.9%
- By 2050
- 12,232 · -23.3%
- By 2075
- 11,143 · -30.2%
- By 2100
- 10,187 · -36.2%
Race, ethnicity, and origin ACS 2023
- Neighborhood character
- Predominantly White (68%)
- Race & ethnicity
- White 68% Hispanic / Latino 21% Two or more races 15% Black 2% Native American 1%
- Hispanic origin (detail)
- Mexican 13%
- Common ancestry
- Italian 5% Iranian 5% Lithuanian 4%
- Foreign-born
- 7% · Canada, Dominican Republic, China
- Languages at home
- 91% English-only · Spanish 8% French/Haitian/Cajun 1%
Political lean MEDSL · Mariposa
- 2024 margin
- Strong R (+21.1) · D 38.1% · R 59.1% · Other 2.8%
- 2008→2024 swing
- -8.6pp toward R · 2008: -12.4pp · 2024: -21.1pp
- All cycles
- 2024: R+21.1 2020: R+18.1 2016: R+23.2 2012: R+17.4 2008: R+12.4
Not yet ingested
- Civics
- —
Market trends
- HPI YoY
- ▲ 1.58%
- Current HPI
- 163.9206
- Rent YoY
- —
- Metro
- —
- State GDP YoY
- ▲ 3.21%
- F500 in state
- 116
Industry mix (Fortune 500 HQ in CA)
| Industry | F500 HQs | Revenue |
|---|---|---|
| Technology | 27 | $1,492B |
|
||
| Financial Services | 3 | $174B |
|
||
| Retail | 3 | $44B |
|
||
| Insurance | 3 | $26B |
|
||
| Media / Entertainment | 2 | $115B |
|
||
| Pharmaceuticals / Biotech | 2 | $62B |
|
||
Property tax history
+2.8%/yrLatest (2025): $1,564 · +1.2% YoY. Source: county tax records.
Cash-flow waterfall
monthlySold comps — $/sqft
last 12 mo · ≤1 miLoading sold comps…