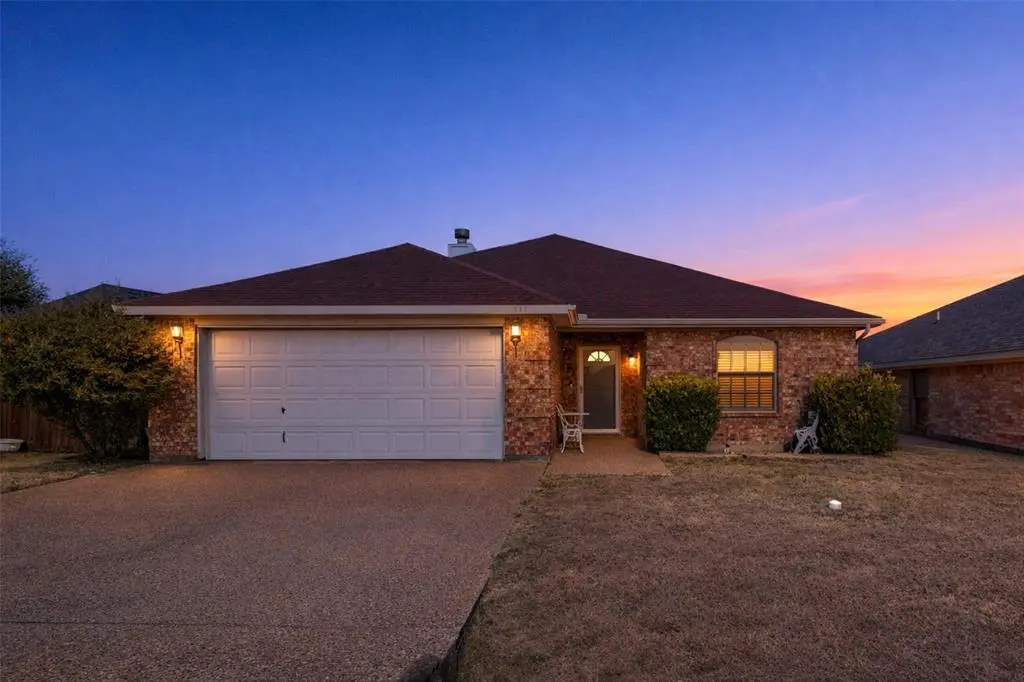
717 Rambling Ct · Granbury, TX
Flood risk 1/10 · Minimal
- FEMA flood zone
- X (unshaded)
- Chance of flooding over 30 yrs
- 0.0%
- Est. flood insurance / yr
- $507 – $1,088
Fire risk 5/10 · Moderate
- Est. fire insurance / yr
- $1,222 – $2,270
Heat risk 7/10 · Major
- Hot days now (above 108°F)
- 7 days/yr
- Hot days in 30 yrs
- 24 days/yr
Wind risk 6/10 · Moderate
- Chance of severe wind over 30 yrs
- 27.0%
Air-quality risk 2/10 · Minimal
- Unhealthy air days now
- 1 days/yr
- Unhealthy air days in 30 yrs
- 2 days/yr
Risk factors via First Street. Map © Google.
Why this score? — see what drove the C- grade
The composite is a weighted blend of 9 inputs, each scored 0–100. Each bar is that input's sub-score; the figure is the points it added to the 100-point composite (weight × sub-score).
- Cash flow +16.6/30.0
- ARV discount +15.0/15.0
- DSCR +5.1/10.0
- 1% rule +4.2/10.0
- Schools +4.0/10.0
- Rent growth +3.8/5.0
- Livability +3.3/5.0
- Condition / age +2.5/5.0
- Appreciation +0.0/10.0
$250,000
🖨 Deal sheet 📄 Offer letter ✓ Due diligence
Listing remarks MLS
Back on the market at no fault of the seller. Welcome home to this 3-bedroom, 2-bath residence located in the desirable Meander neighborhood of Granbury. Nestled on a quiet court, this home offers a great location with easy access to shopping, dining, schools, and Lake Granbury. Enjoy a stroll to the community park and have a picnic with the family. The functional floor plan features comfortable living spaces, a spacious primary suite, and a two-car garage for added convenience. Whether you’re looking for a primary residence or an investment opportunity, this home delivers both comfort and location in a sought-after area.
Key facts
- 5,663 sq ft lot
- 2 garage spots
- Community pool
Neighborhood map
What this means for you Summary
Snapshot
- This is a 3-bed/2.0-bath single-family listed at $250k.
Deal economics
- At list price, monthly cash flow is $149 ($2k/yr) — positive.
- The deal already cash-flows at list — no discount required.
- To meet the 1% rule (rent ≥ 1% of price), the offer needs to be $230k (8.0% below list).
- Recommended offer: $228k (9.0% below list) — sets the bar for market timing.
- Cap rate 7.0% vs local median 3.8% in Granbury — top-decile yield for the area; either an underpriced asset or a hidden risk that comps aren't pricing in. Stress-test before assuming the spread holds.
Location & tenants
- Location reads 66/100 on livability (#628 in TX) — a middle-class / working-renter tenant base. Strengths: cost of living A+, housing A+, health & safety A+; Watch: employment C-, crime D+, schools D.
- Granbury ISD (town): math 46% / reading 46% proficiency, ranked #237 of 826 in TX (top 29%) — families likely to look elsewhere, expect single-tenant / working-renter base with shorter leases.
- Market conditions: Rents rising fast (+5.2%/yr); 690 active listings in the ZIP; 8 comparable units currently listed for rent nearby; rentals lingering (median 44d on market — plan ~5-8 weeks vacancy on turnover, expect pricing pressure); 75% of comp listings sitting > 30 days — soft ceiling on asking rent; solid renter incomes; 125 units permitted in Hood County in 2024 (0 in 5+ unit buildings).
Forward outlook
- Local home prices are declining (-3.0%/yr); year-one equity from $2k of loan paydown is wiped out by about $8k of value loss. Plan a longer hold.
- Hood County population projected at +29% by 2050 — long-run rental-demand tailwind backs the buy-and-hold thesis.
Negotiation context
- It's been on market 107 days — a 9% lower offer ($228k) is reasonable based on typical stale-listing flexibility.
- 3 sale attempts since 11y ago with the ask held roughly flat each time — persistent listings suggest the price (not the market) is what's stuck; bring a comps-based counter.
Risks & watch-outs
- Climate carrying-cost: major wind risk, 27% chance of damaging wind over 30y; moderate wildfire risk; extreme-heat days projected 7→24/yr by 2055 (HVAC capex compounding) — expect insurance premiums to compound above CPI over the hold.
Questions for the listing agent
- It's been on market 107 days. Have you received any prior offers? Is the seller open to a 9% concession, seller financing, or rate buy-down credit?
- What does the HOA fee cover, when was the last increase, and are there any pending special assessments or reserve-fund shortfalls?
- Why hasn't it sold? Are there any deal-killer items the seller is aware of (foundation, flood, title, zoning, code violations)?
- Is there a deadline driving the sale (1031 exchange, divorce, estate, relocation)? That informs how much negotiation room exists.
- Schools are D-rated, which usually means shorter tenancies and higher turnover. Who's the typical renter profile here, and what's been the actual vacancy rate?
- Crime grade is D in this area — have there been break-ins, vandalism, or insurance claims at this property in the last 3 years? What carrier currently insures it and at what premium?
- What's the average days-on-market for RENTAL listings here right now (not sales)? A rising rental-DOM trend means longer vacancies and softer asking-rent achievability than the comps imply.
- What's the recent tenant-quality profile in this submarket — average credit score on applications, eviction rate, late-payment / NSF rate, and stable-employment percentage? A property-management company in the area should have these aggregated.
- How much new for-sale + rental construction is in the pipeline within 1–3 miles? Heavy new supply typically softens prices + rents 12–24 months out; constrained supply supports both.
Investment metrics
- 1% rule
- 0.92% ✗
- Cap rate
- 7.01%
- Cash-on-cash
- 2.55%
- DSCR
- 1.11
- GRM
- 9.1
CMA / ARV
- ARV (median comp)
- $309,902
- List price
- $250,000
- Delta
- -19.33%
- Verdict
- UNDERPRICED
- Comps
- 20 within 1.0 mi
Show comp detail 3 sales within ~0.75 mi
| Address | Dist | Beds/Ba | Sqft | Sold | Price | $/sf | Match |
|---|---|---|---|---|---|---|---|
| 717 Rambling Ct | 0.00mi | 3/2.0 | 1,384 (0%) | 0mo | $250,000 | $181 | 100 |
| 917 Charles Ct | 0.74mi | 3/2.0 | 1,326 (-4%) | 10mo | $235,000 | $177 | 50 |
| 913 Charles Ct | 0.75mi | 3/2.0 | 1,566 (+13%) | 11mo | $323,000 | $206 | 34 |
Match score weights: distance 35% · size 25% · config 20% · recency 20%. Top-matched comps best support the ARV.
Projected returns pro-forma
-3.0% appreciation · 5.2% rent growth · sell at horizon
- IRR
- -9.9%
- Equity multiple
- 0.63×
- Total profit
- $-25,816
- Equity at exit
- $37,276
- IRR
- 2.2%
- Equity multiple
- 1.17×
- Total profit
- $12,077
- Equity at exit
- $21,615
Cash invested: $70,000 (down + closing). Projections, not guarantees.
Landlord ↔ Tenant lean methodology
- Overall (STATE)
- 87 Strongly Landlord-Friendly
- State Texas
- 87 Strongly Landlord-Friendly · R+5
- County
- — inherits STATE
- City
- — inherits STATE
ZIP-level market 76049
- Home prices YoY
- -26.8%
- Rents YoY
- 5.2%
- Active inventory
- 690
- Price-to-rent
- 9.1×
Monthly cashflow live
- Estimated rent
- $2,301 high interval (Pro) →
- Mortgage (P&I)
- −$1,311
- Tax from tax record
- −$240 /mo · $2,884/yr
- Insurance
- −$104
- HOA
- −$13
- Vacancy / Maint / Mgmt
- −$483
- Net cashflow
- $149
Break-even live
UW: 25.0% down · 7.5% · 30yr · 1.5% tax · 5.0% vac · 8.0% maint · 8.0% mgmt
Financing live
Cash to close
- Down payment
- $62,500
- Closing costs
- $7,500
- Reserves months
- —
- Total cash needed
- —
Loan-product check · same deal, 3 products live
Conventional
25% down · 7.5% · 30yr
- Down + closing
- —
- Monthly P&I
- —
- Monthly cashflow
- —
- DSCR
- —
- Eligible?
- —
Personal DTI + credit; lowest rate.
DSCR
20% down · 8.5% · 30yr
- Down + closing
- —
- Monthly P&I
- —
- Monthly cashflow
- —
- DSCR
- —
- Eligible?
- —
No personal income docs; deal must DSCR.
Hard money
10% down · 12.0% · 12mo
- Down + closing
- —
- Monthly P&I
- —
- Monthly cashflow
- —
- DSCR
- —
- Eligible?
- —
Short-term bridge; refi at stabilization.
Rent comps 8 comps
| Address | Beds | Baths | Sqft | Rent | $/sqft | DOM | Units | Dist |
|---|---|---|---|---|---|---|---|---|
| 3002 Promenade Dr Granbury, TX | 3.0 | 2.0 | 1858 | $2,400 | $1.29 | 7d | 1 | 0.34mi |
| 3009 Meandering Way Granbury, TX | 4.0 | 2.0 | 1750 | $2,200 | $1.26 | 17d | 1 | 0.49mi |
| 902 Twine St Granbury, TX | 3.0 | 2.0 | 1577 | $1,695 | $1.07 | 43d | 1 | 0.59mi |
| 306 Shady Grove Dr Unit 103 Granbury, TX | 2.0 | 2.0 | 1000 | $1,300 | $1.30 | 43d | 1 | 1.14mi |
| 409 Cleveland Rd Granbury, TX | 2.0 | 2.0 | 1049 | $1,800 | $1.72 | 43d | 1 | 1.25mi |
| 107 Donna Cir Granbury, TX | 3.0 | 2.0 | 1735 | $2,400 | $1.38 | 43d | 1 | 1.25mi |
| 106 Cardinal Woods Ct Granbury, TX | 2.0 | 2.0 | 1600 | $3,650 | $2.28 | 43d | 1 | 1.28mi |
| 102 Cardinal Woods Ct Granbury, TX | 2.0 | 2.0 | 1620 | $3,650 | $2.25 | 43d | 1 | 1.28mi |
HOA detail
- Monthly dues
- $13 · $156/yr
Listing history 12 events
-
2026-05-31status $250,000 Pending 107 DOM
-
2026-05-14status Active 635-char remark
Show marketing remark (635 chars)
Back on the market at no fault of the seller. Welcome home to this 3-bedroom, 2-bath residence located in the desirable Meander neighborhood of Granbury. Nestled on a quiet court, this home offers a great location with easy access to shopping, dining, schools, and Lake Granbury. Enjoy a stroll to the community park and have a picnic with the family. The functional floor plan features comfortable living spaces, a spacious primary suite, and a two-car garage for added convenience. Whether you’re looking for a primary residence or an investment opportunity, this home delivers both comfort and location in a sought-after area.
-
2026-04-21historical Active Option Contract 635-char remark
Show marketing remark (635 chars)
Back on the market at no fault of the seller. Welcome home to this 3-bedroom, 2-bath residence located in the desirable Meander neighborhood of Granbury. Nestled on a quiet court, this home offers a great location with easy access to shopping, dining, schools, and Lake Granbury. Enjoy a stroll to the community park and have a picnic with the family. The functional floor plan features comfortable living spaces, a spacious primary suite, and a two-car garage for added convenience. Whether you’re looking for a primary residence or an investment opportunity, this home delivers both comfort and location in a sought-after area.
-
2026-02-12$250,000 Active 635-char remark
Show marketing remark (635 chars)
Back on the market at no fault of the seller. Welcome home to this 3-bedroom, 2-bath residence located in the desirable Meander neighborhood of Granbury. Nestled on a quiet court, this home offers a great location with easy access to shopping, dining, schools, and Lake Granbury. Enjoy a stroll to the community park and have a picnic with the family. The functional floor plan features comfortable living spaces, a spacious primary suite, and a two-car garage for added convenience. Whether you’re looking for a primary residence or an investment opportunity, this home delivers both comfort and location in a sought-after area.
-
2015-12-01soldstatus
-
2015-11-30soldstatus Sold 212-char remark
Show marketing remark (212 chars)
Beautiful home on FTW side of Granbury. Nice wood floors in living area with vaulted ceilings. Open concept living area and kitchen. Split bedrooms. Large master bedroom. Cover patio in back yard with wood fence.
-
2015-11-05status Pending 212-char remark
Show marketing remark (212 chars)
Beautiful home on FTW side of Granbury. Nice wood floors in living area with vaulted ceilings. Open concept living area and kitchen. Split bedrooms. Large master bedroom. Cover patio in back yard with wood fence.
-
2015-10-26historical Active Option Contract 212-char remark
Show marketing remark (212 chars)
Beautiful home on FTW side of Granbury. Nice wood floors in living area with vaulted ceilings. Open concept living area and kitchen. Split bedrooms. Large master bedroom. Cover patio in back yard with wood fence.
-
2015-10-13price $140,000 212-char remark
Show marketing remark (212 chars)
Beautiful home on FTW side of Granbury. Nice wood floors in living area with vaulted ceilings. Open concept living area and kitchen. Split bedrooms. Large master bedroom. Cover patio in back yard with wood fence.
-
2015-10-05$145,000 Active 212-char remark
Show marketing remark (212 chars)
Beautiful home on FTW side of Granbury. Nice wood floors in living area with vaulted ceilings. Open concept living area and kitchen. Split bedrooms. Large master bedroom. Cover patio in back yard with wood fence.
-
2004-12-01soldstatus
-
2004-12-01soldstatus
ⓘ Source: listings_history table (triggers on properties + properties_extension) + one-shot
backfill from property_details.listing_events for pre-trigger history.
Tax reassessment forecast TX · Resets to sale price
- Current annual tax
- $2,884 · $240/mo
- Projected year-2 tax
- $4,575 · $381/mo
- Expected delta
- +$1,691/yr (+$141/mo · 58.6%)
ⓘ Screening estimate from a state-policy table — verify with the county assessor before closing.
Climate risk First Street
- Flood 1/10 Low FEMA zone X (unshaded) · 0% chance over 30 yrs
- Wildfire 5/10 Major
- Heat 7/10 Severe 7 d/yr ≥108°F today · 24 d/yr by 30 yrs out
- Wind 6/10 Major 27% chance of damaging wind over 30 yrs
- Air quality 2/10 Low 1 unhealthy d/yr today · 2 by 30 yrs out
Nearby sold comps map
Loading sold comps map…
Walkable amenities ~0.75 mi
Loading nearby amenities…
Taxation est. · year 1
- Rental income
- $27,609
- − Mortgage interest
- −$14,004
- − Property taxes
- −$2,884
- − Insurance
- −$1,250
- − Repairs & maintenance
- −$2,209
- − Management
- −$2,209
- − HOA
- −$156
- − Depreciation
- −$7,273
- Taxable loss
- −$2,375
- Est. tax savings @ 24.0%
- +$570
- After-tax cash flow
- $2,359/yr
For passive investors: Depreciation is non-cash, so a rental often shows a tax loss while cash-flowing — sheltering income. Rental losses are passive: they offset passive income freely, and up to $25,000/yr can offset ordinary (W-2) income if you actively participate and your MAGI is under $100k (phasing out to $0 by $150k); unused losses carry forward. On sale, claimed depreciation is recaptured at up to 25%, and gains may owe capital-gains tax (a 1031 exchange can defer both). Figures are a year-1 estimate at your 24.0% rate — not tax advice; consult a CPA.
Schools (NCES district)
- District
- Granbury ISD
- NCES district ID
- 4821390
- Math proficiency
- 46% ▬ 0.00%
- Reading proficiency
- 46% ▲ 4.00%
- Median HH income
- $55,856
- Composite
- 40.04/100
- National rank
- #3820
- State rank
- #237 of 826 in TX
Livability — Granbury
- Score
- 66/100
- State rank
- #628
- US rank
- #11998
Category grades
Schools grade is shown separately in the Schools card above.
Census & demographics
- County
- Hood County · 58,506 people
- City population
- 58,506
- Metro
- Granbury, TX
- Population (ZIP)
- 31,506
- Household income
- $104,967
- Rent vs Own
- Severe rent burden
- 235.0
Population outlook (Hood County) Hauer SSP2
- Today (2025)
- 63,502 people
- By 2030
- 67,459 · +6.2%
- By 2040
- 74,958 · +18.0%
- By 2050
- 81,922 · +29.0%
- By 2075
- 98,872 · +55.7%
- By 2100
- 107,796 · +69.8%
Race, ethnicity, and origin ACS 2023
- Neighborhood character
- Predominantly White (82%)
- Race & ethnicity
- White 82% Hispanic / Latino 14% Two or more races 9%
- Hispanic origin (detail)
- Mexican 11%
- Common ancestry
- Slovak 3% Serbian 2% Italian 2%
- Foreign-born
- 5% · Canada
- Languages at home
- 91% English-only · Spanish 8%
Political lean MEDSL · Hood
- 2024 margin
- Solid R (+66.0) · D 16.6% · R 82.6%
- 2008→2024 swing
- -11.9pp toward R · 2008: -54.0pp · 2024: -66.0pp
- All cycles
- 2024: R+66.0 2020: R+64.1 2016: R+66.5 2012: R+64.7 2008: R+54.0
Not yet ingested
- Civics
- —
Market trends
- HPI YoY
- ▼ -100.09%
- Current HPI
- 273.1293
- Rent YoY
- ▲ 5.20%
- Metro
- Granbury, TX
- State GDP YoY
- ▲ 3.95%
- F500 in state
- 110
Industry mix (Fortune 500 HQ in TX)
| Industry | F500 HQs | Revenue |
|---|---|---|
| Energy | 16 | $1,198B |
|
||
| Technology | 5 | $198B |
|
||
| Engineering / Construction | 4 | $72B |
|
||
| Energy Services | 3 | $60B |
|
||
| Utilities | 3 | $41B |
|
||
| Healthcare | 2 | $330B |
|
||
Price history
+72.4% since first listed11 events — show timeline
- 2026-05-14 Relisted — NTREIS
- 2026-04-21 Contingent — NTREIS
- 2026-02-12 Listed $250,000 NTREIS
- 2015-12-01 Sold (Public Records) — Public Records
- 2015-11-30 Sold (MLS) — NTREIS
- 2015-11-05 Pending — NTREIS
- 2015-10-26 Contingent — NTREIS
- 2015-10-13 Price Changed $140,000 NTREIS
- 2015-10-05 Listed $145,000 NTREIS
- 2004-12-01 Sold (Public Records) — Public Records
- 2004-12-01 Sold (Public Records) — Public Records
Property tax history
+3.8%/yrLatest (2025): $2,884 · +2.2% YoY. Source: county tax records.
Cash-flow waterfall
monthlySold comps — $/sqft
last 12 mo · ≤1 miLoading sold comps…