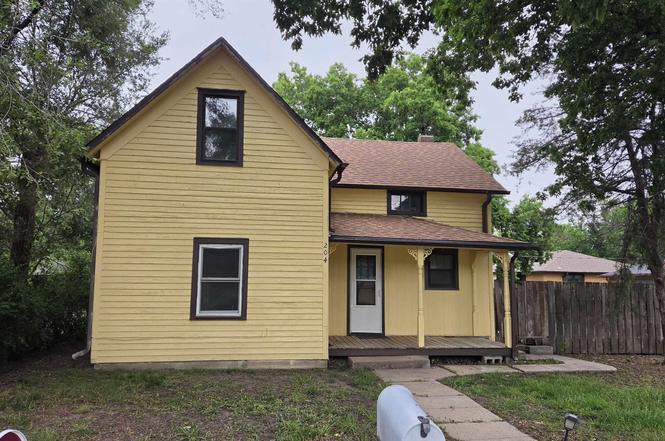
204 E Concord Ave · Holyrood, KS
Flood risk 1/10 · Minimal
- FEMA flood zone
- X (unshaded)
- Chance of flooding over 30 yrs
- 0.0%
- Est. flood insurance / yr
- $473 – $860
Fire risk 4/10 · Minor
- Est. fire insurance / yr
- $1,154 – $2,142
Heat risk 5/10 · Moderate
- Hot days now (above 105°F)
- 7 days/yr
- Hot days in 30 yrs
- 17 days/yr
Wind risk 2/10 · Minimal
- Chance of severe wind over 30 yrs
- —
Air-quality risk 2/10 · Minimal
- Unhealthy air days now
- 1 days/yr
- Unhealthy air days in 30 yrs
- 1 days/yr
Risk factors via First Street. Map © Google.
Why this score? — see what drove the B+ grade
The composite is a weighted blend of 9 inputs, each scored 0–100. Each bar is that input's sub-score; the figure is the points it added to the 100-point composite (weight × sub-score).
- Cash flow +30.0/30.0
- 1% rule +10.0/10.0
- DSCR +10.0/10.0
- ARV discount +7.5/15.0
- Schools +5.0/10.0
- Appreciation +4.9/10.0
- Livability +3.5/5.0
- Rent growth +2.5/5.0
- Condition / age +2.5/5.0
$62,000
🖨 Deal sheet 📄 Offer letter ✓ Due diligence
Key facts
- Functional kitchen
- Versatile layout
- Outdoor deck
Tags
Property features AI
Finance
- Financial info: Annual property tax listed
- HOA & community: Community playground
Exterior
- Parking: Detached or attached 2-car garage (2 parking spaces total)
- Utilities: Public water; Public sewer
- Home design: Single-family residence; Residential property
- Construction: Wood siding; Composition roof; Partial basement
- Exterior features: Covered deck; Partial wood and wire fencing; Paved road access; Composition roof
Interior
- Kitchen: Electric range; Refrigerator; Range hood
- Bedrooms: One bedroom on the main level
- Flooring: Wood flooring
- Bathrooms: One full bathroom (main level)
- Heating & cooling: Natural gas heating; Central air conditioning; Ceiling fans; Electric cooling components
- Interior features: Electric range, refrigerator, range hood; Wood flooring; Partial basement
- Laundry & utility: Laundry located on the lower level
Neighborhood map
What this means for you Summary
Snapshot
- This is a 3-bed/1.0-bath single-family listed at $62k.
Deal economics
- At list price, monthly cash flow is $403 ($5k/yr) — positive.
- The deal already cash-flows at list — no discount required.
- Meets the 1% rule at list price ($1k rent vs $62k).
- Recommended offer: $56k (9.0% below list) — sets the bar for market timing.
Location & tenants
- Location reads 69/100 on livability (#191 in KS) — a middle-class / working-renter tenant base. Strengths: employment A+, cost of living A+, housing A+; Watch: crime F, amenities F, commute F.
- Zoned schools: Central Plains Elementary School - Holyrood (math 57% / reading 62%, grade B-, #70 of 684 statewide, top 12%, 224 students, 46% FRL).
- Market conditions: 1 active listings in the ZIP; 2 units permitted in Ellsworth County in 2024 (0 in 5+ unit buildings).
Forward outlook
- In year one you build about $340 of equity ($429 loan paydown + $-89 appreciation (-0.1% local appreciation)).
- At projected returns (-0.1% appreciation + 3.0% rent growth), your $17k cash investment doubles in ~4 years — after that, you're playing with house money.
Negotiation context
- It's been on market 110 days — a 9% lower offer ($56k) is reasonable based on typical stale-listing flexibility.
- 3 sale attempts since 15y ago; this cycle's ask has dropped $4k (6%) from the opening price — seller is motivated, your offer sets the floor, not the list.
Risks & watch-outs
- Watch-outs: built in 1918 — expect roof / HVAC / electrical / plumbing capex.
- Climate carrying-cost: extreme-heat days projected 7→17/yr by 2055 (HVAC capex compounding) — expect insurance premiums to compound above CPI over the hold.
Questions for the listing agent
- It's been on market 110 days. Have you received any prior offers? Is the seller open to a 9% concession, seller financing, or rate buy-down credit?
- Built in 1918 — when were the roof, HVAC, electrical panel, plumbing, and water heater last replaced?
- Why hasn't it sold? Are there any deal-killer items the seller is aware of (foundation, flood, title, zoning, code violations)?
- Is there a deadline driving the sale (1031 exchange, divorce, estate, relocation)? That informs how much negotiation room exists.
- Schools are B-rated — typically a magnet for longer-tenancy family renters. What's the average tenant stay here, and is there a school-zone premium baked into asking?
- Crime grade is F in this area — have there been break-ins, vandalism, or insurance claims at this property in the last 3 years? What carrier currently insures it and at what premium?
- What's the average days-on-market for RENTAL listings here right now (not sales)? A rising rental-DOM trend means longer vacancies and softer asking-rent achievability than the comps imply.
- What's the recent tenant-quality profile in this submarket — average credit score on applications, eviction rate, late-payment / NSF rate, and stable-employment percentage? A property-management company in the area should have these aggregated.
- How much new for-sale + rental construction is in the pipeline within 1–3 miles? Heavy new supply typically softens prices + rents 12–24 months out; constrained supply supports both.
Investment metrics
- 1% rule
- 1.70% ✓
- Cap rate
- 14.09%
- Cash-on-cash
- 27.84%
- DSCR
- 2.24
- GRM
- 4.9
CMA / ARV
No comps found within radius.
Projected returns pro-forma
-0.14% appreciation · 3.0% rent growth · sell at horizon
- IRR
- 27.9%
- Equity multiple
- 2.35×
- Total profit
- $23,440
- Equity at exit
- $17,559
- IRR
- 31.9%
- Equity multiple
- 4.52×
- Total profit
- $61,176
- Equity at exit
- $20,755
Cash invested: $17,360 (down + closing). Projections, not guarantees.
Landlord ↔ Tenant lean methodology
- Overall (STATE)
- 83 Strongly Landlord-Friendly
- State Kansas
- 83 Strongly Landlord-Friendly · R+10
- County
- — inherits STATE
- City
- — inherits STATE
ZIP-level market 67450
- Home prices YoY
- -0.1%
- Active inventory
- 1
- Price-to-rent
- 4.9×
Monthly cashflow live
- Estimated rent
- $1,052 medium interval (Pro) →
- Mortgage (P&I)
- −$325
- Tax est. 1.5%
- −$78 /mo · $930/yr
- Insurance
- −$26
- HOA
- −$0
- Vacancy / Maint / Mgmt
- −$221
- Net cashflow
- $403
Break-even live
UW: 25.0% down · 7.5% · 30yr · 1.5% tax · 5.0% vac · 8.0% maint · 8.0% mgmt
Financing live
Cash to close
- Down payment
- $15,500
- Closing costs
- $1,860
- Reserves months
- —
- Total cash needed
- —
Loan-product check · same deal, 3 products live
Conventional
25% down · 7.5% · 30yr
- Down + closing
- —
- Monthly P&I
- —
- Monthly cashflow
- —
- DSCR
- —
- Eligible?
- —
Personal DTI + credit; lowest rate.
DSCR
20% down · 8.5% · 30yr
- Down + closing
- —
- Monthly P&I
- —
- Monthly cashflow
- —
- DSCR
- —
- Eligible?
- —
No personal income docs; deal must DSCR.
Hard money
10% down · 12.0% · 12mo
- Down + closing
- —
- Monthly P&I
- —
- Monthly cashflow
- —
- DSCR
- —
- Eligible?
- —
Short-term bridge; refi at stabilization.
Listing history 22 events
-
2026-06-18days on market $62,000 Active 110 DOM
-
2026-06-17days on market $62,000 Active 109 DOM
-
2026-06-16days on market $62,000 Active 108 DOM
-
2026-06-15days on market $62,000 Active 107 DOM
-
2026-06-13pricedays on market $62,000 Active 105 DOM
-
2026-06-12days on market $63,400 Active 104 DOM
-
2026-06-09days on market $63,400 Active 101 DOM
-
2026-06-08days on market $63,400 Active 100 DOM
-
2026-06-07days on market $63,400 Active 99 DOM
-
2026-06-05days on market $63,400 Active 97 DOM
-
2026-06-04days on market $63,400 Active 95 DOM
-
2026-06-02days on market $63,400 Active 94 DOM
-
2026-06-01days on market $63,400 Active 93 DOM
-
2026-05-31days on market $63,400 Active 92 DOM
-
2026-05-31days on market $63,400 Active 91 DOM
-
2026-05-18status Pending
-
2026-04-20price $63,400
-
2026-02-18$65,900 Active
-
2017-11-30historical
-
2016-12-14$38,500
-
2012-05-31historical
-
2011-11-07$38,500
ⓘ Source: listings_history table (triggers on properties + properties_extension) + one-shot
backfill from property_details.listing_events for pre-trigger history.
Climate risk First Street
- Flood 1/10 Low FEMA zone X (unshaded) · 0% chance over 30 yrs
- Wildfire 4/10 Moderate
- Heat 5/10 Major 7 d/yr ≥105°F today · 17 d/yr by 30 yrs out
- Wind 2/10 Low
- Air quality 2/10 Low 1 unhealthy d/yr today · 1 by 30 yrs out
Nearby sold comps map
Loading sold comps map…
Walkable amenities ~0.75 mi
Loading nearby amenities…
Taxation est. · year 1
- Rental income
- $12,627
- − Mortgage interest
- −$3,473
- − Property taxes
- −$930
- − Insurance
- −$310
- − Repairs & maintenance
- −$1,010
- − Management
- −$1,010
- − Depreciation
- −$1,804
- Taxable income
- $4,090
- Est. tax owed @ 24.0%
- −$982
- After-tax cash flow
- $3,852/yr
For passive investors: Depreciation is non-cash, so a rental often shows a tax loss while cash-flowing — sheltering income. Rental losses are passive: they offset passive income freely, and up to $25,000/yr can offset ordinary (W-2) income if you actively participate and your MAGI is under $100k (phasing out to $0 by $150k); unused losses carry forward. On sale, claimed depreciation is recaptured at up to 25%, and gains may owe capital-gains tax (a 1031 exchange can defer both). Figures are a year-1 estimate at your 24.0% rate — not tax advice; consult a CPA.
Schools (NCES district)
No district data.
Livability — Holyrood
- Score
- 69/100
- State rank
- #191
- US rank
- #8667
Category grades
Schools grade is shown separately in the Schools card above.
Census & demographics
- Census place
- Holyrood, KS
- Population (ZIP)
- 468
Population outlook (Ellsworth County) Hauer SSP2
- Today (2025)
- 6,172 people
- By 2030
- 6,115 · -0.9%
- By 2040
- 6,002 · -2.8%
- By 2050
- 6,064 · -1.7%
- By 2075
- 6,342 · +2.8%
- By 2100
- 6,304 · +2.1%
Race, ethnicity, and origin ACS 2023
- Neighborhood character
- Predominantly White (94%)
- Race & ethnicity
- White 94% Hispanic / Latino 2% Black 2% Native American 1%
- Common ancestry
- Slovak 4% Serbian 2% Lithuanian 1%
- Foreign-born
- 0%
- Languages at home
- 98% English-only · French/Haitian/Cajun 2% German/W. Germanic 1%
Political lean MEDSL · Ellsworth
- 2024 margin
- Solid R (+52.3) · D 23.1% · R 75.3% · Other 1.6%
- 2008→2024 swing
- -12.5pp toward R · 2008: -39.8pp · 2024: -52.3pp
- All cycles
- 2024: R+52.3 2020: R+52.0 2016: R+54.0 2012: R+45.2 2008: R+39.8
Not yet ingested
- Civics
- —
Market trends
- HPI YoY
- ▼ -0.14%
- Current HPI
- 190.3145
- Rent YoY
- —
- Metro
- —
- State GDP YoY
- —
- F500 in state
- 0
Price history
+64.7% since first listed7 events — show timeline
- 2026-05-18 Pending — MKMLS as distributed by MLS GRID
- 2026-04-20 Price Changed $63,400 MKMLS as distributed by MLS GRID
- 2026-02-18 Listed $65,900 MKMLS as distributed by MLS GRID
- 2017-11-30 Listing Removed — SCKMLS as Distributed by MLS Grid
- 2016-12-14 Listed $38,500 SCKMLS as Distributed by MLS Grid
- 2012-05-31 Listing Removed — SCKMLS as Distributed by MLS Grid
- 2011-11-07 Listed $38,500 SCKMLS as Distributed by MLS Grid
Cash-flow waterfall
monthlySold comps — $/sqft
last 12 mo · ≤1 miLoading sold comps…