443 W 151st St Unit 3C · New York, NY
Flood risk 1/10 · Minimal
- FEMA flood zone
- X (unshaded)
- Chance of flooding over 30 yrs
- 0.0%
- Est. flood insurance / yr
- $507 – $1,088
Fire risk 1/10 · Minimal
- Est. fire insurance / yr
- $691 – $1,283
Heat risk 6/10 · Moderate
- Hot days now (above 99°F)
- 7 days/yr
- Hot days in 30 yrs
- 15 days/yr
Wind risk 6/10 · Moderate
- Chance of severe wind over 30 yrs
- 27.0%
Air-quality risk 4/10 · Minor
- Unhealthy air days now
- 5 days/yr
- Unhealthy air days in 30 yrs
- 6 days/yr
Risk factors via First Street. Map © Google.
Why this score? — see what drove the D- grade
The composite is a weighted blend of 9 inputs, each scored 0–100. Each bar is that input's sub-score; the figure is the points it added to the 100-point composite (weight × sub-score).
- ARV discount +7.5/15.0
- Cash flow +7.3/30.0
- Schools +5.0/10.0
- Rent growth +4.2/5.0
- Appreciation +4.0/10.0
- Livability +3.8/5.0
- 1% rule +2.5/10.0
- Condition / age +2.5/5.0
- DSCR +1.5/10.0
$400,000
🖨 Deal sheet (PDF) 📄 Offer letter ✓ Due diligence
Listing remarks
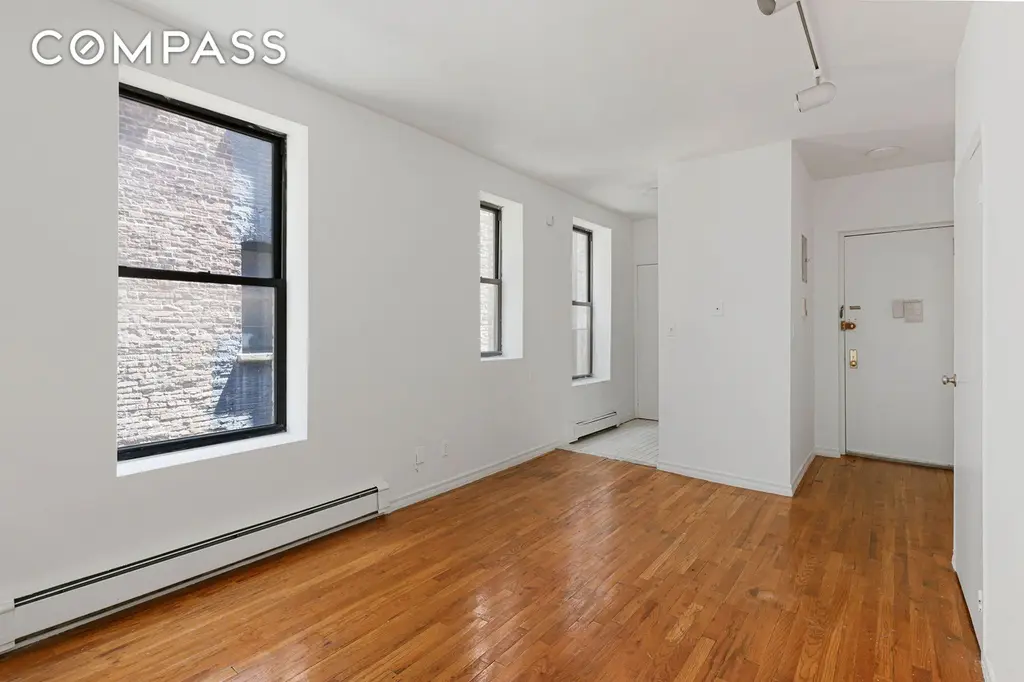
Residence 3C at 443 West 151st Street is a quiet and inviting one-bedroom condominium ideally situated in the heart of Hamilton Heights. Offering exceptionally low monthly carrying costs, this home presents an outstanding opportunity for both primary residents and investors alike. Located two flights up, the apartment features excellent natural light throughout. The corner bedroom is especially bright and airy, with windows on two exposures creating an open and comfortable atmosphere. Additional highlights include a newly installed water heater and basement laundry within the building. Conveniently located just moments from express subway lines (A, B, C, D and 1 Trains) the residence provid
Key facts
- Basement laundry
- $266 HOA
- Built 1926
Tags
Property features AI
Finance
- Other: No pets allowed in building
- HOA & community: Association fee $266 monthly
Exterior
- Home design: 5-story building; Entry at level 3
Interior
- Bedrooms: 3 total rooms
- Bathrooms: 1 full bathroom
- Interior features: Unfurnished
- Laundry & utility: Common laundry on the floor (common area)
Neighborhood map
What this means for you Summary
Snapshot
- This is a 1-bed/1.0-bath condo listed at $400k.
Deal economics
- At list price, monthly cash flow is $-528 ($-6k/yr) — negative.
- To cash-flow at today's rent, offer at most $307k (23.3% below list).
- To meet the 1% rule (rent ≥ 1% of price), the offer needs to be $299k (25.2% below list).
- Recommended offer: $299k (25.2% below list) — sets the bar for 1% rule.
- Cap rate 4.7% vs local median 2.6% in New York — top-decile yield for the area; either an underpriced asset or a hidden risk that comps aren't pricing in. Stress-test before assuming the spread holds.
Location & tenants
- Location reads 75/100 on livability (#268 in NY, #4,188 nationally) — a middle-class / working-renter tenant base. Strengths: amenities A+, commute A+, health & safety A; Watch: crime F, cost of living F.
- Market conditions: Rents rising fast (+6.7%/yr); 89 active listings in the ZIP; 2 comparable units currently listed for rent nearby; 4,467 units permitted in New York County in 2024 (4,463 in 5+ unit buildings).
- At $2,992/mo this rent would consume 55% of the median local household income ($65k/yr) (locally 5780% of renters already pay >50% of income on rent) — very limited rent-growth headroom before tenants either downsize or default.
Forward outlook
- Local home prices are declining (-2.1%/yr); year-one equity from $3k of loan paydown is wiped out by about $8k of value loss. Plan a longer hold.
- New York County population projected at +21% by 2050 — long-run rental-demand tailwind backs the buy-and-hold thesis.
Negotiation context
- It's been on market 21 days — a 2% lower offer ($394k) is reasonable based on typical stale-listing flexibility.
- Current owner paid $224k; list at $400k implies a 79% gain — meaningful room to come down on a strong offer.
Risks & watch-outs
- Watch-outs: built in 1926 — expect roof / HVAC / electrical / plumbing capex.
- Climate carrying-cost: major wind risk, 27% chance of damaging wind over 30y; extreme-heat days projected 7→15/yr by 2055 (HVAC capex compounding) — expect insurance premiums to compound above CPI over the hold.
Questions for the listing agent
- What do current leases actually rent for vs. the listed asking? Can we see a recent rent roll and the last 12 months of T-12 income?
- Built in 1926 — when were the roof, HVAC, electrical panel, plumbing, and water heater last replaced?
- What does the HOA fee cover, when was the last increase, and are there any pending special assessments or reserve-fund shortfalls?
- Any open or pending special assessments — roof, HVAC, plumbing, elevator, façade? What's the per-unit balance and payoff schedule, and is the seller paying it off at close or rolling it to the buyer?
- Is there a deadline driving the sale (1031 exchange, divorce, estate, relocation)? That informs how much negotiation room exists.
- Schools are B-rated — typically a magnet for longer-tenancy family renters. What's the average tenant stay here, and is there a school-zone premium baked into asking?
- Crime grade is F in this area — have there been break-ins, vandalism, or insurance claims at this property in the last 3 years? What carrier currently insures it and at what premium?
- The area grade is low — what's the realistic commute time and amenity access for the typical tenant pool here? Any planned neighborhood developments (good or bad) we should know about?
- What's the average days-on-market for RENTAL listings here right now (not sales)? A rising rental-DOM trend means longer vacancies and softer asking-rent achievability than the comps imply.
- What's the recent tenant-quality profile in this submarket — average credit score on applications, eviction rate, late-payment / NSF rate, and stable-employment percentage? A property-management company in the area should have these aggregated.
- How much new apartment / multifamily construction is in the pipeline within 1–3 miles? Heavy new supply (>2% of stock underway) typically softens rents 12–24 months out; light construction supports rent growth.
Investment metrics
- 1% rule
- 0.75% ✗
- Cap rate
- 4.71%
- Cash-on-cash
- -5.66%
- DSCR
- 0.75
- GRM
- 11.1
CMA / ARV
No comps found within radius.
Projected returns pro-forma
-2.06% appreciation · 6.67% rent growth · sell at horizon
- IRR
- -15.9%
- Equity multiple
- 0.37×
- Total profit
- $-70,936
- Equity at exit
- $76,609
- IRR
- -4.0%
- Equity multiple
- 0.65×
- Total profit
- $-39,710
- Equity at exit
- $64,445
Cash invested: $112,000 (down + closing). Projections, not guarantees.
Landlord ↔ Tenant lean methodology
- Overall (CITY)
- 0 Strongly Tenant-Friendly
- State New York
- 15 Strongly Tenant-Friendly · D+10
- County
- — inherits STATE
- City New York
- 0 Strongly Tenant-Friendly · D+34
ZIP-level market 10031
- Home prices YoY
- -0.4%
- Rents YoY
- 6.7%
- Active inventory
- 89
- Price-to-rent
- 11.1×
Monthly cashflow live
- Estimated rent
- $2,992 medium interval (Pro) →
- Mortgage (P&I)
- −$2,098
- Tax from tax record
- −$362 /mo · $4,344/yr
- Insurance
- −$167
- HOA
- −$266
- Vacancy / Maint / Mgmt
- −$628
- Net cashflow
- $-528
Break-even live
Sensitivity live
| Price | -10% $-302 | -5% $-415 | +0% $-528 | +5% $-642 | +10% $-755 |
|---|---|---|---|---|---|
| Rent | -10% $-765 | -5% $-647 | +0% $-528 | +5% $-410 | +10% $-292 |
| Rate | -1.0pp $-327 | -0.5pp $-427 | base $-528 | +0.5pp $-632 | +1.0pp $-737 |
UW: 25.0% down · 7.5% · 30yr · 1.5% tax · 5.0% vac · 8.0% maint · 8.0% mgmt
Financing live
Cash to close
- Down payment
- $100,000
- Closing costs
- $12,000
- Reserves months
- —
- Total cash needed
- —
Loan-product check · same deal, 3 products live
Conventional
25% down · 7.5% · 30yr
- Down + closing
- —
- Monthly P&I
- —
- Monthly cashflow
- —
- DSCR
- —
- Eligible?
- —
Personal DTI + credit; lowest rate.
DSCR
20% down · 8.5% · 30yr
- Down + closing
- —
- Monthly P&I
- —
- Monthly cashflow
- —
- DSCR
- —
- Eligible?
- —
No personal income docs; deal must DSCR.
Hard money
10% down · 12.0% · 12mo
- Down + closing
- —
- Monthly P&I
- —
- Monthly cashflow
- —
- DSCR
- —
- Eligible?
- —
Short-term bridge; refi at stabilization.
Rent comps 2 comps
| Address | Beds | Baths | Sqft | Rent | $/sqft | DOM | Units | Dist |
|---|---|---|---|---|---|---|---|---|
| 132 W 134th St New York, NY | 2.0 | 1.0 | 750 | $4,500 | $6.00 | 25d | 1 | 1.03mi |
| 1203 River Rd Unit 17M Edgewater, NJ | — | 1.0 | 650 | $2,450 | $3.77 | 8d | 1 | 1.47mi |
HOA detail condo
- Monthly dues
- $266 · $3,192/yr
- Likely covers
- water
- Assessments
- None detected in remarks — confirm with the listing agent.
Listing history 13 events
-
2026-06-18days on market $400,000 Active 21 DOM
-
2026-06-17days on market $400,000 Active 20 DOM
-
2026-06-16days on market $400,000 Active 19 DOM
-
2026-06-15days on market $400,000 Active 18 DOM
-
2026-06-13days on market $400,000 Active 16 DOM
-
2026-06-10days on market $400,000 Active 12 DOM
-
2026-06-08days on market $400,000 Active 11 DOM
-
2026-06-08days on market $400,000 Active 10 DOM
-
2026-06-04days on market $400,000 Active 7 DOM
-
2026-06-03days on market $400,000 Active 6 DOM
-
2026-06-02days on market $400,000 Active 5 DOM
-
2026-06-01days on market $400,000 Active 4 DOM
-
2026-05-31days on market $400,000 Active 3 DOM
ⓘ Source: listings_history table (triggers on properties + properties_extension) + one-shot
backfill from property_details.listing_events for pre-trigger history.
Tax reassessment forecast NY · Partial reset (capped growth)
- Current annual tax
- $4,344 · $362/mo
- Projected year-2 tax
- $5,552 · $463/mo
- Expected delta
- +$1,208/yr (+$101/mo · 27.8%)
ⓘ Screening estimate from a state-policy table — verify with the county assessor before closing.
Climate risk First Street
- Flood 1/10 Low FEMA zone X (unshaded) · 0% chance over 30 yrs
- Wildfire 1/10 Low
- Heat 6/10 Major 7 d/yr ≥99°F today · 15 d/yr by 30 yrs out
- Wind 6/10 Major 27% chance of damaging wind over 30 yrs
- Air quality 4/10 Moderate 5 unhealthy d/yr today · 6 by 30 yrs out
Nearby sold comps map
Loading sold comps map…
Walkable amenities ~0.75 mi
Loading nearby amenities…
Taxation est. · year 1
- Rental income
- $35,909
- − Mortgage interest
- −$22,406
- − Property taxes
- −$4,344
- − Insurance
- −$2,000
- − Repairs & maintenance
- −$2,873
- − Management
- −$2,873
- − HOA
- −$3,192
- − Depreciation
- −$11,636
- Taxable loss
- −$13,415
- Est. tax savings @ 24.0%
- +$3,220
- After-tax cash flow
- $-3,120/yr
For passive investors: Depreciation is non-cash, so a rental often shows a tax loss while cash-flowing — sheltering income. Rental losses are passive: they offset passive income freely, and up to $25,000/yr can offset ordinary (W-2) income if you actively participate and your MAGI is under $100k (phasing out to $0 by $150k); unused losses carry forward. On sale, claimed depreciation is recaptured at up to 25%, and gains may owe capital-gains tax (a 1031 exchange can defer both). Figures are a year-1 estimate at your 24.0% rate — not tax advice; consult a CPA.
Schools (NCES district)
No district data.
Livability — New York
- Score
- 75/100
- State rank
- #268
- US rank
- #4188
Category grades
Schools grade is shown separately in the Schools card above.
Census & demographics
- Census place
- New York, NY
- County
- New York County · 1,599,927 people
- City population
- 7,731,280
- Metro
- New York-Newark-Jersey City, NY-NJ-PA
- Population (ZIP)
- 61,058
- Household income
- $65,283
- Rent vs Own
- Severe rent burden
- 5780.0
Population outlook (New York County) Hauer SSP2
- Today (2025)
- 1,825,725 people
- By 2030
- 1,904,611 · +4.3%
- By 2040
- 2,052,719 · +12.4%
- By 2050
- 2,206,601 · +20.9%
- By 2075
- 2,509,427 · +37.4%
- By 2100
- 2,702,933 · +48.0%
Race, ethnicity, and origin ACS 2023
- Neighborhood character
- Diverse neighborhood (Simpson 0.67)
- Race & ethnicity
- Hispanic / Latino 49% Black 25% Two or more races 21% White 18% Asian 4%
- Hispanic origin (detail)
- Mexican 4% Puerto Rican 4% Dominican 32%
- Common ancestry
- Italian 2% Hispanic 1% Romanian 1%
- Foreign-born
- 38% · Canada, China, Jamaica
- Languages at home
- 47% English-only · Spanish 43% French/Haitian/Cajun 3% Other Asian/Pacific 1%
Political lean MEDSL · New York
- 2024 margin
- Solid D (+64.8) · D 82.4% · R 17.6%
- 2008→2024 swing
- -7.4pp toward R · 2008: 72.2pp · 2024: 64.8pp
- All cycles
- 2024: D+64.8 2020: D+74.5 2016: D+77.2 2012: D+69.6 2008: D+72.2
Not yet ingested
- Civics
- —
Market trends
- HPI YoY
- ▼ -2.06%
- Current HPI
- 468.3156
- Rent YoY
- ▲ 6.67%
- Metro
- New York-Newark-Jersey City, NY-NJ-PA
- State GDP YoY
- ▲ 2.60%
- F500 in state
- 92
Industry mix (Fortune 500 HQ in NY)
| Industry | F500 HQs | Revenue |
|---|---|---|
| Financial Services | 10 | $950B |
|
||
| Consumer Goods | 9 | $162B |
|
||
| Insurance | 4 | $225B |
|
||
| Telecommunications | 2 | $144B |
|
||
| Pharmaceuticals | 2 | $112B |
|
||
| Media / Entertainment | 2 | $69B |
|
||
Price history
+429.8% since first listed7 events — show timeline
- 2026-05-28 Listed $400,000 RLS at REBNY
- 2025-04-08 Price Changed $399,500 RLS at REBNY
- 2024-12-08 Price Changed $425,000 RLS at REBNY
- 2010-01-05 Sold (Public Records) $224,000 Public Records
- 2003-12-16 Sold (Public Records) $135,000 Public Records
- 2000-09-13 Sold (Public Records) $67,000 Public Records
- 1989-11-06 Sold (Public Records) $75,500 Public Records
Property tax history
+4.2%/yrLatest (2025): $4,344 · +4.9% YoY. Source: county tax records.
Cash-flow waterfall
monthlySold comps — $/sqft
last 12 mo · ≤1 miLoading sold comps…