9401 NW 19th St · Pembroke Pines, FL
Flood risk 1/10 · Minimal
- FEMA flood zone
- X (shaded)
- Chance of flooding over 30 yrs
- 0.0%
- Est. flood insurance / yr
- $507 – $1,088
Fire risk 1/10 · Minimal
- Est. fire insurance / yr
- $947 – $1,759
Heat risk 10/10 · Severe
- Hot days now (above 105°F)
- 7 days/yr
- Hot days in 30 yrs
- 29 days/yr
Wind risk 10/10 · Severe
- Chance of severe wind over 30 yrs
- 99.0%
Air-quality risk 2/10 · Minimal
- Unhealthy air days now
- 2 days/yr
- Unhealthy air days in 30 yrs
- 2 days/yr
Risk factors via First Street. Map © Google.
Why this score? — see what drove the B- grade
The composite is a weighted blend of 9 inputs, each scored 0–100. Each bar is that input's sub-score; the figure is the points it added to the 100-point composite (weight × sub-score).
- Cash flow +30.0/30.0
- DSCR +10.0/10.0
- 1% rule +8.8/10.0
- ARV discount +7.5/15.0
- Livability +4.2/5.0
- Schools +4.1/10.0
- Rent growth +2.8/5.0
- Condition / age +2.5/5.0
- Appreciation +0.0/10.0
$224,500
🖨 Deal sheet 📄 Offer letter ✓ Due diligence
Listing remarks
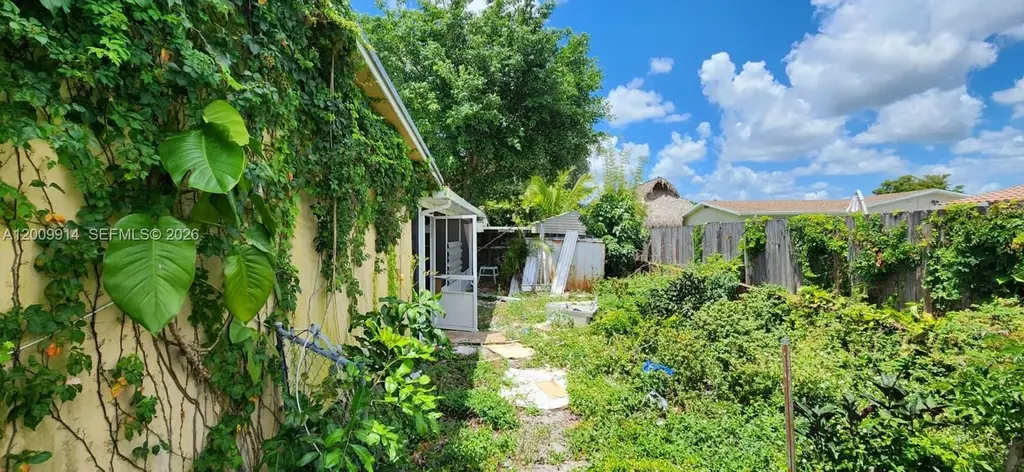
NO CALLS PLEASE. Unapproved short sale. Complete REHAB needed. Condition may include structural, roofing, plumbing, electrical, and HVAC concerns. Kitchen and bathrooms are in need of renovation. Possible unpermitted work or additions may be present. Buyer to conduct their own due diligence. Property is being sold as-is. Property may have deferred maintenance and visible wear throughout. Systems and components should be inspected by qualified professionals. No warranties or guarantees are provided by the seller. All information is deemed reliable but not guaranteed. Buyer is responsible for verifying all details prior to closing. CALLS will NOT be answered. EMAIL ONLY. DO NOT DISTURB owners
Key facts
- 6,827 sq ft lot
- Garage
- Built 1973
Property features AI
Exterior
- Parking: Driveway; 1 covered parking space; 1-car garage
- Utilities: Public water; Public sewer
- Home design: One-story home; Faces southeast; Resale property
- Construction: R-1C zoning
- Exterior features: Lot under a quarter acre
Interior
- Kitchen: Microwave
- Bedrooms: Bedroom located on the main level
- Bathrooms: 2 full bathrooms
- Heating & cooling: Central heating
- Interior features: Bedroom on main level; First-floor entry
Neighborhood map
What this means for you Summary
Snapshot
- This is a 3-bed/2.0-bath single-family listed at $224k.
Deal economics
- At list price, monthly cash flow is $896 ($11k/yr) — positive.
- The deal already cash-flows at list — no discount required.
- Meets the 1% rule at list price ($3k rent vs $224k).
- Cap rate 11.1% vs local median 4.0% in Pembroke Pines — top-decile yield for the area; either an underpriced asset or a hidden risk that comps aren't pricing in. Stress-test before assuming the spread holds.
Location & tenants
- Location reads 83/100 on livability (#54 in FL, #933 nationally) — a professional / high-income tenant draw. Strengths: housing A+, health & safety A+, schools A-; Watch: amenities D+, cost of living D+.
- Broward (suburban): math 42% / reading 53% proficiency, ranked #46 of 73 in FL (top 63%) — families likely to look elsewhere, expect single-tenant / working-renter base with shorter leases.
- Market conditions: Rents rising (+1.0%/yr); 326 active listings in the ZIP; 40 comparable units currently listed for rent nearby; rentals at typical pace (median 21d on market — plan ~3-4 weeks tenant-placement turnaround); solid renter incomes; 2,111 units permitted in Broward County in 2024 (1,265 in 5+ unit buildings).
- At $3,098/mo this rent would consume 46% of the median local household income ($80k/yr) (locally 2813% of renters already pay >50% of income on rent) — very limited rent-growth headroom before tenants either downsize or default.
Forward outlook
- Local home prices are declining (-3.0%/yr); year-one equity from $2k of loan paydown is wiped out by about $7k of value loss. Plan a longer hold.
- Broward County population projected at +34% by 2050 — long-run rental-demand tailwind backs the buy-and-hold thesis.
- At projected returns (-3.0% appreciation + 1.0% rent growth), your $63k cash investment doubles in ~9 years — after that, you're playing with house money.
Negotiation context
- Only 6 days on market — expect competitive offers; lowballing is unlikely to land.
- Current owner paid $163k; 38% above their basis — modest negotiation headroom, anchor on the comps not their cost.
Risks & watch-outs
- Climate carrying-cost: severe wind risk, 99% chance of damaging wind over 30y; extreme-heat days projected 7→29/yr by 2055 (HVAC capex compounding) — expect insurance premiums to compound above CPI over the hold.
Questions for the listing agent
- Built in 1973 — when were the roof, HVAC, electrical panel, plumbing, and water heater last replaced?
- Is there a deadline driving the sale (1031 exchange, divorce, estate, relocation)? That informs how much negotiation room exists.
- Schools are A-rated — typically a magnet for longer-tenancy family renters. What's the average tenant stay here, and is there a school-zone premium baked into asking?
- What's the average days-on-market for RENTAL listings here right now (not sales)? A rising rental-DOM trend means longer vacancies and softer asking-rent achievability than the comps imply.
- What's the recent tenant-quality profile in this submarket — average credit score on applications, eviction rate, late-payment / NSF rate, and stable-employment percentage? A property-management company in the area should have these aggregated.
- How much new for-sale + rental construction is in the pipeline within 1–3 miles? Heavy new supply typically softens prices + rents 12–24 months out; constrained supply supports both.
Investment metrics
- 1% rule
- 1.38% ✓
- Cap rate
- 11.08%
- Cash-on-cash
- 17.10%
- DSCR
- 1.76
- GRM
- 6.0
CMA / ARV
- ARV (on-the-fly)
- $589,810
- Comps found
- 12
Show comp detail 12 sales within ~0.75 mi
| Address | Dist | Beds/Ba | Sqft | Sold | Price | $/sf | Match |
|---|---|---|---|---|---|---|---|
| 1731 NW 93 Ave | 0.12mi | 4/2.0 (+1) | 1,663 (-2%) | 10mo | $580,000 | $349 | 78 |
| 2130 NW 100th Ave | 0.53mi | 3/2.0 | 1,598 (-5%) | 3mo | $550,000 | $344 | 64 |
| 1185 NW 92nd Ave | 0.52mi | 3/2.0 | 1,545 (-9%) | 2mo | $520,000 | $337 | 60 |
| 9700 NW 10th St | 0.64mi | 3/2.0 | 1,796 (+6%) | 2mo | $523,000 | $291 | 58 |
| 2101 NW 99 Ave | 0.41mi | 3/2.0 | 1,658 (-2%) | 23mo | $550,000 | $332 | 58 |
| 8730 NW 18th St | 0.59mi | 4/2.0 (+1) | 1,812 (+7%) | 1mo | $708,000 | $391 | 54 |
| 1200 NW 92nd Ave | 0.49mi | 3/2.0 | 1,548 (-8%) | 14mo | $717,100 | $463 | 52 |
| 8900 NW 11th St | 0.69mi | 3/2.0 | 1,543 (-9%) | 4mo | $595,000 | $386 | 50 |
| 2431 NW 101st Ter | 0.65mi | 3/2.0 | 1,791 (+6%) | 16mo | $644,000 | $360 | 46 |
| 10120 Sheridan St | 0.69mi | 3/2.0 | 1,919 (+14%) | 3mo | $640,000 | $334 | 43 |
| 10220 NW 25th St | 0.73mi | 3/2.0 | 1,919 (+14%) | 3mo | $670,000 | $349 | 41 |
| 8925 NW 10th St | 0.69mi | 3/2.0 | 1,543 (-9%) | 20mo | $680,000 | $441 | 37 |
Match score weights: distance 35% · size 25% · config 20% · recency 20%. Top-matched comps best support the ARV.
Projected returns pro-forma
-3.0% appreciation · 1.01% rent growth · sell at horizon
- IRR
- 6.1%
- Equity multiple
- 1.23×
- Total profit
- $14,641
- Equity at exit
- $33,474
- IRR
- 13.7%
- Equity multiple
- 1.99×
- Total profit
- $62,426
- Equity at exit
- $19,411
Cash invested: $62,860 (down + closing). Projections, not guarantees.
Landlord ↔ Tenant lean methodology
- Overall (STATE)
- 87 Strongly Landlord-Friendly
- State Florida
- 87 Strongly Landlord-Friendly · R+3
- County
- — inherits STATE
- City
- — inherits STATE
ZIP-level market 33024
- Rents YoY
- 1.0%
- Active inventory
- 326
- Price-to-rent
- 6.0×
Monthly cashflow live
- Estimated rent
- $3,098 high interval (Pro) →
- Mortgage (P&I)
- −$1,177
- Tax est. 1.5%
- −$281 /mo · $3,368/yr
- Insurance
- −$94
- HOA
- −$0
- Vacancy / Maint / Mgmt
- −$651
- Net cashflow
- $896
Break-even live
UW: 25.0% down · 7.5% · 30yr · 1.5% tax · 5.0% vac · 8.0% maint · 8.0% mgmt
Financing live
Cash to close
- Down payment
- $56,125
- Closing costs
- $6,735
- Reserves months
- —
- Total cash needed
- —
Loan-product check · same deal, 3 products live
Conventional
25% down · 7.5% · 30yr
- Down + closing
- —
- Monthly P&I
- —
- Monthly cashflow
- —
- DSCR
- —
- Eligible?
- —
Personal DTI + credit; lowest rate.
DSCR
20% down · 8.5% · 30yr
- Down + closing
- —
- Monthly P&I
- —
- Monthly cashflow
- —
- DSCR
- —
- Eligible?
- —
No personal income docs; deal must DSCR.
Hard money
10% down · 12.0% · 12mo
- Down + closing
- —
- Monthly P&I
- —
- Monthly cashflow
- —
- DSCR
- —
- Eligible?
- —
Short-term bridge; refi at stabilization.
Rent comps 40 comps
| Address | Beds | Baths | Sqft | Rent | $/sqft | DOM | Units | Dist |
|---|---|---|---|---|---|---|---|---|
| 1701 NW 96th Ter Unit 1C Pembroke Pines, FL | 3.0 | 2.0 | 1093 | $2,495 | $2.28 | 24d | 1 | 0.17mi |
| 1761 Bayberry Dr Pembroke Pines, FL | 3.0 | 2.0 | 1450 | $2,650 | $1.83 | 17d | 1 | 0.19mi |
| 2101 Bayberry Dr Unit 2101 Pembroke Pines, FL | 2.0 | 2.5 | 1542 | $2,900 | $1.88 | 24d | 1 | 0.24mi |
| 1950 Bayberry Dr Pembroke Pines, FL | 3.0 | 2.5 | 1813 | $3,100 | $1.71 | 24d | 1 | 0.24mi |
| 9421 NW 15th St #234 Pembroke Pines, FL | 3.0 | 2.5 | 1472 | $2,750 | $1.87 | 16d | 1 | 0.26mi |
| 2180 NW 93rd Ave Pembroke Pines, FL | 4.0 | 2.0 | 2126 | $3,800 | $1.79 | 24d | 1 | 0.29mi |
| 9511 NW 14th Ct #213 Pembroke Pines, FL | 2.0 | 2.0 | 1080 | $2,400 | $2.22 | 7d | 1 | 0.30mi |
| 9151 Orchid Tree Ln #131 Pembroke Pines, FL | 3.0 | 2.5 | 1472 | $3,150 | $2.14 | 24d | 1 | 0.33mi |
| 9321 NW 14th St Pembroke Pines, FL | 4.0 | 2.0 | 1355 | $3,999 | $2.95 | 24d | 1 | 0.35mi |
| 9110 Orchid Tree Ln #138 Pembroke Pines, FL | 3.0 | 2.5 | 1472 | $3,300 | $2.24 | 24d | 1 | 0.36mi |
| 9110 Orchid Tree Ln #138 Pembroke Pines, FL | 3.0 | 2.5 | 1472 | $3,300 | $2.24 | 16d | 1 | 0.36mi |
| 9715 NW 23rd Ct Pembroke Pines, FL | 3.0 | 2.5 | 1589 | $3,800 | $2.39 | 24d | 1 | 0.37mi |
| 9732 NW 15th St #306 Pembroke Pines, FL | 2.0 | 2.5 | 1214 | $2,650 | $2.18 | 20d | 1 | 0.39mi |
| 8951 NW 21st St Pembroke Pines, FL | 3.0 | 2.0 | 1626 | $3,950 | $2.43 | 7d | 1 | 0.41mi |
| 1561 NW 98th Ave #1561 Pembroke Pines, FL | 2.0 | 2.0 | 1060 | $2,500 | $2.36 | 12d | 1 | 0.42mi |
| 9900 Sheridan St Pembroke Pines, FL | 1.0–3.0 | 1.0–2.0 | 965 | $2,725 | $2.82 | 1d | 16 | 0.42mi |
| 1601 NW 98th Way Pembroke Pines, FL | 2.0 | 2.0 | 1060 | $2,700 | $2.55 | 7d | 1 | 0.48mi |
| 1601 NW 98th Way Pembroke Pines, FL | 2.0 | 2.0 | 1060 | $2,700 | $2.55 | 20d | 1 | 0.48mi |
| 8930 NW 23rd St Pembroke Pines, FL | 3.0 | 2.0 | 1907 | $3,500 | $1.84 | 24d | 1 | 0.48mi |
| 2101 NW 101st Ter Pembroke Pines, FL | 4.0 | 3.0 | 1965 | $4,200 | $2.14 | 24d | 1 | 0.56mi |
| 1168 NW 97th Ave #232 Pembroke Pines, FL | 2.0 | 2.5 | 1214 | $2,650 | $2.18 | 13d | 1 | 0.58mi |
| 920 NW 92nd Ave Pembroke Pines, FL | 3.0 | 2.0 | 1548 | $3,800 | $2.45 | 24d | 1 | 0.63mi |
| 1641 Fairway Rd Pembroke Pines, FL | 3.0 | 2.0 | 1359 | $3,200 | $2.35 | 14d | 1 | 0.64mi |
| 1641 Fairway Rd Pembroke Pines, FL | 3.0 | 2.0 | 1359 | $3,200 | $2.35 | 24d | 1 | 0.64mi |
| 1400 Saint Charles Pl #323 Pembroke Pines, FL | 2.0 | 2.0 | 1070 | $2,350 | $2.20 | 7d | 1 | 0.71mi |
| 1400 Saint Charles Pl #323 Pembroke Pines, FL | 2.0 | 2.0 | 1070 | $2,400 | $2.24 | 24d | 1 | 0.71mi |
| 1400 Saint Charles Pl #713 Pembroke Pines, FL | 2.0 | 2.0 | 1260 | $2,000 | $1.59 | 16d | 1 | 0.71mi |
| 1400 Saint Charles Pl #608 Pembroke Pines, FL | 2.0 | 2.0 | 1100 | $1,900 | $1.73 | 15d | 1 | 0.71mi |
| 1400 Saint Charles Pl #701 Pembroke Pines, FL | 2.0 | 2.0 | 1100 | $2,000 | $1.82 | 2d | 1 | 0.71mi |
| 8761 NW 12th St Pembroke Pines, FL | 3.0 | 2.0 | 1429 | $3,300 | $2.31 | 24d | 1 | 0.77mi |
| 2251 NW 87th Ave Unit 2251 Pembroke Pines, FL | 4.0 | 2.0 | 1905 | $4,600 | $2.41 | 12d | 1 | 0.80mi |
| 8940 NW 7th Ct Pembroke Pines, FL | 4.0 | 2.5 | 2008 | $5,000 | $2.49 | 24d | 1 | 0.83mi |
| 2724 Cayenne Ave Hollywood, FL | 3.0 | 2.0 | 1432 | $1,650 | $1.15 | 5d | 1 | 0.83mi |
| 10351 Juniper Ct Pembroke Pines, FL | 2.0 | 2.0 | 1196 | $2,650 | $2.22 | 24d | 1 | 0.87mi |
| 1100 Saint Charles Pl Pembroke Pines, FL | 2.0 | 2.0 | 1100 | $2,000 | $1.82 | 24d | 1 | 0.89mi |
| 9741 NW 5th St Unit 9741 Pembroke Pines, FL | 3.0 | 2.0 | 1574 | $3,300 | $2.10 | 14d | 1 | 0.89mi |
| 2091 NW 85th Way Pembroke Pines, FL | 4.0 | 2.0 | 1911 | $3,995 | $2.09 | 24d | 1 | 0.94mi |
| 10418 Brasilia St Unit 10418 Hollywood, FL | 3.0 | 2.0 | 1942 | $5,100 | $2.63 | 24d | 1 | 0.94mi |
| 1511 NW 85th Way Pembroke Pines, FL | 2.0 | 1.0 | 1317 | $2,725 | $2.07 | 18d | 1 | 0.96mi |
| 900 Saint Charles Pl #708 Pembroke Pines, FL | 2.0 | 2.0 | 1100 | $1,999 | $1.82 | 2d | 1 | 0.97mi |
Listing history 5 events
-
2026-05-05status Pending
-
2026-05-03historical Active Under Contract
-
2026-04-28$224,500 Active
-
2001-12-21soldstatus $163,000
-
1973-12-01soldstatus $34,500
ⓘ Source: listings_history table (triggers on properties + properties_extension) + one-shot
backfill from property_details.listing_events for pre-trigger history.
Climate risk First Street
- Flood 1/10 Low FEMA zone X (shaded) · 0% chance over 30 yrs
- Wildfire 1/10 Low
- Heat 10/10 Extreme 7 d/yr ≥105°F today · 29 d/yr by 30 yrs out
- Wind 10/10 Extreme 99% chance of damaging wind over 30 yrs
- Air quality 2/10 Low 2 unhealthy d/yr today · 2 by 30 yrs out
Nearby sold comps map
Loading sold comps map…
Walkable amenities ~0.75 mi
Loading nearby amenities…
Taxation est. · year 1
- Rental income
- $37,174
- − Mortgage interest
- −$12,575
- − Property taxes
- −$3,368
- − Insurance
- −$1,122
- − Repairs & maintenance
- −$2,974
- − Management
- −$2,974
- − Depreciation
- −$6,531
- Taxable income
- $7,630
- Est. tax owed @ 24.0%
- −$1,831
- After-tax cash flow
- $8,919/yr
For passive investors: Depreciation is non-cash, so a rental often shows a tax loss while cash-flowing — sheltering income. Rental losses are passive: they offset passive income freely, and up to $25,000/yr can offset ordinary (W-2) income if you actively participate and your MAGI is under $100k (phasing out to $0 by $150k); unused losses carry forward. On sale, claimed depreciation is recaptured at up to 25%, and gains may owe capital-gains tax (a 1031 exchange can defer both). Figures are a year-1 estimate at your 24.0% rate — not tax advice; consult a CPA.
Schools (NCES district)
- District
- Broward
- NCES district ID
- 1200180
- Math proficiency
- 42% ▼ -18.00%
- Reading proficiency
- 53% ▼ -5.00%
- Median HH income
- $52,139
- Composite
- 40.88/100
- National rank
- #3621
- State rank
- #46 of 73 in FL
Livability — Pembroke Pines
- Score
- 83/100
- State rank
- #54
- US rank
- #933
Category grades
Schools grade is shown separately in the Schools card above.
Census & demographics
- Census place
- Pembroke Pines, FL
- County
- Broward County · 1,963,430 people
- City population
- 180,224
- Metro
- Miami-Fort Lauderdale-Pompano Beach, FL
- Population (ZIP)
- 76,585
- Household income
- $80,061
- Rent vs Own
- Severe rent burden
- 2813.0
Population outlook (Broward County) Hauer SSP2
- Today (2025)
- 2,207,033 people
- By 2030
- 2,360,704 · +7.0%
- By 2040
- 2,661,208 · +20.6%
- By 2050
- 2,946,698 · +33.5%
- By 2075
- 3,602,273 · +63.2%
- By 2100
- 3,970,984 · +79.9%
Race, ethnicity, and origin ACS 2023
- Neighborhood character
- Diverse neighborhood (Simpson 0.65)
- Race & ethnicity
- Hispanic / Latino 52% Two or more races 23% White 22% Black 17% Asian 4%
- Hispanic origin (detail)
- Mexican 3% Puerto Rican 7% Cuban 13% Dominican 5%
- Common ancestry
- Hispanic 4% Romanian 2% Estonian 1%
- Foreign-born
- 40% · Canada, Jamaica, Dominican Republic
- Languages at home
- 44% English-only · Spanish 46% French/Haitian/Cajun 5% Other Indo-European 3%
Political lean MEDSL · Broward
- 2024 margin
- D (+17.0) · D 58.0% · R 41.0%
- 2008→2024 swing
- -17.8pp toward R · 2008: 34.7pp · 2024: 17.0pp
- All cycles
- 2024: D+17.0 2020: D+29.8 2016: D+35.0 2012: D+34.9 2008: D+34.7
Not yet ingested
- Civics
- —
Market trends
- HPI YoY
- ▼ -442.20%
- Current HPI
- 464.3405
- Rent YoY
- ▲ 1.01%
- Metro
- Miami-Fort Lauderdale-Pompano Beach, FL
- State GDP YoY
- ▲ 3.28%
- F500 in state
- 36
Industry mix (Fortune 500 HQ in FL)
| Industry | F500 HQs | Revenue |
|---|---|---|
| Industrial Technology | 2 | $29B |
|
||
| Insurance | 2 | $17B |
|
||
| Retail | 1 | $60B |
|
||
| Technology Distribution | 1 | $58B |
|
||
| Homebuilding | 1 | $35B |
|
||
| Technology Manufacturing | 1 | $35B |
|
||
Price history
+550.7% since first listed5 events — show timeline
- 2026-05-05 Pending — MARMLS
- 2026-05-03 Contingent — MARMLS
- 2026-04-28 Listed $224,500 MARMLS
- 2001-12-21 Sold (Public Records) $163,000 Public Records
- 1973-12-01 Sold (Public Records) $34,500 Public Records
Property tax history
+12.6%/yrLatest (2025): $11,932 · +7.6% YoY. Source: county tax records.
Cash-flow waterfall
monthlySold comps — $/sqft
last 12 mo · ≤1 miLoading sold comps…