 6-Plex
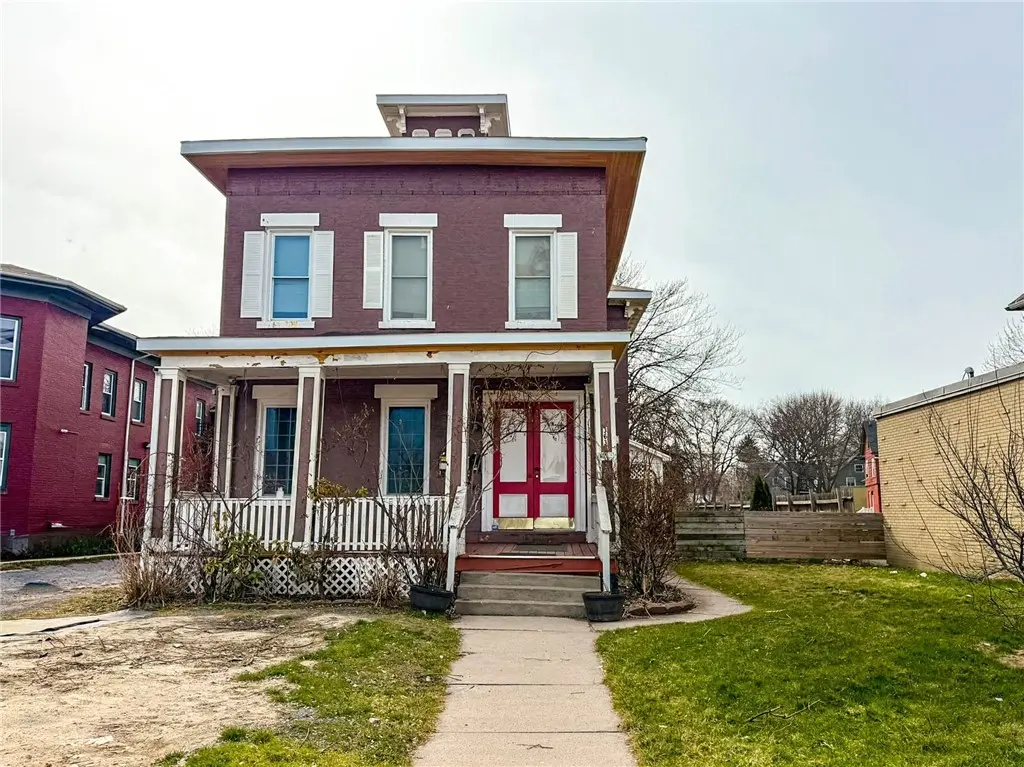
363 Lake Ave · Rochester, NY
Flood risk 1/10 · Minimal
- FEMA flood zone
- X (unshaded)
- Chance of flooding over 30 yrs
- 0.0%
- Est. flood insurance / yr
- $473 – $860
Fire risk 1/10 · Minimal
- Est. fire insurance / yr
- $691 – $1,283
Heat risk 2/10 · Minimal
- Hot days now (above 95°F)
- 7 days/yr
- Hot days in 30 yrs
- 15 days/yr
Wind risk 1/10 · Minimal
- Chance of severe wind over 30 yrs
- —
Air-quality risk 2/10 · Minimal
- Unhealthy air days now
- 1 days/yr
- Unhealthy air days in 30 yrs
- 2 days/yr
Risk factors via First Street. Map © Google.
Why this score? — see what drove the B- grade
The composite is a weighted blend of 9 inputs, each scored 0–100. Each bar is that input's sub-score; the figure is the points it added to the 100-point composite (weight × sub-score).
- Cash flow +30.0/30.0
- 1% rule +10.0/10.0
- DSCR +10.0/10.0
- Appreciation +6.8/10.0
- Rent growth +4.2/5.0
- Livability +3.8/5.0
- Condition / age +2.2/5.0
- Schools +1.9/10.0
- ARV discount +0.0/15.0
$299,900
🖨 Deal sheet (PDF) 📄 Offer letter ✓ Due diligence
Multi-family units
County records classify this as Multi-Family (5+ Unit). Listing-text estimate: 6 units. confirmed
5+ unit building — per-unit beds/baths from public records are typically unavailable; the breakdown below (if shown) is an estimate from the listing text.
Listing remarks MLS
Turnkey investment opportunity in the City of Rochester! This well-maintained 6-unit apartment building features six 1-bedroom, 1-bath units, offering strong income potential and flexibility for both investors and owner-occupants. Each unit offers a spacious layout with eat-in kitchens. Currently, 4 units are rented, 1 is owner-occupied, and 1 unit is vacant and producing a monthly gross income of $2,900. Newer gutters, a newer roof, newer soffits, and some vinyl windows are a few of the updates you will find throughout the property. Whether you're looking to expand your portfolio or live in one unit while collecting rental income, this property presents a fantastic opportunity with built-in potential.
Key facts
- Spacious layout
- Eat in kitchens
- 0.25 acre lot
Tags
Neighborhood map
What this means for you Summary
Snapshot
- This is a 6 × 1-bed/1-bath units multifamily listed at $300k. Condition is rated fair.
Deal economics
- At list price, monthly cash flow is $4k ($52k/yr) — positive. Per door: $718/mo.
- The deal already cash-flows at list — no discount required.
- Meets the 1% rule at list price ($8k rent vs $300k).
- Recommended offer: $282k (6.0% below list) — sets the bar for market timing.
- Cap rate 23.5% vs local median 9.3% in Rochester — top-decile yield for the area; either an underpriced asset or a hidden risk that comps aren't pricing in. Stress-test before assuming the spread holds.
Location & tenants
- Location reads 76/100 on livability (#222 in NY, #3,482 nationally) — a middle-class / working-renter tenant base. Strengths: commute A+, cost of living A+, housing A+; Watch: crime F, employment F.
- Rochester City School District (urban): math 21% / reading 26% proficiency, ranked #589 of 590 in NY (top 100%) — low school quality limits family demand, transient renter base, plan for 1-2y turnover; 82% free/reduced lunch — lower-income household profile, screen leases tightly.
- Zoned schools: School 5-John Williams (math 2% / reading 8%, grade F, #2,098 of 2,108 statewide, top 100%, 596 students, 93% FRL); East Lower School (math 2% / reading 22%, grade F, #715 of 729 statewide, top 98%, 304 students, 86% FRL); Edison Career And Technology High School (math 44% / reading 50%, grade D-, #1,007 of 1,100 statewide, top 93%, 1,233 students, 91% FRL).
- Market conditions: Rents rising fast (+6.6%/yr); 51 active listings in the ZIP; lower-income renter base — watch delinquency; 1,169 units permitted in Monroe County in 2024 (591 in 5+ unit buildings).
Forward outlook
- In year one you build about $13k of equity ($2k loan paydown + $11k appreciation (3.7% local appreciation)).
- Monroe County population projected to shrink 6% by 2050 — rents likely to lag national; underwrite the cash flow, not the appreciation.
- At projected returns (3.7% appreciation + 6.6% rent growth), your $84k cash investment doubles in ~2 years — after that, you're playing with house money.
- By year 3, paydown + projected appreciation supports a ~$33k cash-out refi (75% LTV) — recoverable capital for the next deal without selling this one.
Negotiation context
- It's been on market 88 days — a 6% lower offer ($282k) is reasonable based on typical stale-listing flexibility.
- 3 sale attempts since 16y ago; this cycle's ask has dropped $20k (6%) from the opening price — seller is motivated, your offer sets the floor, not the list.
- Current owner paid $60k; list at $300k implies a 400% gain — meaningful room to come down on a strong offer.
Risks & watch-outs
- Watch-outs: built in 1900 — expect roof / HVAC / electrical / plumbing capex.
Questions for the listing agent
- It's been on market 88 days. Have you received any prior offers? Is the seller open to a 6% concession, seller financing, or rate buy-down credit?
- Can we see the unit-by-unit rent roll, current vacancy, and any below-market leases? What's the average tenancy length?
- What capital expenditures (roof, boiler, parking lot, exteriors) have been made in the last 5 years, and what's planned in the next 2?
- Have any recent inspections been done? Can we get a copy of the seller's disclosures and any deferred-maintenance estimates?
- Built in 1900 — when were the roof, HVAC, electrical panel, plumbing, and water heater last replaced?
- Why hasn't it sold? Are there any deal-killer items the seller is aware of (foundation, flood, title, zoning, code violations)?
- Is there a deadline driving the sale (1031 exchange, divorce, estate, relocation)? That informs how much negotiation room exists.
- Schools are D-rated, which usually means shorter tenancies and higher turnover. Who's the typical renter profile here, and what's been the actual vacancy rate?
- Crime grade is F in this area — have there been break-ins, vandalism, or insurance claims at this property in the last 3 years? What carrier currently insures it and at what premium?
- What's the average days-on-market for RENTAL listings here right now (not sales)? A rising rental-DOM trend means longer vacancies and softer asking-rent achievability than the comps imply.
- What's the recent tenant-quality profile in this submarket — average credit score on applications, eviction rate, late-payment / NSF rate, and stable-employment percentage? A property-management company in the area should have these aggregated.
- How much new apartment / multifamily construction is in the pipeline within 1–3 miles? Heavy new supply (>2% of stock underway) typically softens rents 12–24 months out; light construction supports rent growth.
Investment metrics
- 1% rule
- 2.69% ✓
- Cap rate
- 23.52%
- Cash-on-cash
- 61.52%
- DSCR
- 3.74
- GRM
- 3.1
CMA / ARV
- ARV (median comp)
- $246,390
- List price
- $299,900
- Delta
- 21.72%
- Verdict
- OVERPRICED
- Comps
- 20 within 1.0 mi
Projected returns pro-forma
3.69% appreciation · 6.61% rent growth · sell at horizon
- IRR
- 70.5%
- Equity multiple
- 5.19×
- Total profit
- $351,940
- Equity at exit
- $146,668
- IRR
- 70.7%
- Equity multiple
- 11.81×
- Total profit
- $908,059
- Equity at exit
- $235,687
Cash invested: $83,972 (down + closing). Projections, not guarantees.
Landlord ↔ Tenant lean methodology
- Overall (STATE)
- 15 Strongly Tenant-Friendly
- State New York
- 15 Strongly Tenant-Friendly · D+10
- County
- — inherits STATE
- City
- — inherits STATE
ZIP-level market 14608
- Home prices YoY
- 1.3%
- Rents YoY
- 6.6%
- Active inventory
- 51
- Price-to-rent
- 18.6×
Monthly cashflow live
- Estimated rent
- $8,073 high interval (Pro) →
- Mortgage (P&I)
- −$1,573
- Tax est. 1.5%
- −$375 /mo · $4,498/yr
- Insurance
- −$125
- HOA
- −$0
- Vacancy / Maint / Mgmt
- −$1,695
- Net cashflow
- $4,305
Break-even live
Sensitivity live
| Price | -10% $4,512 | -5% $4,409 | +0% $4,305 | +5% $4,202 | +10% $4,098 |
|---|---|---|---|---|---|
| Rent | -10% $3,667 | -5% $3,986 | +0% $4,305 | +5% $4,624 | +10% $4,943 |
| Rate | -1.0pp $4,456 | -0.5pp $4,381 | base $4,305 | +0.5pp $4,227 | +1.0pp $4,148 |
6-unit breakdown (identical units grouped — click to expand)
| Units | Beds | Baths | Est. rent |
|---|---|---|---|
| 6× units | 1 | 1 | $8,076 |
| #1 | 1 | 1 | $1,346 |
| #2 | 1 | 1 | $1,346 |
| #3 | 1 | 1 | $1,346 |
| #4 | 1 | 1 | $1,346 |
| #5 | 1 | 1 | $1,346 |
| #6 | 1 | 1 | $1,346 |
| Total (6 units) | $8,073 | ||
UW: 25.0% down · 7.5% · 30yr · 1.5% tax · 5.0% vac · 8.0% maint · 8.0% mgmt
Financing live
Cash to close
- Down payment
- $74,975
- Closing costs
- $8,997
- Reserves months
- —
- Total cash needed
- —
Loan-product check · same deal, 3 products live
Conventional
25% down · 7.5% · 30yr
- Down + closing
- —
- Monthly P&I
- —
- Monthly cashflow
- —
- DSCR
- —
- Eligible?
- —
Personal DTI + credit; lowest rate.
DSCR
20% down · 8.5% · 30yr
- Down + closing
- —
- Monthly P&I
- —
- Monthly cashflow
- —
- DSCR
- —
- Eligible?
- —
No personal income docs; deal must DSCR.
Hard money
10% down · 12.0% · 12mo
- Down + closing
- —
- Monthly P&I
- —
- Monthly cashflow
- —
- DSCR
- —
- Eligible?
- —
Short-term bridge; refi at stabilization.
Listing history 21 events
-
2026-06-21days on market $299,900 Active 88 DOM
-
2026-06-18days on market $299,900 Active 85 DOM
-
2026-06-17days on market $299,900 Active 84 DOM
-
2026-06-16days on market $299,900 Active 83 DOM
-
2026-06-15days on market $299,900 Active 82 DOM
-
2026-06-13days on market $299,900 Active 80 DOM
-
2026-06-13days on market $299,900 Active 79 DOM
-
2026-06-10days on market $299,900 Active 77 DOM
-
2026-06-09days on market $299,900 Active 76 DOM
-
2026-06-09days on market $299,900 Active 75 DOM
-
2026-06-07days on market $299,900 Active 74 DOM
-
2026-06-05days on market $299,900 Active 71 DOM
-
2026-06-03days on market $299,900 Active 70 DOM
-
2026-06-03days on market $299,900 Active 69 DOM
-
2026-06-01days on market $299,900 Active 68 DOM
-
2026-05-31days on market $299,900 Active 67 DOM
-
2026-03-25$319,900 Active 711-char remark
Show marketing remark (711 chars)
Turnkey investment opportunity in the City of Rochester! This well-maintained 6-unit apartment building features six 1-bedroom, 1-bath units, offering strong income potential and flexibility for both investors and owner-occupants. Each unit offers a spacious layout with eat-in kitchens. Currently, 4 units are rented, 1 is owner-occupied, and 1 unit is vacant and producing a monthly gross income of $2,900. Newer gutters, a newer roof, newer soffits, and some vinyl windows are a few of the updates you will find throughout the property. Whether you're looking to expand your portfolio or live in one unit while collecting rental income, this property presents a fantastic opportunity with built-in potential.
-
2013-04-29soldstatus $60,000 238-char remark
Show marketing remark (238 chars)
This brick, 2 story, 6 family is a CASH COW! Boiler is 7-8 years old. Tenants pay their own electric & cooking gas. Annual Operating Expenses: RG & E/ 6800 average, H2O/500, Insurance/$1200, Refuse/$700.Property needs some work.
-
2012-11-18$89,900 238-char remark
Show marketing remark (238 chars)
This brick, 2 story, 6 family is a CASH COW! Boiler is 7-8 years old. Tenants pay their own electric & cooking gas. Annual Operating Expenses: RG & E/ 6800 average, H2O/500, Insurance/$1200, Refuse/$700.Property needs some work.
-
2010-10-30soldstatus $70,000
-
2010-07-26$90,000
ⓘ Source: listings_history table (triggers on properties + properties_extension) + one-shot
backfill from property_details.listing_events for pre-trigger history.
Climate risk First Street
- Flood 1/10 Low FEMA zone X (unshaded) · 0% chance over 30 yrs
- Wildfire 1/10 Low
- Heat 2/10 Low 7 d/yr ≥95°F today · 15 d/yr by 30 yrs out
- Wind 1/10 Low
- Air quality 2/10 Low 1 unhealthy d/yr today · 2 by 30 yrs out
Nearby sold comps map
Loading sold comps map…
Walkable amenities ~0.75 mi
Loading nearby amenities…
Taxation est. · year 1
- Rental income
- $96,876
- − Mortgage interest
- −$16,799
- − Property taxes
- −$4,498
- − Insurance
- −$1,500
- − Repairs & maintenance
- −$7,750
- − Management
- −$7,750
- − Depreciation
- −$8,724
- Taxable income
- $49,854
- Est. tax owed @ 24.0%
- −$11,965
- After-tax cash flow
- $39,696/yr
For passive investors: Depreciation is non-cash, so a rental often shows a tax loss while cash-flowing — sheltering income. Rental losses are passive: they offset passive income freely, and up to $25,000/yr can offset ordinary (W-2) income if you actively participate and your MAGI is under $100k (phasing out to $0 by $150k); unused losses carry forward. On sale, claimed depreciation is recaptured at up to 25%, and gains may owe capital-gains tax (a 1031 exchange can defer both). Figures are a year-1 estimate at your 24.0% rate — not tax advice; consult a CPA.
Condition & rehab AI · 2 photos
This multi-family property requires extensive repairs and maintenance to improve its condition and value. Immediate focus should be on the roof, exterior, flooring, and interior walls.
Repairs flagged
- Major roof — Exposed roof structure
- Major exterior siding — Peeling paint and exposed siding
- Major flooring — Worn and uneven flooring
- Major interior walls — Painted walls with visible wear
Value-add opportunities
- Both painting and repainting — Enhances curb appeal and interior aesthetics
- Both roof replacement — Critical for structural integrity and long-term value
- Both flooring replacement — Improves living conditions and property value
- Both interior wall repairs — Restores structural integrity and enhances appearance
Renovation cost estimate screening
| Repair item | Severity | Est. cost |
|---|---|---|
| roof · Exposed roof structure | Major | $15,000–50,000 |
| exterior siding · Peeling paint and exposed siding | Major | $15,000–50,000 |
| flooring · Worn and uneven flooring | Major | $15,000–50,000 |
| interior walls · Painted walls with visible wear | Major | $15,000–50,000 |
| Total estimated repair cost · 4 items | $60,000–200,000 |
Value-add ROI direction
- Both painting and repainting — Enhances curb appeal and interior aesthetics ↑
- Both roof replacement — Critical for structural integrity and long-term value ↑
- Both flooring replacement — Improves living conditions and property value ↑
- Both interior wall repairs — Restores structural integrity and enhances appearance ↑
ⓘ Cost ranges are severity-bucket heuristics (US national rule-of-thumb). Get contractor quotes + a written scope before underwriting a rehab budget.
Schools (NCES district)
- District
- Rochester City School District
- NCES district ID
- 3624750
- Math proficiency
- 21% ▬ 0.00%
- Reading proficiency
- 26% ▲ 4.00%
- Median HH income
- $30,923
- Composite
- 18.98/100
- National rank
- #8850
- State rank
- #589 of 590 in NY
Livability — Rochester
- Score
- 76/100
- State rank
- #222
- US rank
- #3482
Category grades
Schools grade is shown separately in the Schools card above.
Census & demographics
- Census place
- Rochester, NY
- County
- Monroe County · 674,131 people
- City population
- 432,803
- Metro
- Rochester, NY
- Population (ZIP)
- 12,792
- Household income
- $40,646
- Rent vs Own
- Severe rent burden
- 1300.0
Population outlook (Monroe County) Hauer SSP2
- Today (2025)
- 759,460 people
- By 2030
- 757,154 · -0.3%
- By 2040
- 740,644 · -2.5%
- By 2050
- 714,443 · -5.9%
- By 2075
- 645,883 · -15.0%
- By 2100
- 547,084 · -28.0%
Race, ethnicity, and origin ACS 2023
- Neighborhood character
- Diverse neighborhood (Simpson 0.67)
- Race & ethnicity
- Black 50% White 25% Two or more races 13% Hispanic / Latino 12% Asian 4%
- Hispanic origin (detail)
- Puerto Rican 10%
- Common ancestry
- Lithuanian 1% Romanian 1% Iranian 1%
- Foreign-born
- 8% · Canada, India
- Languages at home
- 85% English-only · Spanish 8% Other Indo-European 3% French/Haitian/Cajun 1%
Political lean MEDSL · Monroe
- 2024 margin
- D (+19.1) · D 59.5% · R 40.5%
- 2008→2024 swing
- +1.4pp toward D · 2008: 17.7pp · 2024: 19.1pp
- All cycles
- 2024: D+19.1 2020: D+21.0 2016: D+14.1 2012: D+17.4 2008: D+17.7
Not yet ingested
- Civics
- —
Market trends
- HPI YoY
- ▲ 3.69%
- Current HPI
- 280.2411
- Rent YoY
- ▲ 6.61%
- Metro
- Rochester, NY
- State GDP YoY
- ▲ 2.60%
- F500 in state
- 92
Industry mix (Fortune 500 HQ in NY)
| Industry | F500 HQs | Revenue |
|---|---|---|
| Financial Services | 10 | $950B |
|
||
| Consumer Goods | 9 | $162B |
|
||
| Insurance | 4 | $225B |
|
||
| Telecommunications | 2 | $144B |
|
||
| Pharmaceuticals | 2 | $112B |
|
||
| Media / Entertainment | 2 | $69B |
|
||
Price history
+255.4% since first listed5 events — show timeline
- 2026-03-25 Listed $319,900 UNYREIS
- 2013-04-29 Sold (MLS) $60,000 UNYREIS
- 2012-11-18 Listed $89,900 UNYREIS
- 2010-10-30 Sold (MLS) $70,000 UNYREIS
- 2010-07-26 Listed $90,000 UNYREIS
Cash-flow waterfall
monthlySold comps — $/sqft
last 12 mo · ≤1 miLoading sold comps…