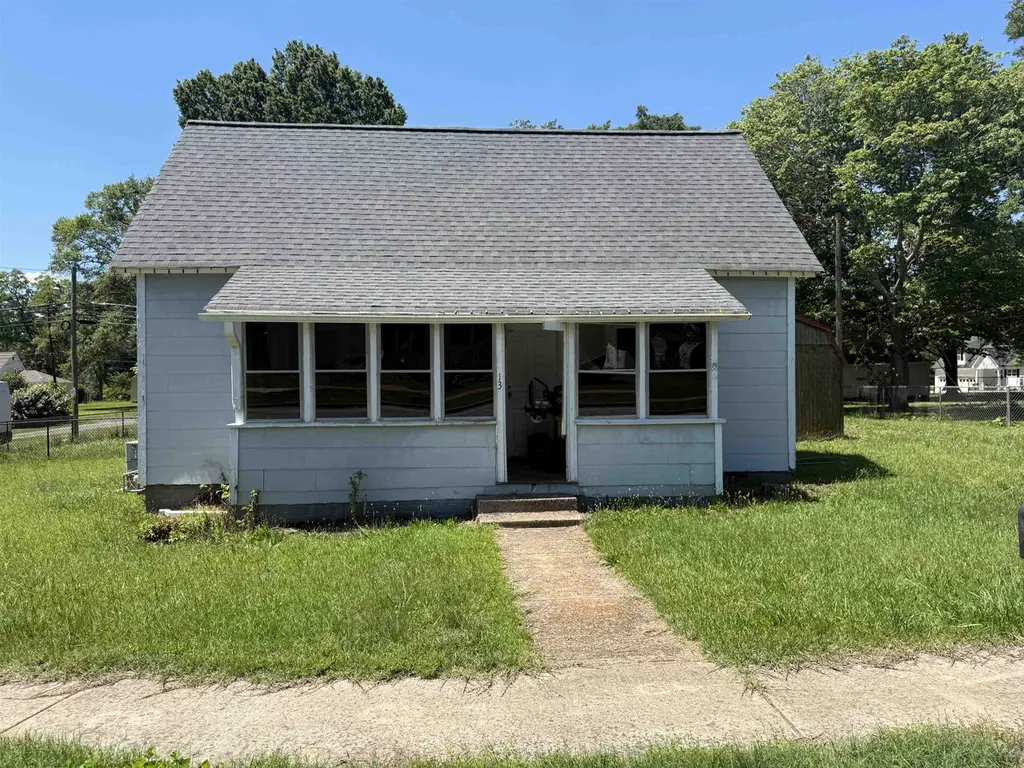
13 B St · Inman Mills, SC
Flood risk 1/10 · Minimal
- FEMA flood zone
- X (unshaded)
- Chance of flooding over 30 yrs
- 0.0%
- Est. flood insurance / yr
- $507 – $1,088
Fire risk 4/10 · Minor
- Est. fire insurance / yr
- $783 – $1,453
Heat risk 6/10 · Moderate
- Hot days now (above 105°F)
- 7 days/yr
- Hot days in 30 yrs
- 17 days/yr
Wind risk 2/10 · Minimal
- Chance of severe wind over 30 yrs
- 1.0%
Air-quality risk 4/10 · Minor
- Unhealthy air days now
- 4 days/yr
- Unhealthy air days in 30 yrs
- 4 days/yr
Risk factors via First Street. Map © Google.
Why this score? — see what drove the B+ grade
The composite is a weighted blend of 9 inputs, each scored 0–100. Each bar is that input's sub-score; the figure is the points it added to the 100-point composite (weight × sub-score).
- Cash flow +30.0/30.0
- ARV discount +15.0/15.0
- DSCR +10.0/10.0
- 1% rule +9.5/10.0
- Schools +4.1/10.0
- Livability +3.0/5.0
- Rent growth +2.9/5.0
- Condition / age +2.5/5.0
- Appreciation +0.0/10.0
$85,000
🖨 Deal sheet (PDF) 📄 Offer letter ✓ Due diligence
Listing remarks MLS
This property qualifies for 100% financing! This 2bd/1ba bungalow is charming and cute, and you will love sitting out on the enclosed front porch. House boasts upgrades such as new laminate flooring in kitchen, subway tile backsplash, new $6000 fence, painted cabinets with new hardware, sitting on 1/3 acre, and newer roof 2015. Back porch serves as laundry room with cabinets and mud sink. Refrigerator is included. Call Angie today for a showing 864-580-3701
Key facts
- Level lot
- Fenced backyard
- Enclosed front porch
Tags
Property features AI
Exterior
- Utilities: Public water; Public sewer
- Home design: Single family residence; One story
- Construction: See remarks for construction materials
- Exterior features: Porch; Level lot
Interior
- Bedrooms: One-level home
- Flooring: Carpet; Vinyl
- Bathrooms: 1 full bathroom
- Heating & cooling: Central air (electric); Natural gas forced air heating
- Interior features: Electric water heater
Neighborhood map
What this means for you Summary
Snapshot
- This is a 1-bed/1.0-bath single-family listed at $85k.
Deal economics
- At list price, monthly cash flow is $425 ($5k/yr) — positive.
- The deal already cash-flows at list — no discount required.
- Meets the 1% rule at list price ($1k rent vs $85k).
- Cap rate 12.3% vs local median 4.5% in Inman Mills — top-decile yield for the area; either an underpriced asset or a hidden risk that comps aren't pricing in. Stress-test before assuming the spread holds.
Location & tenants
- Location reads 59/100 on livability (#237 in SC) — a working-class tenant base; expect higher turnover. Strengths: cost of living A+; Watch: housing D+, employment D, crime F.
- Spartanburg 01 (rural): math 44% / reading 53% proficiency, ranked #14 of 80 in SC (top 18%) — families likely to look elsewhere, expect single-tenant / working-renter base with shorter leases.
- Zoned schools: Inman Elementary (math 57% / reading 47%, grade C-, #145 of 597 statewide, top 26%, 615 students, 100% FRL); T.E. Mabry Middle (math 31% / reading 43%, grade F, #97 of 229 statewide, top 42%, 444 students, 73% FRL); Chapman High (math 42% / reading 88%, grade B, #85 of 196 statewide, top 45%, 1,046 students, 59% FRL) — zoned schools average 77% FRL vs 45% district-wide (33 pts higher); higher-poverty schools than district average — tighter screening recommended.
- Market conditions: Rents rising (+1.8%/yr); 700 active listings in the ZIP; 3 comparable units currently listed for rent nearby; rentals leasing fast (median 12d on market — plan ~1-2 weeks tenant-placement turnaround); solid renter incomes; 3,129 units permitted in Spartanburg County in 2024 (40 in 5+ unit buildings).
Forward outlook
- Local home prices are declining (-3.0%/yr); year-one equity from $588 of loan paydown is wiped out by about $3k of value loss. Plan a longer hold.
- Spartanburg County population projected at +18% by 2050 — long-run rental-demand tailwind backs the buy-and-hold thesis.
- At projected returns (-3.0% appreciation + 1.8% rent growth), your $24k cash investment doubles in ~7 years — after that, you're playing with house money.
Negotiation context
- Only 3 days on market — expect competitive offers; lowballing is unlikely to land.
- 3 sale attempts since 10y ago with the ask held roughly flat each time — persistent listings suggest the price (not the market) is what's stuck; bring a comps-based counter.
Risks & watch-outs
- Watch-outs: built in 1900 — expect roof / HVAC / electrical / plumbing capex.
- Climate carrying-cost: extreme-heat days projected 7→17/yr by 2055 (HVAC capex compounding) — expect insurance premiums to compound above CPI over the hold.
Questions for the listing agent
- Built in 1900 — when were the roof, HVAC, electrical panel, plumbing, and water heater last replaced?
- Is there a deadline driving the sale (1031 exchange, divorce, estate, relocation)? That informs how much negotiation room exists.
- Schools are D-rated, which usually means shorter tenancies and higher turnover. Who's the typical renter profile here, and what's been the actual vacancy rate?
- Crime grade is F in this area — have there been break-ins, vandalism, or insurance claims at this property in the last 3 years? What carrier currently insures it and at what premium?
- What's the average days-on-market for RENTAL listings here right now (not sales)? A rising rental-DOM trend means longer vacancies and softer asking-rent achievability than the comps imply.
- What's the recent tenant-quality profile in this submarket — average credit score on applications, eviction rate, late-payment / NSF rate, and stable-employment percentage? A property-management company in the area should have these aggregated.
- How much new for-sale + rental construction is in the pipeline within 1–3 miles? Heavy new supply typically softens prices + rents 12–24 months out; constrained supply supports both.
Investment metrics
- 1% rule
- 1.45% ✓
- Cap rate
- 12.30%
- Cash-on-cash
- 21.45%
- DSCR
- 1.95
- GRM
- 5.8
CMA / ARV
- ARV (on-the-fly)
- $151,392
- Comps found
- 12
Show comp detail 12 sales within ~0.75 mi
| Address | Dist | Beds/Ba | Sqft | Sold | Price | $/sf | Match |
|---|---|---|---|---|---|---|---|
| 20 E St | 0.21mi | 2/1.0 (+1) | 912 (0%) | 11mo | $145,000 | $159 | 76 |
| 15 2nd St | 0.42mi | 2/2.0 (+1) | 944 (+4%) | 6mo | $204,900 | $217 | 61 |
| 54 Lyman Rd | 0.38mi | 2/1.0 (+1) | 859 (-6%) | 8mo | $49,000 | $57 | 61 |
| 15 H St | 0.35mi | 2/1.0 (+1) | 1,030 (+13%) | 1mo | $194,900 | $189 | 56 |
| 60 N Humphrey St | 0.39mi | 2/1.0 (+1) | 824 (-10%) | 11mo | $154,000 | $187 | 52 |
| 83 Blackstock Rd | 0.71mi | 2/1.0 (+1) | 867 (-5%) | 6mo | $187,000 | $216 | 48 |
| 591 Cothran Creek Rd | 0.43mi | 2/1.0 (+1) | 996 (+9%) | 13mo | $139,900 | $140 | 48 |
| 37 Bishop St | 0.57mi | 2/2.0 (+1) | 950 (+4%) | 11mo | $118,000 | $124 | 48 |
| 8 Cross St | 0.69mi | 2/2.0 (+1) | 909 (-0%) | 12mo | $155,100 | $171 | 48 |
| 24 1st St | 0.43mi | 2/1.0 (+1) | 1,024 (+12%) | 8mo | $170,000 | $166 | 48 |
| 408 4 th St | 0.50mi | 2/1.0 (+1) | 992 (+9%) | 11mo | $165,000 | $166 | 48 |
| 27 Culp St | 0.61mi | 2/1.0 (+1) | 840 (-8%) | 13mo | $63,000 | $75 | 43 |
Match score weights: distance 35% · size 25% · config 20% · recency 20%. Top-matched comps best support the ARV.
Projected returns pro-forma
-3.0% appreciation · 1.79% rent growth · sell at horizon
- IRR
- 12.7%
- Equity multiple
- 1.50×
- Total profit
- $11,834
- Equity at exit
- $12,674
- IRR
- 20.6%
- Equity multiple
- 2.65×
- Total profit
- $39,240
- Equity at exit
- $7,349
Cash invested: $23,800 (down + closing). Projections, not guarantees.
Landlord ↔ Tenant lean methodology
- Overall (STATE)
- 90 Strongly Landlord-Friendly
- State South Carolina
- 90 Strongly Landlord-Friendly · R+6
- County
- — inherits STATE
- City
- — inherits STATE
ZIP-level market 29349
- Home prices YoY
- -31.8%
- Rents YoY
- 1.8%
- Active inventory
- 700
- Price-to-rent
- 5.8×
Monthly cashflow live
- Estimated rent
- $1,229 medium interval (Pro) →
- Mortgage (P&I)
- −$446
- Tax from tax record
- −$65 /mo · $775/yr
- Insurance
- −$35
- HOA
- −$0
- Vacancy / Maint / Mgmt
- −$258
- Net cashflow
- $425
Break-even live
Sensitivity live
| Price | -10% $474 | -5% $449 | +0% $425 | +5% $401 | +10% $377 |
|---|---|---|---|---|---|
| Rent | -10% $328 | -5% $377 | +0% $425 | +5% $474 | +10% $523 |
| Rate | -1.0pp $468 | -0.5pp $447 | base $425 | +0.5pp $403 | +1.0pp $381 |
UW: 25.0% down · 7.5% · 30yr · 1.5% tax · 5.0% vac · 8.0% maint · 8.0% mgmt
Financing live
Cash to close
- Down payment
- $21,250
- Closing costs
- $2,550
- Reserves months
- —
- Total cash needed
- —
Loan-product check · same deal, 3 products live
Conventional
25% down · 7.5% · 30yr
- Down + closing
- —
- Monthly P&I
- —
- Monthly cashflow
- —
- DSCR
- —
- Eligible?
- —
Personal DTI + credit; lowest rate.
DSCR
20% down · 8.5% · 30yr
- Down + closing
- —
- Monthly P&I
- —
- Monthly cashflow
- —
- DSCR
- —
- Eligible?
- —
No personal income docs; deal must DSCR.
Hard money
10% down · 12.0% · 12mo
- Down + closing
- —
- Monthly P&I
- —
- Monthly cashflow
- —
- DSCR
- —
- Eligible?
- —
Short-term bridge; refi at stabilization.
Rent comps 3 comps
| Address | Beds | Baths | Sqft | Rent | $/sqft | DOM | Units | Dist |
|---|---|---|---|---|---|---|---|---|
| 240 4th St Inman, SC | 1.0–3.0 | 1.0–2.0 | 1356 | $1,134 | $0.84 | 5d | 12 | 0.21mi |
| 3 Pine Ln Inman, SC | 2.0 | 1.0 | 864 | $1,300 | $1.50 | 12d | 1 | 0.78mi |
| 400 Timberlake View Cir Inman, SC | 2.0–3.0 | 2.0 | 1050 | $1,040 | $0.99 | 21d | 1 | 0.83mi |
Listing history 2 events
-
2026-06-07remarks 328-char remark
-
2026-06-07$85,000 Pending 3 DOM
ⓘ Source: listings_history table (triggers on properties + properties_extension) + one-shot
backfill from property_details.listing_events for pre-trigger history.
Tax reassessment forecast SC · Resets to sale price
- Current annual tax
- $775 · $65/mo
- Projected year-2 tax
- $775 · $65/mo
- Expected delta
- $0/yr ($0/mo · 0.0%)
ⓘ Screening estimate from a state-policy table — verify with the county assessor before closing.
Climate risk First Street
- Flood 1/10 Low FEMA zone X (unshaded) · 0% chance over 30 yrs
- Wildfire 4/10 Moderate
- Heat 6/10 Major 7 d/yr ≥105°F today · 17 d/yr by 30 yrs out
- Wind 2/10 Low 100% chance of damaging wind over 30 yrs
- Air quality 4/10 Moderate 4 unhealthy d/yr today · 4 by 30 yrs out
Nearby sold comps map
Loading sold comps map…
Walkable amenities ~0.75 mi
Loading nearby amenities…
Taxation est. · year 1
- Rental income
- $14,751
- − Mortgage interest
- −$4,761
- − Property taxes
- −$775
- − Insurance
- −$425
- − Repairs & maintenance
- −$1,180
- − Management
- −$1,180
- − Depreciation
- −$2,473
- Taxable income
- $3,957
- Est. tax owed @ 24.0%
- −$950
- After-tax cash flow
- $4,155/yr
For passive investors: Depreciation is non-cash, so a rental often shows a tax loss while cash-flowing — sheltering income. Rental losses are passive: they offset passive income freely, and up to $25,000/yr can offset ordinary (W-2) income if you actively participate and your MAGI is under $100k (phasing out to $0 by $150k); unused losses carry forward. On sale, claimed depreciation is recaptured at up to 25%, and gains may owe capital-gains tax (a 1031 exchange can defer both). Figures are a year-1 estimate at your 24.0% rate — not tax advice; consult a CPA.
Schools (NCES district)
- District
- Spartanburg 01
- NCES district ID
- 4503480
- Math proficiency
- 44% ▼ -11.00%
- Reading proficiency
- 53% ▼ -1.00%
- Median HH income
- $44,612
- Composite
- 41.0/100
- National rank
- #3590
- State rank
- #14 of 80 in SC
Livability — Inman Mills
- Score
- 59/100
- State rank
- #237
- US rank
- #19819
Category grades
Schools grade is shown separately in the Schools card above.
Census & demographics
- Census place
- Inman Mills, SC
- County
- Spartanburg County · 258,607 people
- Metro
- Spartanburg, SC
- Population (ZIP)
- 39,083
- Household income
- $76,168
- Rent vs Own
- Severe rent burden
- 271.0
Population outlook (Spartanburg County) Hauer SSP2
- Today (2025)
- 325,495 people
- By 2030
- 338,800 · +4.1%
- By 2040
- 363,471 · +11.7%
- By 2050
- 384,156 · +18.0%
- By 2075
- 430,137 · +32.1%
- By 2100
- 442,733 · +36.0%
Race, ethnicity, and origin ACS 2023
- Neighborhood character
- Predominantly White (80%)
- Race & ethnicity
- White 80% Black 9% Hispanic / Latino 6% Two or more races 4% Asian 2%
- Hispanic origin (detail)
- Mexican 5%
- Common ancestry
- Subsaharan African 6% Serbian 3% Scotch-Irish 3%
- Foreign-born
- 9% · Canada
- Languages at home
- 86% English-only · Russian/Polish/Slavic 7% Spanish 3% Other Asian/Pacific 2%
Political lean MEDSL · Spartanburg
- 2024 margin
- Solid R (+33.6) · D 32.6% · R 66.2% · Other 1.2%
- 2008→2024 swing
- -12.0pp toward R · 2008: -21.6pp · 2024: -33.6pp
- All cycles
- 2024: R+33.6 2020: R+27.3 2016: R+30.0 2012: R+23.1 2008: R+21.6
Not yet ingested
- Civics
- —
Market trends
- HPI YoY
- ▼ -113.67%
- Current HPI
- 244.0359
- Rent YoY
- ▲ 1.79%
- Metro
- Spartanburg, SC
- State GDP YoY
- ▲ 4.51%
- F500 in state
- 2
Industry mix (Fortune 500 HQ in SC)
| Industry | F500 HQs | Revenue |
|---|---|---|
| Packaging | 1 | $7B |
|
||
Price history
+286.4% since first listed11 events — show timeline
- 2026-06-06 Pending — SPMLS
- 2026-06-03 Listed $85,000 SPMLS
- 2018-06-07 Sold (Public Records) $77,000 Public Records
- 2018-06-06 Sold (MLS) $77,000 SPMLS
- 2018-05-02 Contingent — SPMLS
- 2018-04-24 Price Changed $79,900 SPMLS
- 2018-04-15 Listed $82,900 SPMLS
- 2016-06-13 Sold (Public Records) $69,900 Public Records
- 2016-06-08 Sold (MLS) $69,900 SPMLS
- 2016-04-20 Listed $69,900 SPMLS
- 1987-03-01 Sold (Public Records) $22,000 Public Records
Property tax history
-6.2%/yrLatest (2025): $775 · +1.3% YoY. Source: county tax records.
Cash-flow waterfall
monthlySold comps — $/sqft
last 12 mo · ≤1 miLoading sold comps…