9707 Richmond Ave #109 · Houston, TX
Flood risk 6/10 · Moderate
- FEMA flood zone
- X (unshaded)
- Chance of flooding over 30 yrs
- 0.73%
- Est. flood insurance / yr
- $507 – $1,088
Fire risk 1/10 · Minimal
- Est. fire insurance / yr
- $1,222 – $2,270
Heat risk 9/10 · Severe
- Hot days now (above 110°F)
- 7 days/yr
- Hot days in 30 yrs
- 23 days/yr
Wind risk 9/10 · Severe
- Chance of severe wind over 30 yrs
- 99.0%
Air-quality risk 2/10 · Minimal
- Unhealthy air days now
- 2 days/yr
- Unhealthy air days in 30 yrs
- 2 days/yr
Risk factors via First Street. Map © Google.
Why this score? — see what drove the D+ grade
The composite is a weighted blend of 9 inputs, each scored 0–100. Each bar is that input's sub-score; the figure is the points it added to the 100-point composite (weight × sub-score).
- ARV discount +14.2/15.0
- Cash flow +12.8/30.0
- 1% rule +9.0/10.0
- DSCR +3.8/10.0
- Livability +3.7/5.0
- Condition / age +2.5/5.0
- Schools +2.1/10.0
- Rent growth +1.9/5.0
- Appreciation +0.0/10.0
$75,000
🖨 Deal sheet 📄 Offer letter ✓ Due diligence
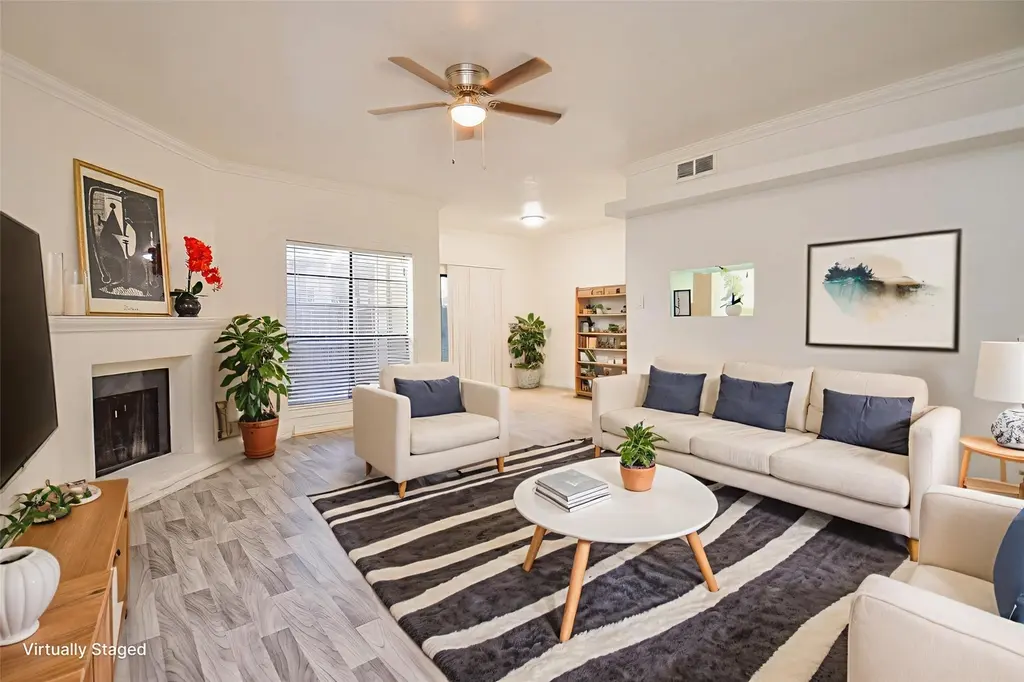
Listing remarks MLS
Quiet small complex beautifully maintained. Great ground floor unit, light and bright with lots of windows. Kitchen cabinets have been painted and countertops updated. Large living area with wood burning fireplace, high ceilings and crown molding throughout. Spacious master with massive (10x6) walk-in closet. Refrigerator, washer and dryer included. This one won't last long.
Key facts
- Gated community
- Community pool
- First floor unit
Tags
Property features AI
Finance
- Other: Pet restrictions apply
- HOA & community: Association: Creative Management; Monthly association fee ($259) covering insurance, grounds maintenance, structure maintenance, sewer, trash and water; Community pool and clubhouse; Gated community with controlled access and trash service
Exterior
- Parking: Carport; Detached carport; Additional / unassigned parking
- Security: Security gate; Controlled access; Smoke detectors
- Utilities: Public water; Public sewer
- Home design: Residential property; Single-story; Built in 1978; Full ownership; Slab foundation
- Construction: Cement siding and stucco exterior; Composition roof
- Exterior features: Deck; Patio; Storage; Association pool
Interior
- Kitchen: Dishwasher; Electric oven; Electric range; Disposal; Refrigerator
- Bedrooms: 1 possible bedroom
- Flooring: Tile; Vinyl
- Bathrooms: 1 full bathroom
- Heating & cooling: Central heating (electric); Central air conditioning (electric)
- Interior features: Breakfast bar; Laminate counters; Tub with shower; Programmable thermostat; Decorative fireplace
- Laundry & utility: Stacked washer/dryer
Neighborhood map
What this means for you Summary
Snapshot
- This is a 1-bed/1.0-bath condo listed at $75k.
Deal economics
- At list price, monthly cash flow is $-7 ($-87/yr) — negative.
- To cash-flow at today's rent, offer at most $74k (1.7% below list).
- Meets the 1% rule at list price ($1k rent vs $75k).
- Recommended offer: $73k (3.0% below list) — sets the bar for market timing.
- Cap rate 6.2% vs local median 3.2% in Houston — top-decile yield for the area; either an underpriced asset or a hidden risk that comps aren't pricing in. Stress-test before assuming the spread holds.
Location & tenants
- Location reads 74/100 on livability (#184 in TX, #4,771 nationally) — a middle-class / working-renter tenant base. Strengths: amenities A+, cost of living A+, housing A+; Watch: crime F.
- Alief ISD (urban): math 23% / reading 28% proficiency, ranked #717 of 826 in TX (top 87%) — low school quality limits family demand, transient renter base, plan for 1-2y turnover; 74% free/reduced lunch — lower-income household profile, screen leases tightly.
- Zoned schools: O'Donnell Middle (math 32% / reading 33%, grade F, #947 of 1,662 statewide, top 58%, 1,230 students, 89% FRL).
- Market conditions: Rents soft (-2.3%/yr); 243 active listings in the ZIP; 40 comparable units currently listed for rent nearby; rentals leasing fast (median 11d on market — plan ~1-2 weeks tenant-placement turnaround); 29,883 units permitted in Harris County in 2024 (8,621 in 5+ unit buildings).
Forward outlook
- Local home prices are declining (-3.0%/yr); year-one equity from $519 of loan paydown is wiped out by about $2k of value loss. Plan a longer hold.
- Harris County population projected at +47% by 2050 — long-run rental-demand tailwind backs the buy-and-hold thesis.
Negotiation context
- It's been on market 41 days — a 3% lower offer ($73k) is reasonable based on typical stale-listing flexibility.
- 4 sale attempts since 14y ago with the ask held roughly flat each time — persistent listings suggest the price (not the market) is what's stuck; bring a comps-based counter.
Risks & watch-outs
- Watch-outs: HOA is 25% of rent.
- Climate carrying-cost: major flood risk; severe wind risk, 99% chance of damaging wind over 30y; extreme-heat days projected 7→23/yr by 2055 (HVAC capex compounding) — expect insurance premiums to compound above CPI over the hold.
Questions for the listing agent
- What do current leases actually rent for vs. the listed asking? Can we see a recent rent roll and the last 12 months of T-12 income?
- It's been on market 41 days. Have you received any prior offers? Is the seller open to a 3% concession, seller financing, or rate buy-down credit?
- Built in 1978 — when were the roof, HVAC, electrical panel, plumbing, and water heater last replaced?
- What does the HOA fee cover, when was the last increase, and are there any pending special assessments or reserve-fund shortfalls?
- Any open or pending special assessments — roof, HVAC, plumbing, elevator, façade? What's the per-unit balance and payoff schedule, and is the seller paying it off at close or rolling it to the buyer?
- Is there a deadline driving the sale (1031 exchange, divorce, estate, relocation)? That informs how much negotiation room exists.
- Schools are D-rated, which usually means shorter tenancies and higher turnover. Who's the typical renter profile here, and what's been the actual vacancy rate?
- Crime grade is F in this area — have there been break-ins, vandalism, or insurance claims at this property in the last 3 years? What carrier currently insures it and at what premium?
- The area grade is low — what's the realistic commute time and amenity access for the typical tenant pool here? Any planned neighborhood developments (good or bad) we should know about?
- What's the average days-on-market for RENTAL listings here right now (not sales)? A rising rental-DOM trend means longer vacancies and softer asking-rent achievability than the comps imply.
- What's the recent tenant-quality profile in this submarket — average credit score on applications, eviction rate, late-payment / NSF rate, and stable-employment percentage? A property-management company in the area should have these aggregated.
- How much new apartment / multifamily construction is in the pipeline within 1–3 miles? Heavy new supply (>2% of stock underway) typically softens rents 12–24 months out; light construction supports rent growth.
Investment metrics
- 1% rule
- 1.40% ✓
- Cap rate
- 6.18%
- Cash-on-cash
- -0.42%
- DSCR
- 0.98
- GRM
- 6.0
CMA / ARV
- ARV (median comp)
- $88,035
- List price
- $75,000
- Delta
- -14.81%
- Verdict
- UNDERPRICED
- Comps
- 20 within 1.0 mi
Projected returns pro-forma
-3.0% appreciation · 0.0% rent growth · sell at horizon
- IRR
- -22.3%
- Equity multiple
- 0.26×
- Total profit
- $-15,479
- Equity at exit
- $11,183
- IRR
- -38.7%
- Equity multiple
- -0.20×
- Total profit
- $-25,097
- Equity at exit
- $6,485
Cash invested: $21,000 (down + closing). Projections, not guarantees.
Landlord ↔ Tenant lean methodology
- Overall (STATE)
- 87 Strongly Landlord-Friendly
- State Texas
- 87 Strongly Landlord-Friendly · R+5
- County
- — inherits STATE
- City
- — inherits STATE
ZIP-level market 77042
- Rents YoY
- -2.3%
- Active inventory
- 243
- Price-to-rent
- 6.0×
Monthly cashflow live
- Estimated rent
- $1,049 high interval (Pro) →
- Mortgage (P&I)
- −$393
- Tax from tax record
- −$152 /mo · $1,827/yr
- Insurance
- −$31
- HOA
- −$259
- Vacancy / Maint / Mgmt
- −$220
- Net cashflow
- $-7
Break-even live
UW: 25.0% down · 7.5% · 30yr · 1.5% tax · 5.0% vac · 8.0% maint · 8.0% mgmt
Financing live
Cash to close
- Down payment
- $18,750
- Closing costs
- $2,250
- Reserves months
- —
- Total cash needed
- —
Loan-product check · same deal, 3 products live
Conventional
25% down · 7.5% · 30yr
- Down + closing
- —
- Monthly P&I
- —
- Monthly cashflow
- —
- DSCR
- —
- Eligible?
- —
Personal DTI + credit; lowest rate.
DSCR
20% down · 8.5% · 30yr
- Down + closing
- —
- Monthly P&I
- —
- Monthly cashflow
- —
- DSCR
- —
- Eligible?
- —
No personal income docs; deal must DSCR.
Hard money
10% down · 12.0% · 12mo
- Down + closing
- —
- Monthly P&I
- —
- Monthly cashflow
- —
- DSCR
- —
- Eligible?
- —
Short-term bridge; refi at stabilization.
Rent comps 40 comps
| Address | Beds | Baths | Sqft | Rent | $/sqft | DOM | Units | Dist |
|---|---|---|---|---|---|---|---|---|
| 9707 Richmond Ave Houston, TX | 1.0–2.0 | 1.0–2.0 | 1000 | $1,250 | $1.25 | 43d | 4 | 0.05mi |
| 9850 Richmond Ave Houston, TX | 1.0–2.0 | 1.0–2.0 | 898 | $1,239 | $1.38 | 5d | 9 | 0.11mi |
| 3406 Woodchase Dr Houston, TX | 1.0 | 1.0 | 704 | $864 | $1.23 | 43d | 1 | 0.14mi |
| 3400 Woodchase Dr Houston, TX | 1.0–2.0 | 1.0–2.0 | 797 | $699 | $0.88 | 1d | 28 | 0.20mi |
| 3230 S Gessner Rd Houston, TX | 1.0–2.0 | 1.0 | 710 | $759 | $1.07 | 24d | 9 | 0.22mi |
| 9940 Richmond Ave Houston, TX | 1.0 | 1.0 | 733 | $925 | $1.26 | 15d | 1 | 0.23mi |
| 9940 Richmond Ave Unit 1047 Houston, TX | 1.0 | 1.0 | 753 | $1,072 | $1.42 | 11d | 1 | 0.24mi |
| 9940 Richmond Ave Unit 1165 Houston, TX | 1.0 | 1.0 | 753 | $1,029 | $1.37 | 2d | 1 | 0.24mi |
| 9940 Richmond Ave Unit 2047 Houston, TX | 2.0 | 2.0 | 1012 | $1,360 | $1.34 | 11d | 1 | 0.24mi |
| 9940 Richmond Ave Unit 9961 Houston, TX | 1.0 | 1.0 | 753 | $1,071 | $1.42 | 10d | 1 | 0.28mi |
| 9940 Richmond Ave Unit 324 Houston, TX | 1.0 | 1.0 | 753 | $1,032 | $1.37 | 7d | 1 | 0.28mi |
| 9940 Richmond Ave Unit 9991 Houston, TX | 1.0 | 1.0 | 733 | $945 | $1.29 | 43d | 1 | 0.28mi |
| 9940 Richmond Ave Unit 424 Houston, TX | 2.0 | 2.0 | 1012 | $1,325 | $1.31 | 7d | 1 | 0.28mi |
| 9940 Richmond Ave Unit 1162 Houston, TX | 1.0 | 1.0 | 753 | $1,032 | $1.37 | 5d | 1 | 0.28mi |
| 9940 Richmond Ave Unit 2162 Houston, TX | 2.0 | 2.0 | 1012 | $1,325 | $1.31 | 5d | 1 | 0.28mi |
| 9940 Richmond Ave Unit 9997 Houston, TX | 2.0 | 2.0 | 1012 | $1,349 | $1.33 | 10d | 1 | 0.28mi |
| 9940 Richmond Ave Unit 2148 Houston, TX | 2.0 | 2.0 | 1012 | $1,317 | $1.30 | 2d | 1 | 0.28mi |
| 10070 Westpark Dr Houston, TX | 1.0–2.0 | 1.0–2.0 | 720 | $785 | $1.09 | 1d | 18 | 0.28mi |
| 10010 Westpark Dr Unit 1104 Houston, TX | 1.0 | 1.0 | 710 | $1,069 | $1.51 | 24d | 1 | 0.28mi |
| 9946 Richmond Ave Houston, TX | 1.0 | 1.0 | 753 | $1,100 | $1.46 | 43d | 1 | 0.29mi |
| 9797 Meadowglen Ln Unit 1396 Houston, TX | 1.0 | 1.0 | 527 | $652 | $1.24 | 2d | 1 | 0.31mi |
| 10100 Westpark Dr Houston, TX | 1.0–2.0 | 1.0–2.0 | 891 | $729 | $0.82 | 16d | 21 | 0.31mi |
| 3777 S Gessner Rd Unit 1213 Houston, TX | 1.0 | 1.0 | 576 | $820 | $1.42 | 43d | 1 | 0.39mi |
| 3777 S Gessner Rd Unit 1811 WD Houston, TX | 2.0 | 1.0 | 876 | $1,140 | $1.30 | 7d | 1 | 0.39mi |
| 3777 S Gessner Rd Unit 1801 WD Houston, TX | 2.0 | 1.0 | 876 | $1,140 | $1.30 | 43d | 1 | 0.39mi |
| 3777 S Gessner Rd Unit 0315** WD Houston, TX | 2.0 | 1.0 | 876 | $1,240 | $1.42 | 43d | 1 | 0.39mi |
| 3777 S Gessner Rd Unit 1108 Houston, TX | 1.0 | 1.0 | 670 | $920 | $1.37 | 43d | 1 | 0.39mi |
| 10051 Westpark Dr #263 Houston, TX | 1.0 | 1.0 | 680 | $950 | $1.40 | 43d | 1 | 0.40mi |
| 3729 Thistlemont Dr Houston, TX | 1.0 | 1.0 | 872 | $1,053 | $1.21 | 7d | 1 | 0.41mi |
| 3750 Thistlemont Dr Houston, TX | 2.0 | 2.0 | 1080 | $1,400 | $1.30 | 43d | 1 | 0.44mi |
| 3030 Elmside Dr Houston, TX | 1.0–3.0 | 1.0–2.0 | 985 | $849 | $0.86 | 1d | 23 | 0.45mi |
| 2900 S Gessner Rd Unit 1047 Houston, TX | 1.0 | 1.0 | 715 | $750 | $1.05 | 11d | 1 | 0.45mi |
| 2900 S Gessner Rd Unit 2047 Houston, TX | 2.0 | 2.0 | 1076 | $947 | $0.88 | 2d | 1 | 0.45mi |
| 3900 Woodchase Dr Houston, TX | 1.0 | 1.0 | 612 | $1,200 | $1.96 | 12d | 2 | 0.50mi |
| 9850 Meadowglen Ln Unit 2047 Houston, TX | 2.0 | 2.0 | 894 | $841 | $0.94 | 2d | 1 | 0.51mi |
| 2900 S Gessner Rd Unit 2951 Houston, TX | 1.0 | 1.0 | 715 | $699 | $0.98 | 12d | 1 | 0.52mi |
| 2900 S Gessner Rd Unit 1162 Houston, TX | 1.0 | 1.0 | 715 | $710 | $0.99 | 7d | 1 | 0.52mi |
| 2900 S Gessner Rd Unit 2162 Houston, TX | 2.0 | 2.0 | 1076 | $955 | $0.89 | 7d | 1 | 0.52mi |
| 2900 S Gessner Rd Unit 2974 Houston, TX | 1.0 | 1.0 | 715 | $707 | $0.99 | 2d | 1 | 0.52mi |
| 2900 S Gessner Rd Unit 2974 Houston, TX | 1.0 | 1.0 | 715 | $785 | $1.10 | 12d | 1 | 0.52mi |
HOA detail condo
- Monthly dues
- $259 · $3,108/yr
- Assessments
- None detected in remarks — confirm with the listing agent.
Listing history 24 events
-
2026-06-18days on market $75,000 Active 41 DOM
-
2026-06-17days on market $75,000 Active 40 DOM
-
2026-06-16days on market $75,000 Active 39 DOM
-
2026-06-15days on market $75,000 Active 38 DOM
-
2026-06-13days on market $75,000 Active 36 DOM
-
2026-06-09days on market $75,000 Active 32 DOM
-
2026-06-08days on market $75,000 Active 31 DOM
-
2026-06-07days on market $75,000 Active 30 DOM
-
2026-06-04days on market $75,000 Active 27 DOM
-
2026-06-03days on market $75,000 Active 26 DOM
-
2026-06-02days on market $75,000 Active 25 DOM
-
2026-06-01days on market $75,000 Active 24 DOM
-
2026-05-31days on market $75,000 Active 23 DOM
-
2026-05-08$75,000 Active 718-char remark
-
2025-05-01historical $1,100
-
2025-02-21$1,100
-
2025-02-21historical $1,100
-
2024-10-27$1,100
-
2019-07-26soldstatus
-
2012-04-16soldstatus 377-char remark
Show marketing remark (377 chars)
Quiet small complex beautifully maintained. Great ground floor unit, light and bright with lots of windows. Kitchen cabinets have been painted and countertops updated. Large living area with wood burning fireplace, high ceilings and crown molding throughout. Spacious master with massive (10x6) walk-in closet. Refrigerator, washer and dryer included. This one won't last long.
-
2012-04-07historical 377-char remark
Show marketing remark (377 chars)
Quiet small complex beautifully maintained. Great ground floor unit, light and bright with lots of windows. Kitchen cabinets have been painted and countertops updated. Large living area with wood burning fireplace, high ceilings and crown molding throughout. Spacious master with massive (10x6) walk-in closet. Refrigerator, washer and dryer included. This one won't last long.
-
2012-03-22$35,000 377-char remark
Show marketing remark (377 chars)
Quiet small complex beautifully maintained. Great ground floor unit, light and bright with lots of windows. Kitchen cabinets have been painted and countertops updated. Large living area with wood burning fireplace, high ceilings and crown molding throughout. Spacious master with massive (10x6) walk-in closet. Refrigerator, washer and dryer included. This one won't last long.
-
2005-10-12soldstatus
-
2001-10-18soldstatus
ⓘ Source: listings_history table (triggers on properties + properties_extension) + one-shot
backfill from property_details.listing_events for pre-trigger history.
Tax reassessment forecast TX · Resets to sale price
- Current annual tax
- $1,827 · $152/mo
- Projected year-2 tax
- $1,827 · $152/mo
- Expected delta
- $0/yr ($0/mo · 0.0%)
ⓘ Screening estimate from a state-policy table — verify with the county assessor before closing.
Climate risk First Street
- Flood 6/10 Major FEMA zone X (unshaded) · 73% chance over 30 yrs
- Wildfire 1/10 Low
- Heat 9/10 Extreme 7 d/yr ≥110°F today · 23 d/yr by 30 yrs out
- Wind 9/10 Extreme 99% chance of damaging wind over 30 yrs
- Air quality 2/10 Low 2 unhealthy d/yr today · 2 by 30 yrs out
Nearby sold comps map
Loading sold comps map…
Walkable amenities ~0.75 mi
Loading nearby amenities…
Taxation est. · year 1
- Rental income
- $12,586
- − Mortgage interest
- −$4,201
- − Property taxes
- −$1,827
- − Insurance
- −$375
- − Repairs & maintenance
- −$1,007
- − Management
- −$1,007
- − HOA
- −$3,108
- − Depreciation
- −$2,182
- Taxable loss
- −$1,121
- Est. tax savings @ 24.0%
- +$269
- After-tax cash flow
- $182/yr
For passive investors: Depreciation is non-cash, so a rental often shows a tax loss while cash-flowing — sheltering income. Rental losses are passive: they offset passive income freely, and up to $25,000/yr can offset ordinary (W-2) income if you actively participate and your MAGI is under $100k (phasing out to $0 by $150k); unused losses carry forward. On sale, claimed depreciation is recaptured at up to 25%, and gains may owe capital-gains tax (a 1031 exchange can defer both). Figures are a year-1 estimate at your 24.0% rate — not tax advice; consult a CPA.
Schools (NCES district)
- District
- Alief ISD
- NCES district ID
- 4807830
- Math proficiency
- 23% ▼ -19.00%
- Reading proficiency
- 28% ▼ -8.00%
- Median HH income
- $37,775
- Composite
- 21.29/100
- National rank
- #8391
- State rank
- #717 of 826 in TX
Livability — Houston
- Score
- 74/100
- State rank
- #184
- US rank
- #4771
Category grades
Schools grade is shown separately in the Schools card above.
Census & demographics
- Census place
- Houston, TX
- County
- Harris County · 4,702,590 people
- City population
- 3,226,434
- Metro
- Houston-The Woodlands-Sugar Land, TX
- Population (ZIP)
- 38,721
- Household income
- $59,097
- Rent vs Own
- Severe rent burden
- 3994.0
Population outlook (Harris County) Hauer SSP2
- Today (2025)
- 5,571,493 people
- By 2030
- 6,089,821 · +9.3%
- By 2040
- 7,142,806 · +28.2%
- By 2050
- 8,185,864 · +46.9%
- By 2075
- 10,574,329 · +89.8%
- By 2100
- 12,109,958 · +117.4%
Race, ethnicity, and origin ACS 2023
- Neighborhood character
- Highly diverse neighborhood (Simpson 0.72)
- Race & ethnicity
- Hispanic / Latino 36% White 31% Black 24% Two or more races 18% Asian 6% Native American 1%
- Hispanic origin (detail)
- Mexican 14% Cuban 4%
- Common ancestry
- Romanian 1% Serbian 1% Italian 1%
- Foreign-born
- 35% · Canada, Jamaica, China
- Languages at home
- 55% English-only · Spanish 31% Other Indo-European 2% Russian/Polish/Slavic 2%
Political lean MEDSL · Harris
- 2024 margin
- Lean D (+5.5) · D 52.0% · R 46.4% · Other 1.6%
- 2008→2024 swing
- +3.9pp toward D · 2008: 1.6pp · 2024: 5.5pp
- All cycles
- 2024: D+5.5 2020: D+13.3 2016: D+12.4 2012: D+0.1 2008: D+1.6
Not yet ingested
- Civics
- —
Market trends
- HPI YoY
- ▼ -234.36%
- Current HPI
- 215.9671
- Rent YoY
- ▼ -2.30%
- Metro
- Houston-The Woodlands-Sugar Land, TX
- State GDP YoY
- ▲ 3.95%
- F500 in state
- 110
Industry mix (Fortune 500 HQ in TX)
| Industry | F500 HQs | Revenue |
|---|---|---|
| Energy | 16 | $1,198B |
|
||
| Technology | 5 | $198B |
|
||
| Engineering / Construction | 4 | $72B |
|
||
| Energy Services | 3 | $60B |
|
||
| Utilities | 3 | $41B |
|
||
| Healthcare | 2 | $330B |
|
||
Price history
+114.3% since first listed11 events — show timeline
- 2026-05-08 Listed $75,000 HARMLS
- 2025-05-01 Rental Removed $1,100 HARMLS
- 2025-02-21 Listed for Rent $1,100 HARMLS
- 2025-02-21 Rental Removed $1,100 HARMLS
- 2024-10-27 Listed for Rent $1,100 HARMLS
- 2019-07-26 Sold (Public Records) — Public Records
- 2012-04-16 Sold (MLS) — HARMLS
- 2012-04-07 Listing Removed — HARMLS
- 2012-03-22 Listed $35,000 HARMLS
- 2005-10-12 Sold (Public Records) — Public Records
- 2001-10-18 Sold (Public Records) — Public Records
Property tax history
+6.8%/yrLatest (2025): $1,827 · -2.6% YoY. Source: county tax records.
Cash-flow waterfall
monthlySold comps — $/sqft
last 12 mo · ≤1 miLoading sold comps…