3000 Clarcona Rd #520 · Clarcona, FL
Flood risk 1/10 · Minimal
- FEMA flood zone
- X (unshaded)
- Chance of flooding over 30 yrs
- 0.0%
- Est. flood insurance / yr
- $507 – $1,088
Fire risk 2/10 · Minimal
- Est. fire insurance / yr
- $947 – $1,759
Heat risk 8/10 · Major
- Hot days now (above 108°F)
- 5 days/yr
- Hot days in 30 yrs
- 16 days/yr
Wind risk 9/10 · Severe
- Chance of severe wind over 30 yrs
- 99.0%
Air-quality risk 1/10 · Minimal
- Unhealthy air days now
- 0 days/yr
- Unhealthy air days in 30 yrs
- 0 days/yr
Risk factors via First Street. Map © Google.
Why this score? — see what drove the C+ grade
The composite is a weighted blend of 9 inputs, each scored 0–100. Each bar is that input's sub-score; the figure is the points it added to the 100-point composite (weight × sub-score).
- Cash flow +25.4/30.0
- 1% rule +10.0/10.0
- DSCR +8.4/10.0
- ARV discount +7.5/15.0
- Schools +4.1/10.0
- Livability +3.1/5.0
- Condition / age +2.5/5.0
- Rent growth +1.8/5.0
- Appreciation +0.0/10.0
$78,000
🖨 Deal sheet 📄 Offer letter ✓ Due diligence
Listing remarks
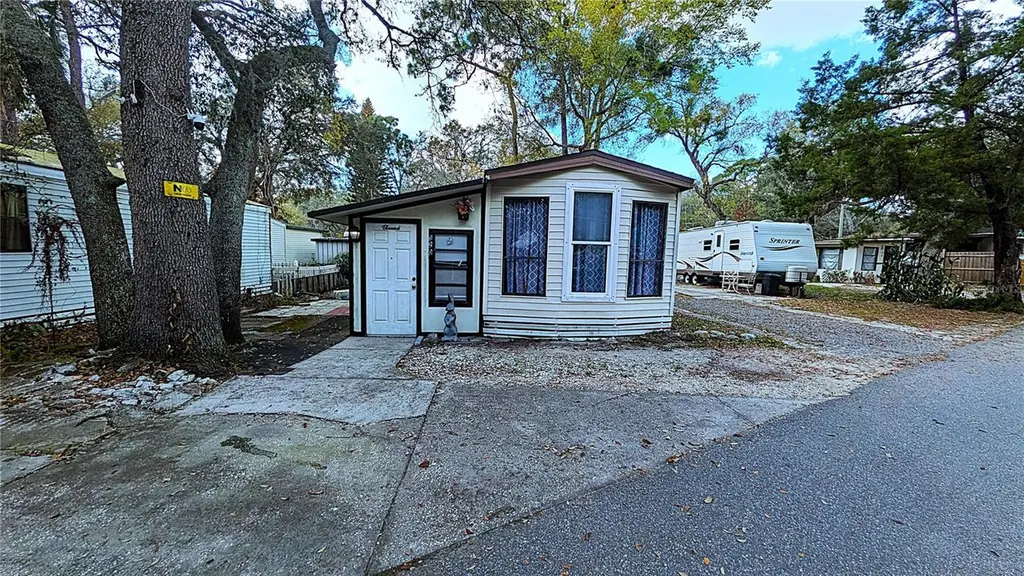
Located in the gated community of Clarcona Resort / Jellystone Park in Apopka, this 1-bedroom, 1-bath manufactured home features an expanded layout with two versatile bonus rooms, offering flexible space for a home office, hobby area, or guest use. The property includes a storage shed and a dedicated two-car parking area, providing practical outdoor functionality. Set among mature Florida landscaping, the setting offers a quiet and established environment. Ownership includes the land, adding long-term value and flexibility. Monthly HOA dues cover water, sewer, and trash, along with access to community amenities such as a swimming pool, clubhouse, playground, and mini golf. The community off
Key facts
- Expanded layout
- Storage shed
- 2,176 sq ft lot
Tags
Property features AI
Finance
- Other: No CDD; Homestead not claimed; Lease restrictions not required; Unfurnished
- HOA & community: Has HOA managed by Christina Wanner; Monthly HOA $284 (includes common area taxes, pool, grounds maintenance, management, trash, water); Community amenities: clubhouse, park, playground, pool, community mailbox, association-owned recreation, deed restrictions, golf carts allowed
Exterior
- Utilities: Public water; Public sewer; Water connected
- Home design: Manufactured home (single wide); Residential property; One story; Faces west
- Construction: Other construction materials; Other roof type; Slab foundation; Built on a 0.05 acre lot
- Exterior features: In-ground pool; Other exterior features; Paved road access
Interior
- Kitchen: Range
- Bedrooms: 1 bedroom
- Flooring: Vinyl
- Bathrooms: 1 full bathroom
- Heating & cooling: Electric heating; Other cooling
- Interior features: Range; Vinyl flooring
- Laundry & utility: Common area laundry
Neighborhood map
What this means for you Summary
Snapshot
- This is a 1-bed/1.0-bath manufactured listed at $78k.
Deal economics
- At list price, monthly cash flow is $179 ($2k/yr) — positive.
- The deal already cash-flows at list — no discount required.
- Meets the 1% rule at list price ($1k rent vs $78k).
- Recommended offer: $73k (6.0% below list) — sets the bar for market timing.
Location & tenants
- Location reads 61/100 on livability (#792 in FL) — a middle-class / working-renter tenant base. Strengths: cost of living A+, housing A+, crime B+; Watch: schools F, amenities F, commute F.
- Orange (suburban): math 46% / reading 51% proficiency, ranked #43 of 73 in FL (top 59%) — families likely to look elsewhere, expect single-tenant / working-renter base with shorter leases.
- Market conditions: Rents soft (-2.8%/yr); 564 active listings in the ZIP; 2 comparable units currently listed for rent nearby; 8,053 units permitted in Orange County in 2024 (3,133 in 5+ unit buildings).
Forward outlook
- Local home prices are declining (-3.0%/yr); year-one equity from $539 of loan paydown is wiped out by about $2k of value loss. Plan a longer hold.
- Orange County population projected at +52% by 2050 — long-run rental-demand tailwind backs the buy-and-hold thesis.
Negotiation context
- It's been on market 79 days — a 6% lower offer ($73k) is reasonable based on typical stale-listing flexibility.
- 4 sale attempts since 21y ago with the ask held roughly flat each time — persistent listings suggest the price (not the market) is what's stuck; bring a comps-based counter.
- Current owner paid $26k; list at $78k implies a 200% gain — meaningful room to come down on a strong offer.
Risks & watch-outs
- Watch-outs: HOA is 23% of rent.
- Climate carrying-cost: severe wind risk, 99% chance of damaging wind over 30y; extreme-heat days projected 5→16/yr by 2055 (HVAC capex compounding) — expect insurance premiums to compound above CPI over the hold.
Questions for the listing agent
- It's been on market 79 days. Have you received any prior offers? Is the seller open to a 6% concession, seller financing, or rate buy-down credit?
- What does the HOA fee cover, when was the last increase, and are there any pending special assessments or reserve-fund shortfalls?
- Why hasn't it sold? Are there any deal-killer items the seller is aware of (foundation, flood, title, zoning, code violations)?
- Is there a deadline driving the sale (1031 exchange, divorce, estate, relocation)? That informs how much negotiation room exists.
- Schools are F-rated, which usually means shorter tenancies and higher turnover. Who's the typical renter profile here, and what's been the actual vacancy rate?
- What's the average days-on-market for RENTAL listings here right now (not sales)? A rising rental-DOM trend means longer vacancies and softer asking-rent achievability than the comps imply.
- What's the recent tenant-quality profile in this submarket — average credit score on applications, eviction rate, late-payment / NSF rate, and stable-employment percentage? A property-management company in the area should have these aggregated.
- How much new for-sale + rental construction is in the pipeline within 1–3 miles? Heavy new supply typically softens prices + rents 12–24 months out; constrained supply supports both.
Investment metrics
- 1% rule
- 1.60% ✓
- Cap rate
- 9.05%
- Cash-on-cash
- 9.86%
- DSCR
- 1.44
- GRM
- 5.2
CMA / ARV
No comps found within radius.
Projected returns pro-forma
-3.0% appreciation · 0.0% rent growth · sell at horizon
- IRR
- -6.0%
- Equity multiple
- 0.79×
- Total profit
- $-4,678
- Equity at exit
- $11,630
- IRR
- -2.3%
- Equity multiple
- 0.88×
- Total profit
- $-2,727
- Equity at exit
- $6,744
Cash invested: $21,840 (down + closing). Projections, not guarantees.
Landlord ↔ Tenant lean methodology
- Overall (STATE)
- 87 Strongly Landlord-Friendly
- State Florida
- 87 Strongly Landlord-Friendly · R+3
- County
- — inherits STATE
- City
- — inherits STATE
ZIP-level market 32703
- Rents YoY
- -2.8%
- Active inventory
- 564
- Price-to-rent
- 5.2×
Monthly cashflow live
- Estimated rent
- $1,246 medium interval (Pro) →
- Mortgage (P&I)
- −$409
- Tax from tax record
- −$79 /mo · $952/yr
- Insurance
- −$32
- HOA
- −$284
- Vacancy / Maint / Mgmt
- −$262
- Net cashflow
- $179
Break-even live
UW: 25.0% down · 7.5% · 30yr · 1.5% tax · 5.0% vac · 8.0% maint · 8.0% mgmt
Financing live
Cash to close
- Down payment
- $19,500
- Closing costs
- $2,340
- Reserves months
- —
- Total cash needed
- —
Loan-product check · same deal, 3 products live
Conventional
25% down · 7.5% · 30yr
- Down + closing
- —
- Monthly P&I
- —
- Monthly cashflow
- —
- DSCR
- —
- Eligible?
- —
Personal DTI + credit; lowest rate.
DSCR
20% down · 8.5% · 30yr
- Down + closing
- —
- Monthly P&I
- —
- Monthly cashflow
- —
- DSCR
- —
- Eligible?
- —
No personal income docs; deal must DSCR.
Hard money
10% down · 12.0% · 12mo
- Down + closing
- —
- Monthly P&I
- —
- Monthly cashflow
- —
- DSCR
- —
- Eligible?
- —
Short-term bridge; refi at stabilization.
Rent comps 2 comps
| Address | Beds | Baths | Sqft | Rent | $/sqft | DOM | Units | Dist |
|---|---|---|---|---|---|---|---|---|
| 3000 Clarcona Rd Apopka, FL | 1.0–2.0 | 1.0–2.0 | 608 | $950 | $1.56 | 1d | 6 | 0.17mi |
| 3000 Clarcona Rd Apopka, FL | 1.0–2.0 | 1.0–2.0 | 608 | $900 | $1.48 | 7d | 6 | 0.17mi |
HOA detail
- Monthly dues
- $284 · $3,408/yr
- Likely covers
- watersewertrashlandscapingpoolsecurity
Listing history 21 events
-
2026-06-18days on market $78,000 Active 79 DOM
-
2026-06-17days on market $78,000 Active 78 DOM
-
2026-06-16days on market $78,000 Active 77 DOM
-
2026-06-15days on market $78,000 Active 76 DOM
-
2026-06-13days on market $78,000 Active 74 DOM
-
2026-06-13days on market $78,000 Active 73 DOM
-
2026-06-09days on market $78,000 Active 70 DOM
-
2026-06-08days on market $78,000 Active 69 DOM
-
2026-06-07days on market $78,000 Active 68 DOM
-
2026-06-04days on market $78,000 Active 65 DOM
-
2026-06-03days on market $78,000 Active 64 DOM
-
2026-06-02days on market $78,000 Active 63 DOM
-
2026-06-02days on market $78,000 Active 62 DOM
-
2026-05-31days on market $78,000 Active 61 DOM
-
2026-04-01$78,000 Active
-
2010-11-05$14,900
-
2006-03-02historical
-
2005-12-30$35,000
-
2005-07-15historical
-
2005-06-13$35,000
-
2000-06-30soldstatus $26,000
ⓘ Source: listings_history table (triggers on properties + properties_extension) + one-shot
backfill from property_details.listing_events for pre-trigger history.
Tax reassessment forecast FL · Resets to sale price
- Current annual tax
- $952 · $79/mo
- Projected year-2 tax
- $952 · $79/mo
- Expected delta
- $0/yr ($0/mo · 0.0%)
ⓘ Screening estimate from a state-policy table — verify with the county assessor before closing.
Climate risk First Street
- Flood 1/10 Low FEMA zone X (unshaded) · 0% chance over 30 yrs
- Wildfire 2/10 Low
- Heat 8/10 Severe 5 d/yr ≥108°F today · 16 d/yr by 30 yrs out
- Wind 9/10 Extreme 99% chance of damaging wind over 30 yrs
- Air quality 1/10 Low 0 unhealthy d/yr today · 0 by 30 yrs out
Nearby sold comps map
Loading sold comps map…
Walkable amenities ~0.75 mi
Loading nearby amenities…
Taxation est. · year 1
- Rental income
- $14,952
- − Mortgage interest
- −$4,369
- − Property taxes
- −$952
- − Insurance
- −$390
- − Repairs & maintenance
- −$1,196
- − Management
- −$1,196
- − HOA
- −$3,408
- − Depreciation
- −$2,269
- Taxable income
- $1,171
- Est. tax owed @ 24.0%
- −$281
- After-tax cash flow
- $1,873/yr
For passive investors: Depreciation is non-cash, so a rental often shows a tax loss while cash-flowing — sheltering income. Rental losses are passive: they offset passive income freely, and up to $25,000/yr can offset ordinary (W-2) income if you actively participate and your MAGI is under $100k (phasing out to $0 by $150k); unused losses carry forward. On sale, claimed depreciation is recaptured at up to 25%, and gains may owe capital-gains tax (a 1031 exchange can defer both). Figures are a year-1 estimate at your 24.0% rate — not tax advice; consult a CPA.
Schools (NCES district)
- District
- Orange
- NCES district ID
- 1201440
- Math proficiency
- 46% ▼ -9.00%
- Reading proficiency
- 51% ▼ -2.00%
- Median HH income
- $49,350
- Composite
- 41.47/100
- National rank
- #3461
- State rank
- #43 of 73 in FL
Livability — Clarcona
- Score
- 61/100
- State rank
- #792
- US rank
- #18165
Category grades
Schools grade is shown separately in the Schools card above.
Census & demographics
- Census place
- Clarcona, FL
- County
- Orange County · 1,471,359 people
- Metro
- Orlando-Kissimmee-Sanford, FL
- Population (ZIP)
- 59,269
- Household income
- $72,880
- Rent vs Own
- Severe rent burden
- 2191.0
Population outlook (Orange County) Hauer SSP2
- Today (2025)
- 1,618,226 people
- By 2030
- 1,787,404 · +10.5%
- By 2040
- 2,125,621 · +31.4%
- By 2050
- 2,454,016 · +51.6%
- By 2075
- 3,173,711 · +96.1%
- By 2100
- 3,607,781 · +122.9%
Race, ethnicity, and origin ACS 2023
- Neighborhood character
- Highly diverse neighborhood (Simpson 0.71)
- Race & ethnicity
- White 35% Hispanic / Latino 30% Black 28% Two or more races 16% Asian 3%
- Hispanic origin (detail)
- Mexican 6% Puerto Rican 12% Cuban 3% Dominican 2%
- Common ancestry
- Hispanic 4% Romanian 1% Italian 1%
- Foreign-born
- 18% · Canada, Jamaica, Vietnam
- Languages at home
- 71% English-only · Spanish 22% French/Haitian/Cajun 3% Other Indo-European 1%
Political lean MEDSL · Orange
- 2024 margin
- D (+13.6) · D 56.1% · R 42.5% · Other 1.3%
- 2008→2024 swing
- -5.0pp toward R · 2008: 18.6pp · 2024: 13.6pp
- All cycles
- 2024: D+13.6 2020: D+23.1 2016: D+24.6 2012: D+18.2 2008: D+18.6
Not yet ingested
- Civics
- —
Market trends
- HPI YoY
- ▼ -206.30%
- Current HPI
- 319.2139
- Rent YoY
- ▼ -2.75%
- Metro
- Orlando-Kissimmee-Sanford, FL
- State GDP YoY
- ▲ 3.28%
- F500 in state
- 36
Industry mix (Fortune 500 HQ in FL)
| Industry | F500 HQs | Revenue |
|---|---|---|
| Industrial Technology | 2 | $29B |
|
||
| Insurance | 2 | $17B |
|
||
| Retail | 1 | $60B |
|
||
| Technology Distribution | 1 | $58B |
|
||
| Homebuilding | 1 | $35B |
|
||
| Technology Manufacturing | 1 | $35B |
|
||
Price history
+200.0% since first listed7 events — show timeline
- 2026-04-01 Listed $78,000 Stellar MLS as Distributed by MLS Grid
- 2010-11-05 Listed $14,900 Stellar MLS as Distributed by MLS Grid
- 2006-03-02 Listing Removed — Stellar MLS as Distributed by MLS Grid
- 2005-12-30 Listed $35,000 Stellar MLS as Distributed by MLS Grid
- 2005-07-15 Listing Removed — Stellar MLS as Distributed by MLS Grid
- 2005-06-13 Listed $35,000 Stellar MLS as Distributed by MLS Grid
- 2000-06-30 Sold (Public Records) $26,000 Public Records
Property tax history
+9.9%/yrLatest (2025): $952 · +306.9% YoY. Source: county tax records.
Cash-flow waterfall
monthlySold comps — $/sqft
last 12 mo · ≤1 miLoading sold comps…