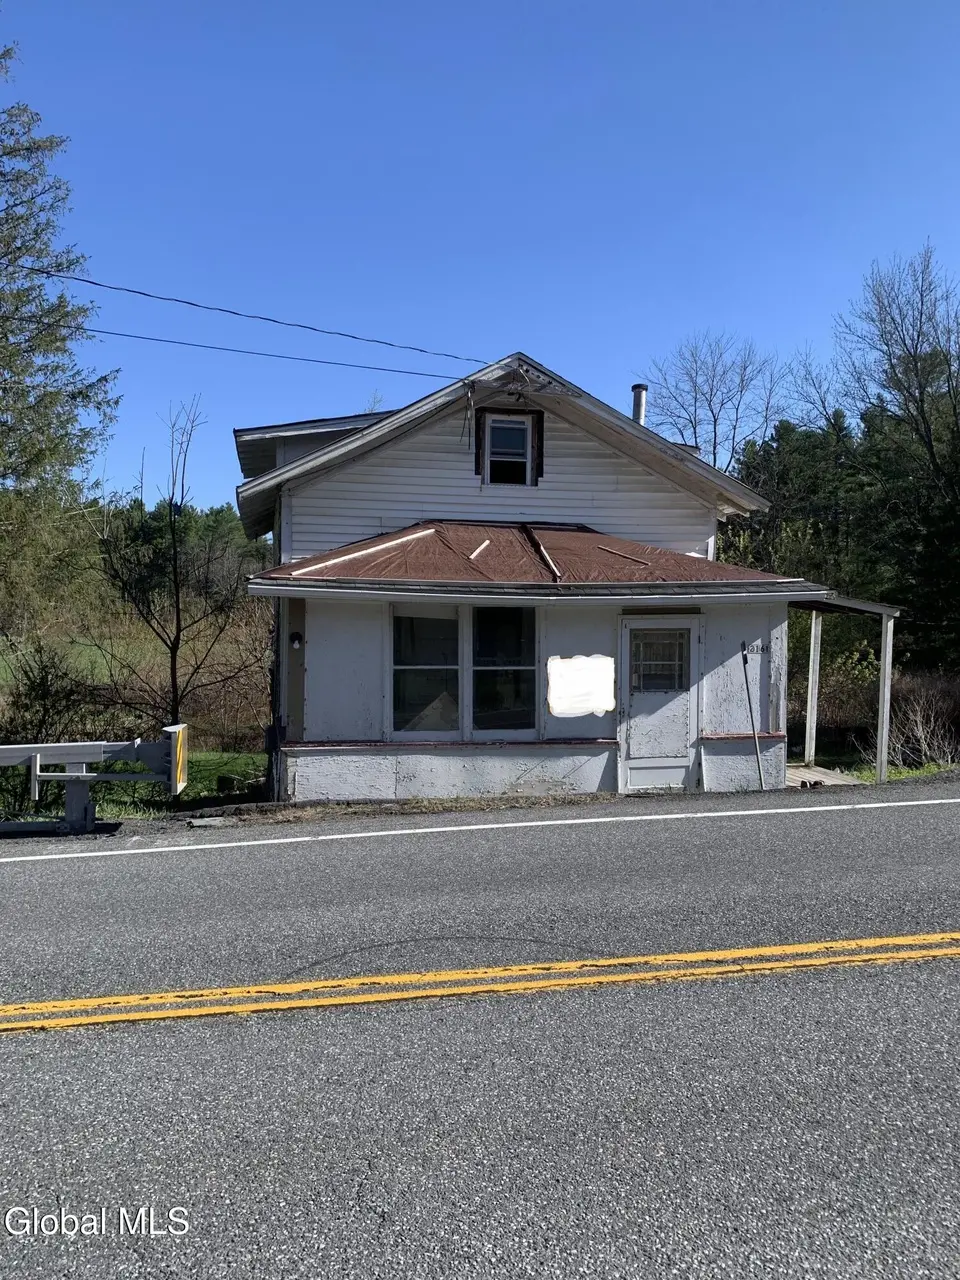
2161 Helderberg Trl · Delanson, NY
Flood risk 5/10 · Moderate
- FEMA flood zone
- A
- Chance of flooding over 30 yrs
- 0.24%
- Est. flood insurance / yr
- $946 – $6,584
Fire risk 2/10 · Minimal
- Est. fire insurance / yr
- $691 – $1,283
Heat risk 2/10 · Minimal
- Hot days now (above 92°F)
- 8 days/yr
- Hot days in 30 yrs
- 18 days/yr
Wind risk 3/10 · Minor
- Chance of severe wind over 30 yrs
- 4.0%
Air-quality risk 1/10 · Minimal
- Unhealthy air days now
- 0 days/yr
- Unhealthy air days in 30 yrs
- 0 days/yr
Risk factors via First Street. Map © Google.
Why this score? — see what drove the B+ grade
The composite is a weighted blend of 9 inputs, each scored 0–100. Each bar is that input's sub-score; the figure is the points it added to the 100-point composite (weight × sub-score).
- Cash flow +30.0/30.0
- 1% rule +10.0/10.0
- DSCR +10.0/10.0
- Appreciation +8.2/10.0
- ARV discount +7.5/15.0
- Schools +4.9/10.0
- Livability +3.4/5.0
- Rent growth +2.5/5.0
- Condition / age +2.5/5.0
$52,900
🖨 Deal sheet 📄 Offer letter ✓ Due diligence
Listing remarks MLS
Cute house redone, new floor covering, kitchen, large back yard, nice back deck overlooking farmers fields. Short drive to ALbany. Very economical, low taxes. Also now available for rent@$650.00 -- Very Good Condition
Key facts
- 0.38 acre lot
- Parking
- Built 1899
Property features AI
Exterior
- Parking: Off-street parking for 1 vehicle
- Utilities: Other sewer; Other water source
- Home design: Single family residence; Living area includes finished below-grade space
- Construction: Combination foundation; Other construction materials
- Exterior features: Other exterior features; Sloped lot; Waterfront on Fox Creek; 176 feet main road frontage
Interior
- Kitchen: Kitchen on the first floor
- Bedrooms: Two bedrooms on the second floor
- Bathrooms: One full bathroom on the first floor
- Heating & cooling: Forced air heating; Other heating
- Interior features: 6 total rooms; Full basement (combination/other); Other appliances
- Laundry & utility: Basement utility/other room
Neighborhood map
What this means for you Summary
Snapshot
- This is a 1-bed/1.0-bath single-family listed at $53k.
Deal economics
- At list price, monthly cash flow is $-26 ($-313/yr) — negative.
- To cash-flow at today's rent, offer at most $48k (8.7% below list).
- Meets the 1% rule at list price ($940 rent vs $53k).
- Recommended offer: $48k (8.7% below list) — sets the bar for cash-flow.
Location & tenants
- Location reads 67/100 on livability (#601 in NY) — a middle-class / working-renter tenant base. Strengths: employment A+, housing A+, schools A-; Watch: crime D-, amenities F, commute F.
- Berne-Knox-Westerlo Central School District (rural): math 54% / reading 57% proficiency, ranked #275 of 590 in NY (top 47%) — acceptable for families but not a draw, mixed tenant base, ~2y average lease.
- Market conditions: 22 active listings in the ZIP; 675 units permitted in Albany County in 2024 (451 in 5+ unit buildings).
Forward outlook
- In year one you build about $4k of equity ($366 loan paydown + $3k appreciation (6.4% local appreciation)).
- Albany County population projected at +9% by 2050 — modest demand growth; plan on rents tracking national, not racing it.
- At projected returns (6.4% appreciation + 3.0% rent growth), your $15k cash investment doubles in ~4 years — after that, you're playing with house money.
- By year 9, paydown + projected appreciation supports a ~$34k cash-out refi (75% LTV) — recoverable capital for the next deal without selling this one.
Negotiation context
- Only 11 days on market — expect competitive offers; lowballing is unlikely to land.
- 5 sale attempts since 16y ago; this cycle's ask has dropped $7k (12%) from the opening price — seller is motivated, your offer sets the floor, not the list.
Risks & watch-outs
- Watch-outs: property tax is 3.5% of price; flood insurance adds $314/mo; built in 1899 — expect roof / HVAC / electrical / plumbing capex.
- Climate carrying-cost: in FEMA flood zone A (mandatory federal flood insurance) — expect insurance premiums to compound above CPI over the hold.
Questions for the listing agent
- What do current leases actually rent for vs. the listed asking? Can we see a recent rent roll and the last 12 months of T-12 income?
- Built in 1899 — when were the roof, HVAC, electrical panel, plumbing, and water heater last replaced?
- Property tax is high relative to price — has the assessment been appealed recently, and will the sale trigger a re-assessment?
- What's the actual annual flood-insurance premium (NFIP or private), and is the property in a SFHA with mandatory coverage?
- Is there a deadline driving the sale (1031 exchange, divorce, estate, relocation)? That informs how much negotiation room exists.
- Schools are A-rated — typically a magnet for longer-tenancy family renters. What's the average tenant stay here, and is there a school-zone premium baked into asking?
- Crime grade is D in this area — have there been break-ins, vandalism, or insurance claims at this property in the last 3 years? What carrier currently insures it and at what premium?
- What's the average days-on-market for RENTAL listings here right now (not sales)? A rising rental-DOM trend means longer vacancies and softer asking-rent achievability than the comps imply.
- What's the recent tenant-quality profile in this submarket — average credit score on applications, eviction rate, late-payment / NSF rate, and stable-employment percentage? A property-management company in the area should have these aggregated.
- How much new for-sale + rental construction is in the pipeline within 1–3 miles? Heavy new supply typically softens prices + rents 12–24 months out; constrained supply supports both.
Investment metrics
- 1% rule
- 1.78% ✓
- Cap rate
- 12.82%
- Cash-on-cash
- 23.31%
- DSCR
- 2.04
- GRM
- 4.7
CMA / ARV
No comps found within radius.
Projected returns pro-forma
6.4% appreciation · 3.0% rent growth · sell at horizon
- IRR
- 14.8%
- Equity multiple
- 2.02×
- Total profit
- $15,124
- Equity at exit
- $34,585
- IRR
- 15.1%
- Equity multiple
- 4.11×
- Total profit
- $46,007
- Equity at exit
- $63,898
Cash invested: $14,812 (down + closing). Projections, not guarantees.
Landlord ↔ Tenant lean methodology
- Overall (STATE)
- 15 Strongly Tenant-Friendly
- State New York
- 15 Strongly Tenant-Friendly · D+10
- County
- — inherits STATE
- City
- — inherits STATE
ZIP-level market 12023
- Home prices YoY
- 1.9%
- Active inventory
- 22
- Price-to-rent
- 4.7×
Monthly cashflow live
- Estimated rent
- $940 medium interval (Pro) →
- Mortgage (P&I)
- −$277
- Tax from tax record
- −$156 /mo · $1,866/yr
- Insurance
- −$22
- Flood insurance flood zone
- −$314 /mo · $3,765/yr
- HOA
- −$0
- Vacancy / Maint / Mgmt
- −$197
- Net cashflow
- $-26
Break-even live
UW: 25.0% down · 7.5% · 30yr · 1.5% tax · 5.0% vac · 8.0% maint · 8.0% mgmt
Financing live
Cash to close
- Down payment
- $13,225
- Closing costs
- $1,587
- Reserves months
- —
- Total cash needed
- —
Loan-product check · same deal, 3 products live
Conventional
25% down · 7.5% · 30yr
- Down + closing
- —
- Monthly P&I
- —
- Monthly cashflow
- —
- DSCR
- —
- Eligible?
- —
Personal DTI + credit; lowest rate.
DSCR
20% down · 8.5% · 30yr
- Down + closing
- —
- Monthly P&I
- —
- Monthly cashflow
- —
- DSCR
- —
- Eligible?
- —
No personal income docs; deal must DSCR.
Hard money
10% down · 12.0% · 12mo
- Down + closing
- —
- Monthly P&I
- —
- Monthly cashflow
- —
- DSCR
- —
- Eligible?
- —
Short-term bridge; refi at stabilization.
Listing history 9 events
-
2026-06-18days on market $52,900 Active 11 DOM
-
2026-06-17days on market $52,900 Active 10 DOM
-
2026-06-16days on market $52,900 Active 9 DOM
-
2026-06-15days on market $52,900 Active 8 DOM
-
2026-06-13days on market $52,900 Active 6 DOM
-
2026-06-12pricedays on market $52,900 Active 5 DOM
-
2026-06-09days on market $59,900 Active 2 DOM
-
2026-06-08remarks 296-char remark
-
2026-06-08$59,900 Active 1 DOM
ⓘ Source: listings_history table (triggers on properties + properties_extension) + one-shot
backfill from property_details.listing_events for pre-trigger history.
Tax reassessment forecast NY · Partial reset (capped growth)
- Current annual tax
- $1,866 · $156/mo
- Projected year-2 tax
- $1,866 · $156/mo
- Expected delta
- $0/yr ($0/mo · 0.0%)
ⓘ Screening estimate from a state-policy table — verify with the county assessor before closing.
Climate risk First Street
- Flood 5/10 Major FEMA zone A · 24% chance over 30 yrs
- Wildfire 2/10 Low
- Heat 2/10 Low 8 d/yr ≥92°F today · 18 d/yr by 30 yrs out
- Wind 3/10 Moderate 4% chance of damaging wind over 30 yrs
- Air quality 1/10 Low 0 unhealthy d/yr today · 0 by 30 yrs out
Nearby sold comps map
Loading sold comps map…
Walkable amenities ~0.75 mi
Loading nearby amenities…
Taxation est. · year 1
- Rental income
- $11,281
- − Mortgage interest
- −$2,963
- − Property taxes
- −$1,866
- − Insurance
- −$4,030
- − Repairs & maintenance
- −$902
- − Management
- −$902
- − Depreciation
- −$1,539
- Taxable loss
- −$922
- Est. tax savings @ 24.0%
- +$221
- After-tax cash flow
- $-92/yr
For passive investors: Depreciation is non-cash, so a rental often shows a tax loss while cash-flowing — sheltering income. Rental losses are passive: they offset passive income freely, and up to $25,000/yr can offset ordinary (W-2) income if you actively participate and your MAGI is under $100k (phasing out to $0 by $150k); unused losses carry forward. On sale, claimed depreciation is recaptured at up to 25%, and gains may owe capital-gains tax (a 1031 exchange can defer both). Figures are a year-1 estimate at your 24.0% rate — not tax advice; consult a CPA.
Schools (NCES district)
- District
- Berne-Knox-Westerlo Central School District
- NCES district ID
- 3604650
- Math proficiency
- 54% ▲ 1.00%
- Reading proficiency
- 57% ▲ 3.00%
- Median HH income
- $68,684
- Composite
- 49.13/100
- National rank
- #2046
- State rank
- #275 of 590 in NY
Livability — Delanson
- Score
- 67/100
- State rank
- #601
- US rank
- #10899
Category grades
Schools grade is shown separately in the Schools card above.
Census & demographics
- Population (ZIP)
- 2,364
Population outlook (Albany County) Hauer SSP2
- Today (2025)
- 320,794 people
- By 2030
- 327,401 · +2.1%
- By 2040
- 338,218 · +5.4%
- By 2050
- 348,467 · +8.6%
- By 2075
- 381,693 · +19.0%
- By 2100
- 393,809 · +22.8%
Race, ethnicity, and origin ACS 2023
- Neighborhood character
- Predominantly White (96%)
- Race & ethnicity
- White 96% Two or more races 4%
- Common ancestry
- Italian 5% Lithuanian 4% Romanian 4%
- Foreign-born
- 0% · Canada
Political lean MEDSL · Albany
- 2024 margin
- Strong D (+25.8) · D 62.9% · R 37.1%
- 2008→2024 swing
- -3.6pp toward R · 2008: 29.4pp · 2024: 25.8pp
- All cycles
- 2024: D+25.8 2020: D+31.4 2016: D+24.3 2012: D+31.0 2008: D+29.4
Not yet ingested
- Civics
- —
Market trends
- HPI YoY
- ▲ 6.40%
- Current HPI
- 333.7141
- Rent YoY
- —
- Metro
- —
- State GDP YoY
- ▲ 2.60%
- F500 in state
- 92
Industry mix (Fortune 500 HQ in NY)
| Industry | F500 HQs | Revenue |
|---|---|---|
| Financial Services | 10 | $950B |
|
||
| Consumer Goods | 9 | $162B |
|
||
| Insurance | 4 | $225B |
|
||
| Telecommunications | 2 | $144B |
|
||
| Pharmaceuticals | 2 | $112B |
|
||
| Media / Entertainment | 2 | $69B |
|
||
Price history
+22.2% since first listed14 events — show timeline
- 2026-06-07 Listed $59,900 Global MLS
- 2021-07-22 Listing Removed — Global MLS
- 2021-07-15 Price Changed $65,000 Global MLS
- 2021-07-07 Price Changed $70,000 Global MLS
- 2021-06-30 Listed $75,000 Global MLS
- 2015-03-13 Sold (Public Records) $59,500 Public Records
- 2015-03-06 Sold (MLS) $59,300 Global MLS
- 2014-10-24 Listing Removed — Global MLS
- 2014-05-09 Listed $59,400 Global MLS
- 2013-10-01 Listing Removed — Global MLS
- 2013-06-14 Listed $69,900 Global MLS
- 2011-03-11 Sold (MLS) $35,000 Global MLS
- 2010-11-30 Listing Removed — Global MLS
- 2010-10-04 Listed $49,000 Global MLS
Property tax history
+1.2%/yrLatest (2025): $1,866 · +11.7% YoY. Source: county tax records.
Cash-flow waterfall
monthlySold comps — $/sqft
last 12 mo · ≤1 miLoading sold comps…