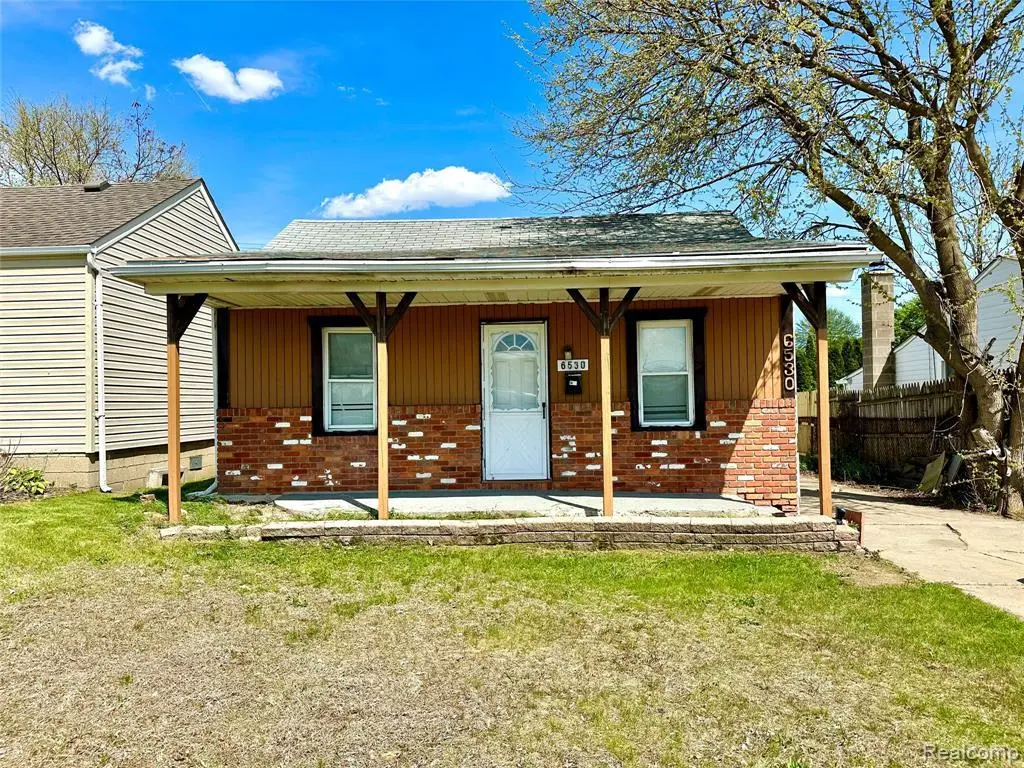
6530 N Gulley Rd · Dearborn Heights, MI
Flood risk 1/10 · Minimal
- FEMA flood zone
- X (unshaded)
- Chance of flooding over 30 yrs
- 0.0%
- Est. flood insurance / yr
- $507 – $1,088
Fire risk 1/10 · Minimal
- Est. fire insurance / yr
- $784 – $1,456
Heat risk 3/10 · Minor
- Hot days now (above 98°F)
- 7 days/yr
- Hot days in 30 yrs
- 15 days/yr
Wind risk 2/10 · Minimal
- Chance of severe wind over 30 yrs
- —
Air-quality risk 2/10 · Minimal
- Unhealthy air days now
- 1 days/yr
- Unhealthy air days in 30 yrs
- 2 days/yr
Risk factors via First Street. Map © Google.
Why this score? — see what drove the B grade
The composite is a weighted blend of 9 inputs, each scored 0–100. Each bar is that input's sub-score; the figure is the points it added to the 100-point composite (weight × sub-score).
- Cash flow +26.5/30.0
- ARV discount +15.0/15.0
- DSCR +9.1/10.0
- 1% rule +7.3/10.0
- Livability +4.0/5.0
- Schools +3.2/10.0
- Rent growth +2.6/5.0
- Condition / age +2.5/5.0
- Appreciation +0.0/10.0
$129,900
🖨 Deal sheet (PDF) 📄 Offer letter ✓ Due diligence
Listing remarks MLS
LOCATION, LOCATION, LOCATION! Great opportunity to own this charming ranch-style home in the heart of Dearborn Heights! Featuring a massive living room with fresh carpeting, this home offers comfort and space throughout. Large primary bedroom with vaulted ceilings and deep closets provides a spacious retreat. Enjoy the convenience of a detached garage, covered front porch, and fully fenced yard perfect for entertaining, pets, or outdoor relaxation. A fantastic opportunity for homeowners and investors alike!
Key facts
- Covered front porch
- Massive living room
- Ranch-style home
Tags
Property features AI
Finance
- Other: Lot approximately 0.1 acre (40 x 111.65)
- Financial info: Annual tax amount listed (not included per instructions)
Exterior
- Parking: Detached garage; Approximately 1.5 garage spaces
- Utilities: Public water; Public sewer
- Home design: Single-family residence; One-level home; Ground-level entry with steps; Aluminum siding and brick exterior
- Construction: Aluminum siding and brick construction
- Exterior features: Covered patio/porch; Deck; Front porch; Paved road access
Interior
- Bedrooms: Total of 5 rooms (includes bedrooms and living spaces)
- Bathrooms: 1 full bathroom
- Heating & cooling: Hot water heating; Natural gas heating; Radiant heating; No central cooling
- Interior features: Crawl space basement
Neighborhood map
What this means for you Summary
Snapshot
- This is a 2-bed/1.0-bath single-family listed at $130k.
Deal economics
- At list price, monthly cash flow is $345 ($4k/yr) — positive.
- The deal already cash-flows at list — no discount required.
- Meets the 1% rule at list price ($2k rent vs $130k).
- Recommended offer: $128k (1.5% below list) — sets the bar for market timing.
- Cap rate 9.5% vs local median 5.5% in Dearborn Heights — top-decile yield for the area; either an underpriced asset or a hidden risk that comps aren't pricing in. Stress-test before assuming the spread holds.
Location & tenants
- Location reads 79/100 on livability (#82 in MI, #1,885 nationally) — a middle-class / working-renter tenant base. Strengths: commute A+, cost of living A+, housing A+; Watch: crime D+, employment D+, health & safety D+.
- Crestwood School District (suburban): math 32% / reading 43% proficiency, ranked #242 of 540 in MI (top 45%) — families likely to look elsewhere, expect single-tenant / working-renter base with shorter leases.
- Zoned schools: Riverside Middle School (math 37% / reading 57%, grade D+, #143 of 493 statewide, top 30%, 1,172 students, 78% FRL); Crestwood High School (math 36% / reading 48%, grade F, #264 of 713 statewide, top 41%, 1,336 students, 72% FRL) — zoned schools average 75% FRL vs 59% district-wide (16 pts higher); higher-poverty schools than district average — tighter screening recommended.
- Market conditions: Rents flat; 148 active listings in the ZIP; 14 comparable units currently listed for rent nearby; rentals at typical pace (median 20d on market — plan ~3-4 weeks tenant-placement turnaround); 2,639 units permitted in Wayne County in 2024 (1,216 in 5+ unit buildings).
- This rent runs 32% of the median local income ($61k/yr) — at the standard rent-burdened threshold; future hikes will face affordability resistance.
Forward outlook
- Local home prices are declining (-3.0%/yr); year-one equity from $898 of loan paydown is wiped out by about $4k of value loss. Plan a longer hold.
- Wayne County population projected at -17% by 2050 — secular population decline; favor cash flow + early exit over multi-decade hold.
Negotiation context
- It's been on market 26 days — a 2% lower offer ($128k) is reasonable based on typical stale-listing flexibility.
- 8 sale attempts since 23y ago with the ask held roughly flat each time — persistent listings suggest the price (not the market) is what's stuck; bring a comps-based counter.
- Current owner paid $15k; list at $130k implies a 766% gain — meaningful room to come down on a strong offer.
Risks & watch-outs
- Watch-outs: built in 1941 — expect roof / HVAC / electrical / plumbing capex.
Questions for the listing agent
- Built in 1941 — when were the roof, HVAC, electrical panel, plumbing, and water heater last replaced?
- Is there a deadline driving the sale (1031 exchange, divorce, estate, relocation)? That informs how much negotiation room exists.
- Crime grade is D in this area — have there been break-ins, vandalism, or insurance claims at this property in the last 3 years? What carrier currently insures it and at what premium?
- What's the average days-on-market for RENTAL listings here right now (not sales)? A rising rental-DOM trend means longer vacancies and softer asking-rent achievability than the comps imply.
- What's the recent tenant-quality profile in this submarket — average credit score on applications, eviction rate, late-payment / NSF rate, and stable-employment percentage? A property-management company in the area should have these aggregated.
- How much new for-sale + rental construction is in the pipeline within 1–3 miles? Heavy new supply typically softens prices + rents 12–24 months out; constrained supply supports both.
Investment metrics
- 1% rule
- 1.23% ✓
- Cap rate
- 9.48%
- Cash-on-cash
- 11.39%
- DSCR
- 1.51
- GRM
- 6.8
CMA / ARV
- ARV (median comp)
- $179,490
- List price
- $129,900
- Delta
- -27.63%
- Verdict
- UNDERPRICED
- Comps
- 20 within 1.0 mi
Show comp detail 12 sales within ~0.75 mi
| Address | Dist | Beds/Ba | Sqft | Sold | Price | $/sf | Match |
|---|---|---|---|---|---|---|---|
| 6165 Nightingale St | 0.22mi | 2/1.0 | 864 (-8%) | 1mo | $150,000 | $174 | 76 |
| 5955 N Silvery Ln | 0.43mi | 2/1.0 | 975 (+4%) | 4mo | $224,900 | $231 | 70 |
| 5939 Robindale Ave | 0.40mi | 3/1.0 (+1) | 900 (-4%) | 4mo | $190,000 | $211 | 66 |
| 1830 N Gulley Rd | 0.75mi | 2/1.5 | 958 (+2%) | 0mo | $315,000 | $329 | 59 |
| 192 Jay St | 0.68mi | 2/1.0 | 1,000 (+7%) | 2mo | $22,000 | $22 | 56 |
| 6627 Mayburn St | 0.67mi | 3/1.0 (+1) | 960 (+3%) | 5mo | $160,000 | $167 | 55 |
| 6556 Drexel St | 0.63mi | 3/1.0 (+1) | 988 (+6%) | 2mo | $230,000 | $233 | 55 |
| 6953 N Vernon St | 0.62mi | 3/1.0 (+1) | 1,006 (+8%) | 1mo | $190,000 | $189 | 53 |
| 5651 Fenton St | 0.72mi | 2/1.0 | 848 (-9%) | 2mo | $145,000 | $171 | 50 |
| 5903 N Silvery Ln | 0.47mi | 3/1.0 (+1) | 800 (-14%) | 1mo | $144,000 | $180 | 48 |
| 24122 Hass St | 0.66mi | 2/1.0 | 825 (-12%) | 3mo | $180,000 | $218 | 47 |
| 6633 Shadowlawn St | 0.62mi | 3/2.0 (+1) | 1,073 (+15%) | 1mo | $285,000 | $266 | 37 |
Match score weights: distance 35% · size 25% · config 20% · recency 20%. Top-matched comps best support the ARV.
Projected returns pro-forma
-3.0% appreciation · 0.41% rent growth · sell at horizon
- IRR
- -2.3%
- Equity multiple
- 0.91×
- Total profit
- $-3,096
- Equity at exit
- $19,369
- IRR
- 4.2%
- Equity multiple
- 1.27×
- Total profit
- $9,926
- Equity at exit
- $11,231
Cash invested: $36,372 (down + closing). Projections, not guarantees.
Landlord ↔ Tenant lean methodology
- Overall (STATE)
- 62 Landlord-Friendly
- State Michigan
- 62 Landlord-Friendly · EVEN
- County
- — inherits STATE
- City
- — inherits STATE
ZIP-level market 48127
- Rents YoY
- 0.4%
- Active inventory
- 148
- Price-to-rent
- 6.8×
Monthly cashflow live
- Estimated rent
- $1,600 high interval (Pro) →
- Mortgage (P&I)
- −$681
- Tax from tax record
- −$183 /mo · $2,199/yr
- Insurance
- −$54
- HOA
- −$0
- Lot rent
- −$0
- Vacancy / Maint / Mgmt
- −$336
- Net cashflow
- $345
Break-even live
Sensitivity live
| Price | -10% $419 | -5% $382 | +0% $345 | +5% $308 | +10% $272 |
|---|---|---|---|---|---|
| Rent | -10% $219 | -5% $282 | +0% $345 | +5% $408 | +10% $471 |
| Rate | -1.0pp $411 | -0.5pp $378 | base $345 | +0.5pp $311 | +1.0pp $277 |
UW: 25.0% down · 7.5% · 30yr · 1.5% tax · 5.0% vac · 8.0% maint · 8.0% mgmt
Financing live
Cash to close
- Down payment
- $32,475
- Closing costs
- $3,897
- Reserves months
- —
- Total cash needed
- —
Loan-product check · same deal, 3 products live
Conventional
25% down · 7.5% · 30yr
- Down + closing
- —
- Monthly P&I
- —
- Monthly cashflow
- —
- DSCR
- —
- Eligible?
- —
Personal DTI + credit; lowest rate.
DSCR
20% down · 8.5% · 30yr
- Down + closing
- —
- Monthly P&I
- —
- Monthly cashflow
- —
- DSCR
- —
- Eligible?
- —
No personal income docs; deal must DSCR.
Hard money
10% down · 12.0% · 12mo
- Down + closing
- —
- Monthly P&I
- —
- Monthly cashflow
- —
- DSCR
- —
- Eligible?
- —
Short-term bridge; refi at stabilization.
Rent comps 14 comps
| Address | Beds | Baths | Sqft | Rent | $/sqft | DOM | Units | Dist |
|---|---|---|---|---|---|---|---|---|
| 7014 Kinmore St Dearborn Heights, MI | 3.0 | 1.0 | 960 | $1,900 | $1.98 | 24d | 1 | 0.32mi |
| 7080 Highview St Dearborn Heights, MI | 3.0 | 2.5 | 1105 | $2,000 | $1.81 | 20d | 1 | 0.34mi |
| 5722 Centralia St Dearborn Heights, MI | 3.0 | 1.0 | 999 | $1,750 | $1.75 | 0d | 1 | 0.58mi |
| 181 Terri Dr Unit 181 Dearborn Heights, MI | 2.0 | 2.0 | 840 | $1,119 | $1.33 | 7d | 1 | 0.60mi |
| 79 3rd St Unit 79 Dearborn Heights, MI | 2.0 | 1.0 | 840 | $1,339 | $1.59 | 26d | 1 | 0.71mi |
| 7420 Drexel St Dearborn Heights, MI | 2.0 | 1.0 | 1080 | $1,700 | $1.57 | 46d | 1 | 0.85mi |
| 7420 Drexel St Dearborn Heights, MI | 2.0 | 1.0 | 1080 | $1,700 | $1.57 | 19d | 1 | 0.85mi |
| 7420 Drexel St Dearborn Heights, MI | 2.0 | 1.0 | 1080 | $1,600 | $1.48 | 6d | 1 | 0.85mi |
| 23700 W Warren St Dearborn Heights, MI | 1.0 | 1.0 | 900 | $1,120 | $1.24 | 46d | 2 | 0.93mi |
| 8187 Lenore St Dearborn Heights, MI | 2.0 | 1.0 | 768 | $1,550 | $2.02 | 46d | 1 | 1.22mi |
| 8455 Robindale Ave Dearborn Heights, MI | 3.0 | 1.0 | 1100 | $1,750 | $1.59 | 6d | 1 | 1.29mi |
| 6954 Inkster Rd Dearborn Heights, MI | 1.0–2.0 | 1.0–1.5 | 837 | $1,339 | $1.60 | 0d | 9 | 1.30mi |
| 5726 Inkster Rd Dearborn Heights, MI | 1.0 | 1.0 | 630 | $1,050 | $1.67 | 46d | 1 | 1.33mi |
| 7466 W Parkway St Redford, MI | 2.0 | 1.5 | 672 | $1,200 | $1.79 | 5d | 1 | 1.39mi |
Listing history 23 events
-
2026-06-04status $129,900 Pending 26 DOM
-
2026-06-03days on market $129,900 Active 26 DOM
Show marketing remark (512 chars)
LOCATION, LOCATION, LOCATION! Great opportunity to own this charming ranch-style home in the heart of Dearborn Heights! Featuring a massive living room with fresh carpeting, this home offers comfort and space throughout. Large primary bedroom with vaulted ceilings and deep closets provides a spacious retreat. Enjoy the convenience of a detached garage, covered front porch, and fully fenced yard perfect for entertaining, pets, or outdoor relaxation. A fantastic opportunity for homeowners and investors alike!
-
2026-06-02days on market $129,900 Active 25 DOM
-
2026-06-01days on market $129,900 Active 24 DOM
-
2026-05-31days on market $129,900 Active 23 DOM
-
2026-05-08$129,900 Active 558-char remark
Show marketing remark (512 chars)
LOCATION, LOCATION, LOCATION! Great opportunity to own this charming ranch-style home in the heart of Dearborn Heights! Featuring a massive living room with fresh carpeting, this home offers comfort and space throughout. Large primary bedroom with vaulted ceilings and deep closets provides a spacious retreat. Enjoy the convenience of a detached garage, covered front porch, and fully fenced yard perfect for entertaining, pets, or outdoor relaxation. A fantastic opportunity for homeowners and investors alike!
-
2026-05-08$129,900 Active 554-char remark
Show marketing remark (512 chars)
LOCATION, LOCATION, LOCATION! Great opportunity to own this charming ranch-style home in the heart of Dearborn Heights! Featuring a massive living room with fresh carpeting, this home offers comfort and space throughout. Large primary bedroom with vaulted ceilings and deep closets provides a spacious retreat. Enjoy the convenience of a detached garage, covered front porch, and fully fenced yard perfect for entertaining, pets, or outdoor relaxation. A fantastic opportunity for homeowners and investors alike!
-
2020-01-24historical
-
2020-01-15historical
-
2019-10-16$84,900 Active
-
2019-10-16$84,900 Active
-
2012-05-02soldstatus $15,000
-
2012-05-02soldstatus $15,000
-
2012-03-15historical
-
2012-03-15historical
-
2012-01-05$20,000
-
2012-01-05$20,000
-
2003-11-17soldstatus $89,000
-
2003-09-10soldstatus $89,000
-
2003-08-04$89,900
-
2003-08-04historical
-
2003-06-12$103,900
-
1995-09-07soldstatus $54,000
ⓘ Source: listings_history table (triggers on properties + properties_extension) + one-shot
backfill from property_details.listing_events for pre-trigger history.
Tax reassessment forecast MI · Partial reset (capped growth)
- Current annual tax
- $2,199 · $183/mo
- Projected year-2 tax
- $2,199 · $183/mo
- Expected delta
- $0/yr ($0/mo · 0.0%)
ⓘ Screening estimate from a state-policy table — verify with the county assessor before closing.
Climate risk First Street
- Flood 1/10 Low FEMA zone X (unshaded) · 0% chance over 30 yrs
- Wildfire 1/10 Low
- Heat 3/10 Moderate 7 d/yr ≥98°F today · 15 d/yr by 30 yrs out
- Wind 2/10 Low
- Air quality 2/10 Low 1 unhealthy d/yr today · 2 by 30 yrs out
Nearby sold comps map
Loading sold comps map…
Walkable amenities ~0.75 mi
Loading nearby amenities…
Taxation est. · year 1
- Rental income
- $19,195
- − Mortgage interest
- −$7,276
- − Property taxes
- −$2,199
- − Insurance
- −$650
- − Repairs & maintenance
- −$1,536
- − Management
- −$1,536
- − Depreciation
- −$3,779
- Taxable income
- $2,220
- Est. tax owed @ 24.0%
- −$533
- After-tax cash flow
- $3,608/yr
For passive investors: Depreciation is non-cash, so a rental often shows a tax loss while cash-flowing — sheltering income. Rental losses are passive: they offset passive income freely, and up to $25,000/yr can offset ordinary (W-2) income if you actively participate and your MAGI is under $100k (phasing out to $0 by $150k); unused losses carry forward. On sale, claimed depreciation is recaptured at up to 25%, and gains may owe capital-gains tax (a 1031 exchange can defer both). Figures are a year-1 estimate at your 24.0% rate — not tax advice; consult a CPA.
Schools (NCES district)
- District
- Crestwood School District
- NCES district ID
- 2600016
- Math proficiency
- 32% ▼ -6.00%
- Reading proficiency
- 43% ▼ -4.00%
- Median HH income
- $47,101
- Composite
- 32.1/100
- National rank
- #5806
- State rank
- #242 of 540 in MI
Livability — Dearborn Heights
- Score
- 79/100
- State rank
- #82
- US rank
- #1885
Category grades
Schools grade is shown separately in the Schools card above.
Census & demographics
- Census place
- Dearborn Heights, MI
- County
- Wayne County · 1,562,939 people
- City population
- 61,771
- Metro
- Detroit-Warren-Dearborn, MI
- Population (ZIP)
- 39,646
- Household income
- $60,742
- Rent vs Own
- Severe rent burden
- 1196.0
Population outlook (Wayne County) Hauer SSP2
- Today (2025)
- 1,675,273 people
- By 2030
- 1,620,300 · -3.3%
- By 2040
- 1,502,341 · -10.3%
- By 2050
- 1,384,039 · -17.4%
- By 2075
- 1,124,592 · -32.9%
- By 2100
- 881,193 · -47.4%
Race, ethnicity, and origin ACS 2023
- Neighborhood character
- Predominantly White (85%)
- Race & ethnicity
- White 85% Black 8% Two or more races 3% Hispanic / Latino 3% Asian 2%
- Common ancestry
- Arab 8% Romanian 7% Lithuanian 2%
- Foreign-born
- 31% · Canada
- Languages at home
- 46% English-only · Arabic 45% Russian/Polish/Slavic 2% Other Indo-European 2%
Political lean MEDSL · Wayne
- 2024 margin
- Strong D (+29.0) · D 62.7% · R 33.7% · Other 3.6%
- 2008→2024 swing
- -20.5pp toward R · 2008: 49.5pp · 2024: 29.0pp
- All cycles
- 2024: D+29.0 2020: D+38.1 2016: D+37.3 2012: D+46.9 2008: D+49.5
Not yet ingested
- Civics
- —
Market trends
- HPI YoY
- ▼ -319.04%
- Current HPI
- 225.9407
- Rent YoY
- ▲ 0.41%
- Metro
- Detroit-Warren-Dearborn, MI
- State GDP YoY
- ▲ 1.37%
- F500 in state
- 28
Industry mix (Fortune 500 HQ in MI)
| Industry | F500 HQs | Revenue |
|---|---|---|
| Automotive Parts | 3 | $48B |
|
||
| Automotive | 2 | $372B |
|
||
| Chemicals | 1 | $45B |
|
||
| Automotive Retail | 1 | $29B |
|
||
| Healthcare / Medical Devices | 1 | $23B |
|
||
| Automotive Technology | 1 | $20B |
|
||
Price history
+140.6% since first listed20 events — show timeline
- 2026-06-03 Pending — MiRealSource-MiMLS
- 2026-06-03 Pending — REALCOMP
- 2026-05-08 Listed $129,900 REALCOMP
- 2026-05-08 Listed $129,900 MiRealSource-MiMLS
- 2020-01-24 Listing Removed — REALCOMP
- 2020-01-15 Listing Removed — MiRealSource-MiMLS
- 2019-10-16 Listed $84,900 MiRealSource-MiMLS
- 2019-10-16 Listed $84,900 REALCOMP
- 2012-05-02 Sold (MLS) $15,000 MiRealSource-MiMLS
- 2012-05-02 Sold (MLS) $15,000 REALCOMP
- 2012-03-15 Listing Removed — MiRealSource-MiMLS
- 2012-03-15 Listing Removed — REALCOMP
- 2012-01-05 Listed $20,000 MiRealSource-MiMLS
- 2012-01-05 Listed $20,000 REALCOMP
- 2003-11-17 Sold (Public Records) $89,000 Public Records
- 2003-09-10 Sold (MLS) $89,000 REALCOMP
- 2003-08-04 Listing Removed — REALCOMP
- 2003-08-04 Listed $89,900 REALCOMP
- 2003-06-12 Listed $103,900 REALCOMP
- 1995-09-07 Sold (Public Records) $54,000 Public Records
Property tax history
+3.0%/yrLatest (2025): $2,199 · +9.5% YoY. Source: county tax records.
Cash-flow waterfall
monthlySold comps — $/sqft
last 12 mo · ≤1 miLoading sold comps…