4121 Chesapeake Ln · North Highlands, CA
Flood risk 1/10 · Minimal
- FEMA flood zone
- X (unshaded)
- Chance of flooding over 30 yrs
- 0.0%
- Est. flood insurance / yr
- $507 – $1,088
Fire risk 1/10 · Minimal
- Est. fire insurance / yr
- $659 – $1,223
Heat risk 7/10 · Major
- Hot days now (above 102°F)
- 7 days/yr
- Hot days in 30 yrs
- 15 days/yr
Wind risk 1/10 · Minimal
- Chance of severe wind over 30 yrs
- —
Air-quality risk 10/10 · Severe
- Unhealthy air days now
- 34 days/yr
- Unhealthy air days in 30 yrs
- 38 days/yr
Risk factors via First Street. Map © Google.
Why this score? — see what drove the B grade
The composite is a weighted blend of 9 inputs, each scored 0–100. Each bar is that input's sub-score; the figure is the points it added to the 100-point composite (weight × sub-score).
- Cash flow +30.0/30.0
- 1% rule +10.0/10.0
- DSCR +10.0/10.0
- ARV discount +8.5/15.0
- Rent growth +3.9/5.0
- Schools +3.1/10.0
- Livability +3.1/5.0
- Condition / age +2.5/5.0
- Appreciation +0.0/10.0
$100,000
🖨 Deal sheet 📄 Offer letter ✓ Due diligence
Listing remarks
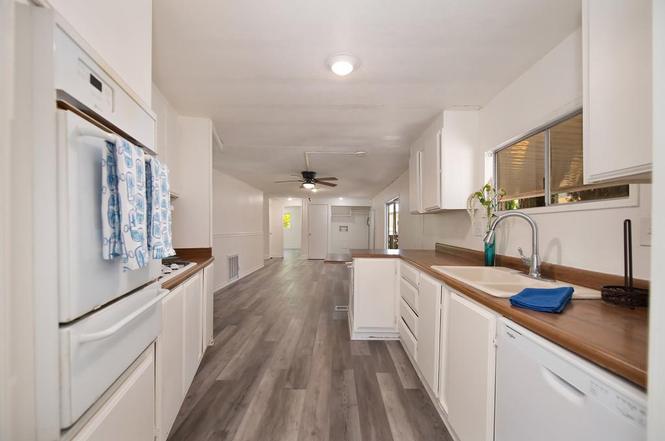
Home comes with a 2 year roof certification. Welcome to the all age Fairway Estates Gated MHP. Amenities include pool, spa, laundry facilities, guest parking, secured gate, club house and onsite property management. Spacious 2 bedroom (could make a 3rd room) 2 bath home with brand new laminate floors, large open windows, built-in wall dining buffet. Large galley style kitchen with newly installed beautiful wood counter tops, breakfast bar area, all appliances stay. Off the kitchen is another living area (family room) with an area for a full size washer and dryer, patio door that leads to your outside patio area. Both bedrooms are generous in size with built-in cabinets within the closets, a
Key facts
- Laundry facilities
- Guest parking
- Spa
Tags
Property features AI
Finance
- Other: Senior community: No
- Financial info: Land lease in place
- HOA & community: No association
Exterior
- Parking: 2 parking spaces; Off-street parking; Guest parking available
- Security: Gated park entry
- Utilities: Public water; Public sewer; Natural gas connected; Individual electric meter; 220V in laundry; Cable available; Internet available
- Home design: Manufactured in park; Double wide; Entry through gated park (gate open 7am–7pm)
- Construction: Built in 1972; Shingle roof; Vinyl skirting; Updated/remodeled condition
- Exterior features: Carport awning; Corner lot; Regular-shaped lot
Interior
- Kitchen: Built-in gas oven; Gas cooktop; Range hood; Dishwasher; Disposal; Breakfast area; Kitchen island; Wood counters
- Bedrooms: 2 bedrooms (possible 3)
- Flooring: Laminate flooring
- Bathrooms: 2 full bathrooms; Double sinks; Tub with shower over
- Heating & cooling: Central heating; Central cooling; Ceiling fans
- Interior features: Updated/remodeled interior; Porch steps with railing; Covered and uncovered patio areas; Window coverings and window screens; Dining/Living combo
- Laundry & utility: Laundry closet with hookups; Inside laundry area
Neighborhood map
What this means for you Summary
Snapshot
- This is a 2-bed/2.0-bath manufactured listed at $100k.
Deal economics
- At list price, monthly cash flow is $898 ($11k/yr) — positive.
- The deal already cash-flows at list — no discount required.
- Meets the 1% rule at list price ($2k rent vs $100k).
- Recommended offer: $88k (12.0% below list) — sets the bar for market timing.
- Cap rate 17.1% vs local median 4.1% in North Highlands — top-decile yield for the area; either an underpriced asset or a hidden risk that comps aren't pricing in. Stress-test before assuming the spread holds.
Location & tenants
- Location reads 61/100 on livability (#523 in CA) — a middle-class / working-renter tenant base. Strengths: housing A+; Watch: employment C-, schools D, crime F.
- Twin Rivers Unified (suburban): math 29% / reading 37% proficiency, ranked #970 of 1,400 in CA (top 69%) — families likely to look elsewhere, expect single-tenant / working-renter base with shorter leases; 76% free/reduced lunch — lower-income household profile, screen leases tightly.
- Market conditions: Rents rising fast (+5.7%/yr); 108 active listings in the ZIP; 34 comparable units currently listed for rent nearby; rentals leasing fast (median 3d on market — plan ~1-2 weeks tenant-placement turnaround); 6,825 units permitted in Sacramento County in 2024 (1,752 in 5+ unit buildings).
- This rent runs 33% of the median local income ($68k/yr) — at the standard rent-burdened threshold; future hikes will face affordability resistance.
Forward outlook
- Local home prices are declining (-3.0%/yr); year-one equity from $691 of loan paydown is wiped out by about $3k of value loss. Plan a longer hold.
- Sacramento County population projected at +17% by 2050 — long-run rental-demand tailwind backs the buy-and-hold thesis.
- At projected returns (-3.0% appreciation + 5.7% rent growth), your $28k cash investment doubles in ~3 years — after that, you're playing with house money.
Negotiation context
- It's been on market 214 days — a 12% lower offer ($88k) is reasonable based on typical stale-listing flexibility.
Risks & watch-outs
- Climate carrying-cost: extreme-heat days projected 7→15/yr by 2055 (HVAC capex compounding) — expect insurance premiums to compound above CPI over the hold.
Questions for the listing agent
- It's been on market 214 days. Have you received any prior offers? Is the seller open to a 12% concession, seller financing, or rate buy-down credit?
- Built in 1972 — when were the roof, HVAC, electrical panel, plumbing, and water heater last replaced?
- Why hasn't it sold? Are there any deal-killer items the seller is aware of (foundation, flood, title, zoning, code violations)?
- Is there a deadline driving the sale (1031 exchange, divorce, estate, relocation)? That informs how much negotiation room exists.
- Schools are D-rated, which usually means shorter tenancies and higher turnover. Who's the typical renter profile here, and what's been the actual vacancy rate?
- Crime grade is F in this area — have there been break-ins, vandalism, or insurance claims at this property in the last 3 years? What carrier currently insures it and at what premium?
- What's the average days-on-market for RENTAL listings here right now (not sales)? A rising rental-DOM trend means longer vacancies and softer asking-rent achievability than the comps imply.
- What's the recent tenant-quality profile in this submarket — average credit score on applications, eviction rate, late-payment / NSF rate, and stable-employment percentage? A property-management company in the area should have these aggregated.
- How much new for-sale + rental construction is in the pipeline within 1–3 miles? Heavy new supply typically softens prices + rents 12–24 months out; constrained supply supports both.
Investment metrics
- 1% rule
- 1.88% ✓
- Cap rate
- 17.06%
- Cash-on-cash
- 38.47%
- DSCR
- 2.71
- GRM
- 4.4
CMA / ARV
- ARV (on-the-fly)
- $102,240
- Comps found
- 12
Show comp detail 12 sales within ~0.75 mi
| Address | Dist | Beds/Ba | Sqft | Sold | Price | $/sf | Match |
|---|---|---|---|---|---|---|---|
| 5040 Jackson St #60 | 0.39mi | 2/2.0 | 1,440 (0%) | 4mo | $75,000 | $52 | 78 |
| 5064 - 5477 S Valley Forge Ln #25 | 0.28mi | 3/2.0 (+1) | 1,400 (-3%) | 7mo | $88,900 | $64 | 72 |
| 5040 Jackson St #110 | 0.31mi | 3/2.0 (+1) | 1,440 (0%) | 12mo | $81,500 | $57 | 71 |
| 4133 Potomac Ln | 0.06mi | 3/2.0 (+1) | 1,298 (-10%) | 10mo | $100,000 | $77 | 68 |
| 5040 Jackson St #44 | 0.31mi | 2/2.0 | 1,536 (+7%) | 9mo | $74,000 | $48 | 67 |
| 5040 Jackson St #54 | 0.37mi | 3/2.0 (+1) | 1,512 (+5%) | 10mo | $75,000 | $50 | 61 |
| 4139 Minute Man Ln | 0.17mi | 3/2.0 (+1) | 1,283 (-11%) | 11mo | $92,000 | $72 | 60 |
| 4130 Annapolis Ln #159 | 0.09mi | 3/2.0 (+1) | 1,225 (-15%) | 9mo | $107,500 | $88 | 59 |
| 3655 N Ohio Ln #87 | 0.57mi | 2/2.0 | 1,522 (+6%) | 13mo | $120,000 | $79 | 53 |
| 5040 Jackson St #149 | 0.34mi | 2/2.0 | 1,248 (-13%) | 12mo | $88,000 | $71 | 52 |
| 5040 Jackson St #76 | 0.43mi | 3/2.0 (+1) | 1,584 (+10%) | 9mo | $85,000 | $54 | 51 |
| 4963 Eleven Oaks Ln | 0.66mi | 3/2.0 (+1) | 1,536 (+7%) | 6mo | $140,000 | $91 | 48 |
Match score weights: distance 35% · size 25% · config 20% · recency 20%. Top-matched comps best support the ARV.
Projected returns pro-forma
-3.0% appreciation · 5.69% rent growth · sell at horizon
- IRR
- 37.4%
- Equity multiple
- 2.65×
- Total profit
- $46,151
- Equity at exit
- $14,910
- IRR
- 45.2%
- Equity multiple
- 5.87×
- Total profit
- $136,289
- Equity at exit
- $8,646
Cash invested: $28,000 (down + closing). Projections, not guarantees.
Landlord ↔ Tenant lean methodology
- Overall (STATE)
- 18 Strongly Tenant-Friendly
- State California
- 18 Strongly Tenant-Friendly · D+13
- County
- — inherits STATE
- City
- — inherits STATE
ZIP-level market 95660
- Rents YoY
- 5.7%
- Active inventory
- 108
- Price-to-rent
- 4.4×
Monthly cashflow live
- Estimated rent
- $1,878 high interval (Pro) →
- Mortgage (P&I)
- −$524
- Tax from tax record
- −$20 /mo · $237/yr
- Insurance
- −$42
- HOA
- −$0
- Vacancy / Maint / Mgmt
- −$394
- Net cashflow
- $898
Break-even live
UW: 25.0% down · 7.5% · 30yr · 1.5% tax · 5.0% vac · 8.0% maint · 8.0% mgmt
Financing live
Cash to close
- Down payment
- $25,000
- Closing costs
- $3,000
- Reserves months
- —
- Total cash needed
- —
Loan-product check · same deal, 3 products live
Conventional
25% down · 7.5% · 30yr
- Down + closing
- —
- Monthly P&I
- —
- Monthly cashflow
- —
- DSCR
- —
- Eligible?
- —
Personal DTI + credit; lowest rate.
DSCR
20% down · 8.5% · 30yr
- Down + closing
- —
- Monthly P&I
- —
- Monthly cashflow
- —
- DSCR
- —
- Eligible?
- —
No personal income docs; deal must DSCR.
Hard money
10% down · 12.0% · 12mo
- Down + closing
- —
- Monthly P&I
- —
- Monthly cashflow
- —
- DSCR
- —
- Eligible?
- —
Short-term bridge; refi at stabilization.
Rent comps 34 comps
| Address | Beds | Baths | Sqft | Rent | $/sqft | DOM | Units | Dist |
|---|---|---|---|---|---|---|---|---|
| 4020 Tricia Way Unit 4688001002 North Highlands, CA | 2.0 | 1.0 | 1000 | $1,495 | $1.50 | 43d | 1 | 0.15mi |
| 4008 Tricia Way North Highlands, CA | 2.0 | 1.0 | 900 | $1,700 | $1.89 | 12d | 1 | 0.17mi |
| 5123 Shell St North Highlands, CA | 2.0 | 1.0 | 912 | $1,950 | $2.14 | 1d | 1 | 0.48mi |
| 4930 Polk St North Highlands, CA | 2.0–3.0 | 1.0–2.0 | 938 | $1,795 | $1.91 | 1d | 3 | 0.50mi |
| 3731 Scallop Ct North Highlands, CA | 2.0 | 1.0 | 924 | $2,150 | $2.33 | 43d | 1 | 0.55mi |
| 4561 Ashcroft Ave Unit 52 Sacramento, CA | 2.0 | 1.0 | 900 | $1,395 | $1.55 | 1d | 1 | 0.63mi |
| 4561 Ashcroft Ave Apt 49 Sacramento, CA | 2.0 | 1.0 | 888 | $1,499 | $1.69 | 1d | 1 | 0.63mi |
| 3609 Myrtle Ave North Highlands, CA | 2.0 | 2.0 | 900 | $1,795 | $1.99 | 1d | 2 | 0.66mi |
| 5001 Date Ave Sacramento, CA | 3.0 | 2.0 | 1106 | $2,400 | $2.17 | 1d | 1 | 0.70mi |
| 3517 Myrtle Ave North Highlands, CA | 2.0 | 2.0 | 900 | $1,750 | $1.94 | 3d | 1 | 0.76mi |
| 5048 Date Ave Sacramento, CA | 2.0 | 1.0 | 1000 | $1,588 | $1.59 | 43d | 1 | 0.78mi |
| 4716 Tulane Ct Sacramento, CA | 3.0 | 2.0 | 1303 | $2,450 | $1.88 | 23d | 1 | 0.79mi |
| 5516 Palmdale Way Sacramento, CA | 3.0 | 2.0 | 1115 | $2,250 | $2.02 | 20d | 1 | 0.85mi |
| 4255 Winding Way Sacramento, CA | 2.0 | 1.5 | 1300 | $1,995 | $1.53 | 7d | 1 | 0.92mi |
| 4815 College Oak Dr Sacramento, CA | 2.0 | 1.0–1.5 | 1000 | $1,662 | $1.66 | 7d | 2 | 0.92mi |
| 4215 Palm Ave Sacramento, CA | 1.0–2.0 | 1.0–2.0 | 775 | $1,660 | $2.14 | 1d | 3 | 1.02mi |
| 5625 San Vincente Way North Highlands, CA | 3.0 | 1.0 | 875 | $2,150 | $2.46 | 1d | 1 | 1.08mi |
| 4901 Little Oak Ln Sacramento, CA | 1.0–3.0 | 1.0–2.0 | 915 | $1,540 | $1.68 | 1d | 7 | 1.10mi |
| 5415 College Oak Dr Sacramento, CA | 1.0–2.0 | 1.0–2.0 | 850 | $1,725 | $2.03 | 1d | 3 | 1.11mi |
| 5614 Hillsdale Blvd Unit A Sacramento, CA | 2.0 | 1.5 | 933 | $1,450 | $1.55 | 22d | 1 | 1.12mi |
| 5443 College Oak Dr Sacramento, CA | 1.0–2.0 | 1.0–2.0 | 821 | $1,850 | $2.25 | 43d | 3 | 1.16mi |
| 5012 Sunshine Ln Sacramento, CA | 2.0 | 1.0 | 970 | $1,775 | $1.83 | 10d | 1 | 1.16mi |
| 5600 Walerga Rd #4 Sacramento, CA | 2.0 | 1.0 | 924 | $1,700 | $1.84 | 1d | 1 | 1.17mi |
| 5800 Hamilton St Sacramento, CA | 1.0–2.0 | 1.0–2.0 | 823 | $1,770 | $2.15 | 1d | 4 | 1.17mi |
| 4815 Mary Kate Dr Sacramento, CA | 2.0 | 2.0 | 1100 | $1,850 | $1.68 | 43d | 1 | 1.18mi |
| 4821 Mary Kate Dr Unit 4823 Sacramento, CA | 2.0 | 2.0 | 1050 | $1,675 | $1.60 | 1d | 1 | 1.19mi |
| 5674 Hillsdale Blvd Sacramento, CA | 2.0 | 1.5 | 933 | $1,600 | $1.71 | 1d | 1 | 1.21mi |
| 5525 Missie Way Unit 8346003001/85 Sacramento, CA | 2.0 | 1.0 | 1000 | $1,985 | $1.99 | 1d | 1 | 1.23mi |
| 5733 San Vincente Way North Highlands, CA | 3.0 | 1.0 | 925 | $2,195 | $2.37 | 2d | 1 | 1.25mi |
| Venuto Way North Highlands, CA | 2.0 | 1.0 | 906 | $2,095 | $2.31 | 10d | 2 | 1.27mi |
| 5129 Myrtle Ave Sacramento, CA | 2.0 | 2.5 | 1275 | $1,895 | $1.49 | 43d | 1 | 1.28mi |
| 3610 Auburn Blvd Sacramento, CA | 3.0 | 2.0 | 1140 | $2,395 | $2.10 | 7d | 1 | 1.36mi |
| 4758 Greenholme Dr Sacramento, CA | 2.0 | 1.0 | 924 | $1,595 | $1.73 | 43d | 1 | 1.37mi |
| 6037 N Haven Dr North Highlands, CA | 3.0 | 1.0 | 884 | $2,150 | $2.43 | 1d | 1 | 1.46mi |
Tax reassessment forecast CA · Resets to sale price
- Current annual tax
- $237 · $20/mo
- Projected year-2 tax
- $760 · $63/mo
- Expected delta
- +$523/yr (+$44/mo · 220.8%)
ⓘ Screening estimate from a state-policy table — verify with the county assessor before closing.
Climate risk First Street
- Flood 1/10 Low FEMA zone X (unshaded) · 0% chance over 30 yrs
- Wildfire 1/10 Low
- Heat 7/10 Severe 7 d/yr ≥102°F today · 15 d/yr by 30 yrs out
- Wind 1/10 Low
- Air quality 10/10 Extreme 34 unhealthy d/yr today · 38 by 30 yrs out
Nearby sold comps map
Loading sold comps map…
Walkable amenities ~0.75 mi
Loading nearby amenities…
Taxation est. · year 1
- Rental income
- $22,534
- − Mortgage interest
- −$5,602
- − Property taxes
- −$237
- − Insurance
- −$500
- − Repairs & maintenance
- −$1,803
- − Management
- −$1,803
- − Depreciation
- −$2,909
- Taxable income
- $9,681
- Est. tax owed @ 24.0%
- −$2,323
- After-tax cash flow
- $8,448/yr
For passive investors: Depreciation is non-cash, so a rental often shows a tax loss while cash-flowing — sheltering income. Rental losses are passive: they offset passive income freely, and up to $25,000/yr can offset ordinary (W-2) income if you actively participate and your MAGI is under $100k (phasing out to $0 by $150k); unused losses carry forward. On sale, claimed depreciation is recaptured at up to 25%, and gains may owe capital-gains tax (a 1031 exchange can defer both). Figures are a year-1 estimate at your 24.0% rate — not tax advice; consult a CPA.
Schools (NCES district)
- District
- Twin Rivers Unified
- NCES district ID
- 0601332
- Math proficiency
- 29% ▲ 2.00%
- Reading proficiency
- 37% ▲ 2.00%
- Median HH income
- $42,481
- Composite
- 30.67/100
- National rank
- #11437
- State rank
- #970 of 1400 in CA
Livability — North Highlands
- Score
- 61/100
- State rank
- #523
- US rank
- #17613
Category grades
Schools grade is shown separately in the Schools card above.
Census & demographics
- Census place
- North Highlands, CA
- County
- Sacramento County · 1,539,646 people
- City population
- 56,900
- Metro
- Sacramento-Roseville-Folsom, CA
- Population (ZIP)
- 35,451
- Household income
- $68,235
- Rent vs Own
- Severe rent burden
- 1300.0
Population outlook (Sacramento County) Hauer SSP2
- Today (2025)
- 1,660,763 people
- By 2030
- 1,732,990 · +4.3%
- By 2040
- 1,855,755 · +11.7%
- By 2050
- 1,941,335 · +16.9%
- By 2075
- 2,046,162 · +23.2%
- By 2100
- 1,961,444 · +18.1%
Race, ethnicity, and origin ACS 2023
- Neighborhood character
- Diverse neighborhood (Simpson 0.69)
- Race & ethnicity
- White 41% Hispanic / Latino 37% Two or more races 16% Black 9% Asian 7%
- Hispanic origin (detail)
- Mexican 29%
- Common ancestry
- Subsaharan African 5% Scotch-Irish 2% Scandinavian 2%
- Foreign-born
- 28% · Canada, Vietnam
- Languages at home
- 56% English-only · Spanish 25% Russian/Polish/Slavic 9% Other Indo-European 5%
Political lean MEDSL · Sacramento
- 2024 margin
- D (+19.7) · D 58.1% · R 38.4% · Other 3.5%
- 2008→2024 swing
- +0.7pp no change · 2008: 19.0pp · 2024: 19.7pp
- All cycles
- 2024: D+19.7 2020: D+25.3 2016: D+23.7 2012: D+16.3 2008: D+19.0
Not yet ingested
- Civics
- —
Market trends
- HPI YoY
- ▼ -273.83%
- Current HPI
- 438.1022
- Rent YoY
- ▲ 5.69%
- Metro
- Sacramento-Roseville-Folsom, CA
- State GDP YoY
- ▲ 3.21%
- F500 in state
- 116
Industry mix (Fortune 500 HQ in CA)
| Industry | F500 HQs | Revenue |
|---|---|---|
| Technology | 27 | $1,492B |
|
||
| Financial Services | 3 | $174B |
|
||
| Retail | 3 | $44B |
|
||
| Insurance | 3 | $26B |
|
||
| Media / Entertainment | 2 | $115B |
|
||
| Pharmaceuticals / Biotech | 2 | $62B |
|
||
Property tax history
+6.3%/yrLatest (2025): $237 · +1.0% YoY. Source: county tax records.
Cash-flow waterfall
monthlySold comps — $/sqft
last 12 mo · ≤1 miLoading sold comps…