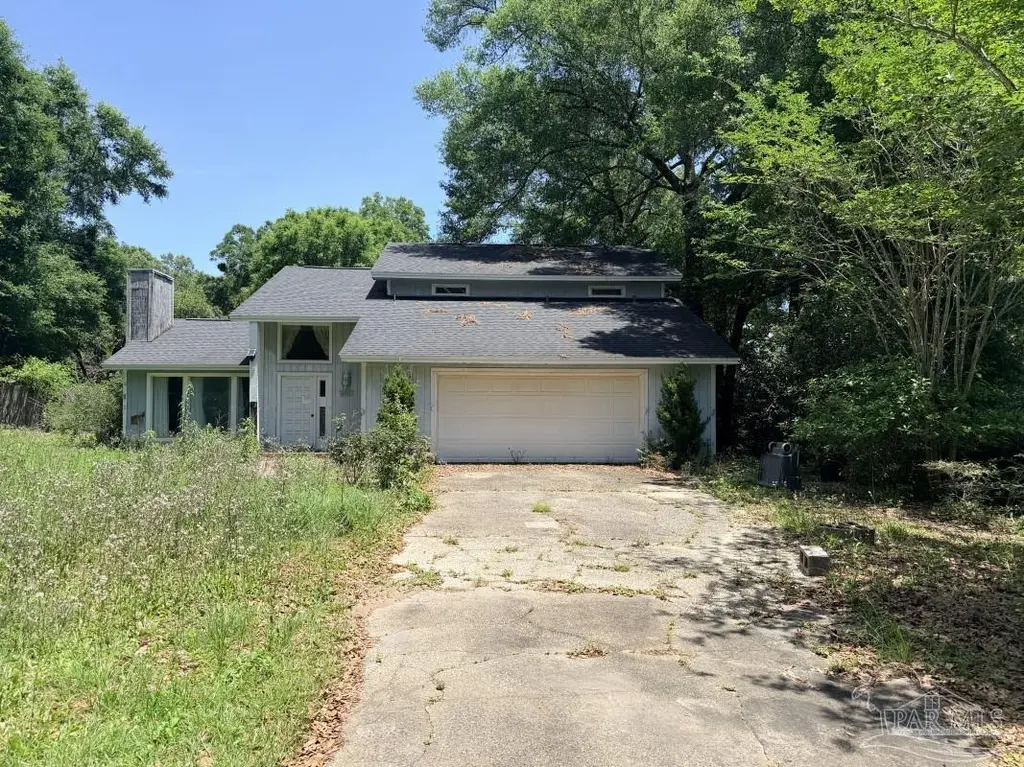
834 Fleming Ct · Gonzalez, FL
Flood risk 1/10 · Minimal
- FEMA flood zone
- X (unshaded)
- Chance of flooding over 30 yrs
- 0.0%
- Est. flood insurance / yr
- $507 – $1,088
Fire risk 3/10 · Minor
- Est. fire insurance / yr
- $947 – $1,759
Heat risk 10/10 · Severe
- Hot days now (above 106°F)
- 7 days/yr
- Hot days in 30 yrs
- 22 days/yr
Wind risk 9/10 · Severe
- Chance of severe wind over 30 yrs
- 99.0%
Air-quality risk 1/10 · Minimal
- Unhealthy air days now
- 0 days/yr
- Unhealthy air days in 30 yrs
- 0 days/yr
Risk factors via First Street. Map © Google.
Why this score? — see what drove the C+ grade
The composite is a weighted blend of 9 inputs, each scored 0–100. Each bar is that input's sub-score; the figure is the points it added to the 100-point composite (weight × sub-score).
- Cash flow +27.4/30.0
- DSCR +9.6/10.0
- 1% rule +7.5/10.0
- ARV discount +7.5/15.0
- Schools +3.6/10.0
- Livability +3.6/5.0
- Rent growth +2.7/5.0
- Condition / age +2.5/5.0
- Appreciation +0.0/10.0
$170,000
🖨 Deal sheet 📄 Offer letter ✓ Due diligence
Listing remarks
Mid-century modern flip opportunity in a strong Pensacola neighborhood! This 3 bed, 2.5 bath, 2,338 sqft 2-story home sits on a quiet cul-de-sac and features a pool, Florida room, and tons of potential. The property needs a full renovation, but the layout, character, size, and surrounding comps make this a prime investment play. Perfect for an investor looking for a high-upside project in a desirable area. Bring this one back to life and take advantage of the ARV potential!
Key facts
- Mid-century modern
- Quiet cul-de-sac
- Florida room
Tags
Property features AI
Finance
- Other: Roads are county maintained
- HOA & community: Homeowners association with an annual fee of $45 (includes association)
Exterior
- Parking: Attached 2-car garage; Covered parking for 2 vehicles; Total of 2 parking spaces
- Utilities: Circuit breaker electric service; Public sewer; Public water
- Home design: Resale single-family home; Two levels; Not attached to another property; Slab foundation
- Construction: Frame construction; Composition roof
- Exterior features: In-ground pool; Located on a cul-de-sac; Public water
Interior
- Kitchen: Kitchen on the first floor (approximately 12' x 9')
- Bedrooms: Master bedroom on the first floor (approximately 14' x 12')
- Flooring: Carpet; Simulated wood
- Bathrooms: 2 full bathrooms; 1 half bathroom
- Heating & cooling: Central heating; Fireplace heating; Central air conditioning
- Interior features: Carpet and simulated wood flooring; Living/dining combo; Fireplace
- Laundry & utility: Electric water heater
Neighborhood map
What this means for you Summary
Snapshot
- This is a 3-bed/3.0-bath single-family listed at $170k.
Deal economics
- At list price, monthly cash flow is $497 ($6k/yr) — positive.
- The deal already cash-flows at list — no discount required.
- Meets the 1% rule at list price ($2k rent vs $170k).
- Recommended offer: $167k (1.5% below list) — sets the bar for market timing.
- Cap rate 9.8% vs local median 4.2% in Gonzalez — top-decile yield for the area; either an underpriced asset or a hidden risk that comps aren't pricing in. Stress-test before assuming the spread holds.
Location & tenants
- Location reads 71/100 on livability (#385 in FL) — a middle-class / working-renter tenant base. Strengths: cost of living A+, housing A+, employment A; Watch: amenities F, commute F, health & safety F.
- Escambia (suburban): math 40% / reading 45% proficiency, ranked #56 of 73 in FL (top 77%) — families likely to look elsewhere, expect single-tenant / working-renter base with shorter leases.
- Market conditions: Rents flat; 221 active listings in the ZIP; 2 comparable units currently listed for rent nearby; 1,479 units permitted in Escambia County in 2024 (0 in 5+ unit buildings).
- This rent runs 38% of the median local income ($67k/yr) — at the standard rent-burdened threshold; future hikes will face affordability resistance.
Forward outlook
- Local home prices are declining (-3.0%/yr); year-one equity from $1k of loan paydown is wiped out by about $5k of value loss. Plan a longer hold.
- Escambia County population projected at +13% by 2050 — modest demand growth; plan on rents tracking national, not racing it.
Negotiation context
- It's been on market 18 days — a 2% lower offer ($167k) is reasonable based on typical stale-listing flexibility.
- Current owner paid $130k; 31% above their basis — modest negotiation headroom, anchor on the comps not their cost.
Risks & watch-outs
- Climate carrying-cost: severe wind risk, 99% chance of damaging wind over 30y; extreme-heat days projected 7→22/yr by 2055 (HVAC capex compounding) — expect insurance premiums to compound above CPI over the hold.
Questions for the listing agent
- What does the HOA fee cover, when was the last increase, and are there any pending special assessments or reserve-fund shortfalls?
- Is there a deadline driving the sale (1031 exchange, divorce, estate, relocation)? That informs how much negotiation room exists.
- What's the average days-on-market for RENTAL listings here right now (not sales)? A rising rental-DOM trend means longer vacancies and softer asking-rent achievability than the comps imply.
- What's the recent tenant-quality profile in this submarket — average credit score on applications, eviction rate, late-payment / NSF rate, and stable-employment percentage? A property-management company in the area should have these aggregated.
- How much new for-sale + rental construction is in the pipeline within 1–3 miles? Heavy new supply typically softens prices + rents 12–24 months out; constrained supply supports both.
Investment metrics
- 1% rule
- 1.25% ✓
- Cap rate
- 9.80%
- Cash-on-cash
- 12.53%
- DSCR
- 1.56
- GRM
- 6.7
CMA / ARV
- ARV (on-the-fly)
- $358,200
- Comps found
- 12
Show comp detail 12 sales within ~0.75 mi
| Address | Dist | Beds/Ba | Sqft | Sold | Price | $/sf | Match |
|---|---|---|---|---|---|---|---|
| 760 Boulder Crk | 0.26mi | 3/2.0 | 2,239 (-6%) | 5mo | $365,000 | $163 | 69 |
| 11624 Clear Creek Dr | 0.42mi | 4/2.5 (+1) | 2,346 (-2%) | 6mo | $480,000 | $205 | 65 |
| 3104 Lost Creek Dr | 0.43mi | 4/2.0 (+1) | 2,235 (-6%) | 1mo | $329,000 | $147 | 60 |
| 11739 Old Course Rd | 0.57mi | 4/2.0 (+1) | 2,320 (-3%) | 1mo | $330,000 | $142 | 59 |
| 10969 Country Ostrich Dr | 0.63mi | 4/3.0 (+1) | 2,267 (-5%) | 1mo | $320,000 | $141 | 57 |
| 11820 Old Course Rd | 0.59mi | 4/2.0 (+1) | 2,330 (-2%) | 5mo | $317,500 | $136 | 55 |
| 896 Lexington Rd | 0.47mi | 3/2.0 | 2,198 (-8%) | 7mo | $295,000 | $134 | 55 |
| 2924 Fallen Tree Dr | 0.46mi | 4/2.0 (+1) | 2,543 (+6%) | 6mo | $350,000 | $138 | 53 |
| 10889 Country Ostrich Dr | 0.74mi | 4/3.0 (+1) | 2,266 (-5%) | 3mo | $355,000 | $157 | 50 |
| 958 Bucyrus Ln | 0.72mi | 3/3.0 | 2,632 (+10%) | 2mo | $525,000 | $199 | 48 |
| 11841 Old Course Rd | 0.54mi | 3/2.0 | 2,065 (-14%) | 4mo | $309,900 | $150 | 45 |
| 901 Shadow Ridge Dr | 0.67mi | 4/2.0 (+1) | 2,239 (-6%) | 6mo | $399,900 | $179 | 44 |
Match score weights: distance 35% · size 25% · config 20% · recency 20%. Top-matched comps best support the ARV.
Projected returns pro-forma
-3.0% appreciation · 0.76% rent growth · sell at horizon
- IRR
- -0.3%
- Equity multiple
- 0.99×
- Total profit
- $-518
- Equity at exit
- $25,348
- IRR
- 6.9%
- Equity multiple
- 1.47×
- Total profit
- $22,140
- Equity at exit
- $14,698
Cash invested: $47,600 (down + closing). Projections, not guarantees.
Landlord ↔ Tenant lean methodology
- Overall (STATE)
- 87 Strongly Landlord-Friendly
- State Florida
- 87 Strongly Landlord-Friendly · R+3
- County
- — inherits STATE
- City
- — inherits STATE
ZIP-level market 32514
- Home prices YoY
- -31.2%
- Rents YoY
- 0.8%
- Active inventory
- 221
- Price-to-rent
- 6.7×
Monthly cashflow live
- Estimated rent
- $2,117 medium interval (Pro) →
- Mortgage (P&I)
- −$891
- Tax from tax record
- −$209 /mo · $2,511/yr
- Insurance
- −$71
- HOA
- −$4
- Vacancy / Maint / Mgmt
- −$445
- Net cashflow
- $497
Break-even live
UW: 25.0% down · 7.5% · 30yr · 1.5% tax · 5.0% vac · 8.0% maint · 8.0% mgmt
Financing live
Cash to close
- Down payment
- $42,500
- Closing costs
- $5,100
- Reserves months
- —
- Total cash needed
- —
Loan-product check · same deal, 3 products live
Conventional
25% down · 7.5% · 30yr
- Down + closing
- —
- Monthly P&I
- —
- Monthly cashflow
- —
- DSCR
- —
- Eligible?
- —
Personal DTI + credit; lowest rate.
DSCR
20% down · 8.5% · 30yr
- Down + closing
- —
- Monthly P&I
- —
- Monthly cashflow
- —
- DSCR
- —
- Eligible?
- —
No personal income docs; deal must DSCR.
Hard money
10% down · 12.0% · 12mo
- Down + closing
- —
- Monthly P&I
- —
- Monthly cashflow
- —
- DSCR
- —
- Eligible?
- —
Short-term bridge; refi at stabilization.
Rent comps 2 comps
| Address | Beds | Baths | Sqft | Rent | $/sqft | DOM | Units | Dist |
|---|---|---|---|---|---|---|---|---|
| 404 Buxton Way Cantonment, FL | 4.0 | 3.0 | 2200 | $2,495 | $1.13 | 23d | 1 | 1.23mi |
| 1232 Greystone Ln Pensacola, FL | 3.0 | 2.0 | 1628 | $2,100 | $1.29 | 23d | 1 | 1.36mi |
HOA detail
- Monthly dues
- $4 · $48/yr
- Likely covers
- pool
Listing history 14 events
-
2026-06-14status $170,000 Pending 18 DOM
-
2026-06-10days on market $170,000 Active 18 DOM
-
2026-06-09days on market $170,000 Active 17 DOM
-
2026-06-08days on market $170,000 Active 16 DOM
-
2026-06-07days on market $170,000 Active 15 DOM
-
2026-06-03days on market $170,000 Active 11 DOM
-
2026-06-02days on market $170,000 Active 10 DOM
-
2026-06-01days on market $170,000 Active 9 DOM
-
2026-05-31days on market $170,000 Active 8 DOM
-
2026-05-31statusdays on market $170,000 Active 7 DOM
-
2026-05-21$170,000 Active
-
1999-08-27soldstatus $129,900
-
1989-11-01soldstatus $74,500
-
1981-11-01soldstatus $77,900
ⓘ Source: listings_history table (triggers on properties + properties_extension) + one-shot
backfill from property_details.listing_events for pre-trigger history.
Tax reassessment forecast FL · Resets to sale price
- Current annual tax
- $2,511 · $209/mo
- Projected year-2 tax
- $2,511 · $209/mo
- Expected delta
- $0/yr ($0/mo · 0.0%)
ⓘ Screening estimate from a state-policy table — verify with the county assessor before closing.
Climate risk First Street
- Flood 1/10 Low FEMA zone X (unshaded) · 0% chance over 30 yrs
- Wildfire 3/10 Moderate
- Heat 10/10 Extreme 7 d/yr ≥106°F today · 22 d/yr by 30 yrs out
- Wind 9/10 Extreme 99% chance of damaging wind over 30 yrs
- Air quality 1/10 Low 0 unhealthy d/yr today · 0 by 30 yrs out
Nearby sold comps map
Loading sold comps map…
Walkable amenities ~0.75 mi
Loading nearby amenities…
Taxation est. · year 1
- Rental income
- $25,409
- − Mortgage interest
- −$9,523
- − Property taxes
- −$2,511
- − Insurance
- −$850
- − Repairs & maintenance
- −$2,033
- − Management
- −$2,033
- − HOA
- −$48
- − Depreciation
- −$4,945
- Taxable income
- $3,466
- Est. tax owed @ 24.0%
- −$832
- After-tax cash flow
- $5,134/yr
For passive investors: Depreciation is non-cash, so a rental often shows a tax loss while cash-flowing — sheltering income. Rental losses are passive: they offset passive income freely, and up to $25,000/yr can offset ordinary (W-2) income if you actively participate and your MAGI is under $100k (phasing out to $0 by $150k); unused losses carry forward. On sale, claimed depreciation is recaptured at up to 25%, and gains may owe capital-gains tax (a 1031 exchange can defer both). Figures are a year-1 estimate at your 24.0% rate — not tax advice; consult a CPA.
Schools (NCES district)
- District
- Escambia
- NCES district ID
- 1200510
- Math proficiency
- 40% ▼ -9.00%
- Reading proficiency
- 45% ▼ -4.00%
- Median HH income
- $44,649
- Composite
- 36.04/100
- National rank
- #4773
- State rank
- #56 of 73 in FL
Livability — Gonzalez
- Score
- 71/100
- State rank
- #385
- US rank
- #6813
Category grades
Schools grade is shown separately in the Schools card above.
Census & demographics
- County
- Escambia County · 301,722 people
- Metro
- Pensacola-Ferry Pass-Brent, FL
- Population (ZIP)
- 42,447
- Household income
- $66,644
- Rent vs Own
- Severe rent burden
- 1962.0
Population outlook (Escambia County) Hauer SSP2
- Today (2025)
- 334,637 people
- By 2030
- 345,779 · +3.3%
- By 2040
- 364,828 · +9.0%
- By 2050
- 378,514 · +13.1%
- By 2075
- 403,220 · +20.5%
- By 2100
- 386,125 · +15.4%
Race, ethnicity, and origin ACS 2023
- Neighborhood character
- Diverse neighborhood (Simpson 0.55)
- Race & ethnicity
- White 63% Black 22% Two or more races 9% Hispanic / Latino 7% Asian 2%
- Hispanic origin (detail)
- Mexican 2% Puerto Rican 2%
- Common ancestry
- Italian 3% Lithuanian 2% Slovak 2%
- Foreign-born
- 6% · Canada, South Korea
- Languages at home
- 91% English-only · Spanish 5% Other Indo-European 1% Tagalog/Filipino 1%
Political lean MEDSL · Escambia
- 2024 margin
- R (+19.5) · D 39.7% · R 59.2% · Other 1.1%
- 2008→2024 swing
- -0.2pp no change · 2008: -19.3pp · 2024: -19.5pp
- All cycles
- 2024: R+19.5 2020: R+15.1 2016: R+20.6 2012: R+20.6 2008: R+19.3
Not yet ingested
- Civics
- —
Market trends
- HPI YoY
- ▼ -120.99%
- Current HPI
- 266.7408
- Rent YoY
- ▲ 0.76%
- Metro
- Pensacola-Ferry Pass-Brent, FL
- State GDP YoY
- ▲ 3.28%
- F500 in state
- 36
Industry mix (Fortune 500 HQ in FL)
| Industry | F500 HQs | Revenue |
|---|---|---|
| Industrial Technology | 2 | $29B |
|
||
| Insurance | 2 | $17B |
|
||
| Retail | 1 | $60B |
|
||
| Technology Distribution | 1 | $58B |
|
||
| Homebuilding | 1 | $35B |
|
||
| Technology Manufacturing | 1 | $35B |
|
||
Price history
+118.2% since first listed4 events — show timeline
- 2026-05-21 Listed $170,000 PARMLS
- 1999-08-27 Sold (Public Records) $129,900 Public Records
- 1989-11-01 Sold (Public Records) $74,500 Public Records
- 1981-11-01 Sold (Public Records) $77,900 Public Records
Property tax history
+6.2%/yrLatest (2025): $2,511 · +23.2% YoY. Source: county tax records.
Cash-flow waterfall
monthlySold comps — $/sqft
last 12 mo · ≤1 miLoading sold comps…