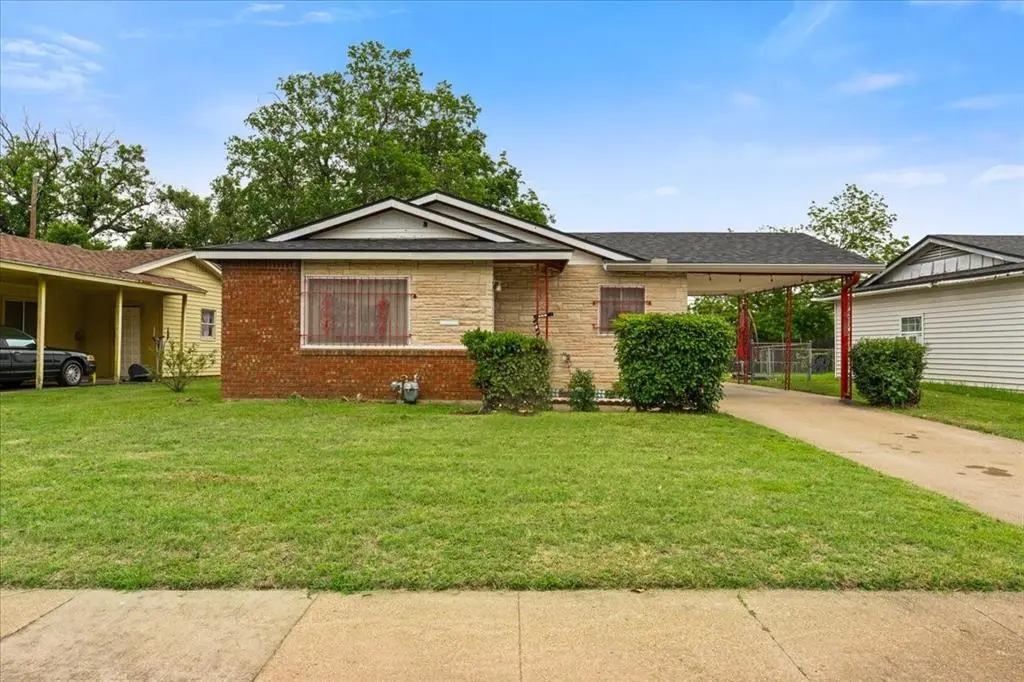
313 Dearborn St · Waco, TX
Flood risk 6/10 · Moderate
- FEMA flood zone
- X (shaded)
- Chance of flooding over 30 yrs
- 0.27%
- Est. flood insurance / yr
- $507 – $1,088
Fire risk 4/10 · Minor
- Est. fire insurance / yr
- $1,222 – $2,270
Heat risk 7/10 · Major
- Hot days now (above 109°F)
- 7 days/yr
- Hot days in 30 yrs
- 24 days/yr
Wind risk 6/10 · Moderate
- Chance of severe wind over 30 yrs
- 63.0%
Air-quality risk 2/10 · Minimal
- Unhealthy air days now
- 0 days/yr
- Unhealthy air days in 30 yrs
- 1 days/yr
Risk factors via First Street. Map © Google.
Why this score? — see what drove the C- grade
The composite is a weighted blend of 9 inputs, each scored 0–100. Each bar is that input's sub-score; the figure is the points it added to the 100-point composite (weight × sub-score).
- Cash flow +19.0/30.0
- ARV discount +10.6/15.0
- DSCR +6.0/10.0
- 1% rule +5.2/10.0
- Livability +3.7/5.0
- Appreciation +2.5/10.0
- Rent growth +2.5/5.0
- Condition / age +2.5/5.0
- Schools +1.8/10.0
$164,500
🖨 Deal sheet (PDF) 📄 Offer letter ✓ Due diligence
Listing remarks
Great opportunity in the heart of Waco! This property offers a functional layout with spacious living areas and plenty of potential to make it your own. Whether you're looking for your next home or an investment opportunity, this one checks the boxes. The home includes a refrigerator, washer, dryer, and cooktop stove—all conveying with the sale, adding immediate value and convenience. With a little vision and updating, this property can truly shine. Ideally located near major highways, shopping, dining, and local attractions, providing both accessibility and long-term appeal. Opportunities like this don’t come around often—schedule your showing today! Multiple offers antic
Key facts
- Refrigerator
- Functional layout
- Dryer
Tags
Property features AI
Finance
- Other: Listing is Active and offered with exclusive right to sell
- HOA & community: No association
Exterior
- Parking: Attached carport (covered, 1 space); Driveway; 1 carport space
- Utilities: City sewer; No municipal utility district
- Home design: Single-family residence; Built in 1959; Not attached to another property
- Construction: Year built: 1959
- Exterior features: Accessible approach with ramp; Lot under 0.5 acre (approx. 0.209 acres); Subdivision: River Oaks 2
Interior
- Kitchen: Electric cooktop; Kitchen with built-in cabinets
- Bedrooms: 3 bedrooms (Primary bedroom on level 1, others on level 1)
- Bathrooms: 2 full bathrooms
- Interior features: Paneling; One-level layout; Two living areas; Four total rooms
- Laundry & utility: Full-size washer/dryer area
Neighborhood map
What this means for you Summary
Snapshot
- This is a 3-bed/1.0-bath single-family listed at $164k.
Deal economics
- At list price, monthly cash flow is $171 ($2k/yr) — positive.
- The deal already cash-flows at list — no discount required.
- Meets the 1% rule at list price ($2k rent vs $164k).
- Recommended offer: $160k (3.0% below list) — sets the bar for market timing.
- Cap rate 7.5% vs local median 3.9% in Waco — top-decile yield for the area; either an underpriced asset or a hidden risk that comps aren't pricing in. Stress-test before assuming the spread holds.
Location & tenants
- Location reads 74/100 on livability (#166 in TX, #4,378 nationally) — a middle-class / working-renter tenant base. Strengths: cost of living A+, housing A+, health & safety A+; Watch: crime D, commute F, employment D-.
- Waco ISD (urban): math 20% / reading 24% proficiency, ranked #773 of 826 in TX (top 94%) — low school quality limits family demand, transient renter base, plan for 1-2y turnover; 81% free/reduced lunch — lower-income household profile, screen leases tightly.
- Zoned schools: J H Hines El (math 8% / reading 12%, grade F, #4,259 of 4,322 statewide, top 99%, 406 students, 98% FRL, charter); G W Carver Middle (math 9% / reading 13%, grade F, #1,634 of 1,662 statewide, top 99%, 393 students, 96% FRL, charter); Waco H S (math 26% / reading 24%, grade F, #1,250 of 1,632 statewide, top 77%, 2,011 students, 88% FRL).
- Market conditions: 87 active listings in the ZIP; 25 comparable units currently listed for rent nearby; rentals at typical pace (median 23d on market — plan ~3-4 weeks tenant-placement turnaround); lower-income renter base — watch delinquency; 1,014 units permitted in McLennan County in 2024 (200 in 5+ unit buildings).
- At $1,670/mo this rent would consume 66% of the median local household income ($30k/yr) (locally 603% of renters already pay >50% of income on rent) — very limited rent-growth headroom before tenants either downsize or default.
Forward outlook
- Local home prices are declining (-3.0%/yr); year-one equity from $1k of loan paydown is wiped out by about $5k of value loss. Plan a longer hold.
- McLennan County population projected at +17% by 2050 — long-run rental-demand tailwind backs the buy-and-hold thesis.
Negotiation context
- It's been on market 40 days — a 3% lower offer ($160k) is reasonable based on typical stale-listing flexibility.
Risks & watch-outs
- Watch-outs: built in 1959 — expect roof / HVAC / electrical / plumbing capex.
- Climate carrying-cost: major flood risk; major wind risk, 63% chance of damaging wind over 30y; extreme-heat days projected 7→24/yr by 2055 (HVAC capex compounding) — expect insurance premiums to compound above CPI over the hold.
Questions for the listing agent
- It's been on market 40 days. Have you received any prior offers? Is the seller open to a 3% concession, seller financing, or rate buy-down credit?
- Built in 1959 — when were the roof, HVAC, electrical panel, plumbing, and water heater last replaced?
- Is there a deadline driving the sale (1031 exchange, divorce, estate, relocation)? That informs how much negotiation room exists.
- Schools are D-rated, which usually means shorter tenancies and higher turnover. Who's the typical renter profile here, and what's been the actual vacancy rate?
- Crime grade is D in this area — have there been break-ins, vandalism, or insurance claims at this property in the last 3 years? What carrier currently insures it and at what premium?
- What's the average days-on-market for RENTAL listings here right now (not sales)? A rising rental-DOM trend means longer vacancies and softer asking-rent achievability than the comps imply.
- What's the recent tenant-quality profile in this submarket — average credit score on applications, eviction rate, late-payment / NSF rate, and stable-employment percentage? A property-management company in the area should have these aggregated.
- How much new for-sale + rental construction is in the pipeline within 1–3 miles? Heavy new supply typically softens prices + rents 12–24 months out; constrained supply supports both.
Investment metrics
- 1% rule
- 1.02% ✓
- Cap rate
- 7.54%
- Cash-on-cash
- 4.45%
- DSCR
- 1.20
- GRM
- 8.2
CMA / ARV
- ARV (median comp)
- $176,736
- List price
- $164,500
- Delta
- -6.92%
- Verdict
- FAIR
- Comps
- 20 within 1.0 mi
Show comp detail 12 sales within ~0.75 mi
| Address | Dist | Beds/Ba | Sqft | Sold | Price | $/sf | Match |
|---|---|---|---|---|---|---|---|
| 401 Carver St | 0.08mi | 3/2.0 | 1,381 (+3%) | 11mo | $130,000 | $94 | 78 |
| 621 Delano St | 0.40mi | 3/2.0 | 1,256 (-6%) | 1mo | $219,900 | $175 | 66 |
| 401 Mahon Hollow Dr | 0.49mi | 3/2.0 | 1,291 (-4%) | 2mo | $224,000 | $174 | 65 |
| 301 Lorraine Dr | 0.63mi | 3/2.0 | 1,326 (-1%) | 9mo | $36,400 | $27 | 58 |
| 2104 Dan Rowe St | 0.57mi | 3/2.0 | 1,409 (+5%) | 4mo | $188,000 | $133 | 57 |
| 1124 Faulkner Ln | 0.63mi | 3/2.0 | 1,327 (-1%) | 11mo | $217,999 | $164 | 56 |
| 909 Lenox St | 0.47mi | 3/2.0 | 1,448 (+8%) | 8mo | $228,999 | $158 | 54 |
| 1500 J J Flewellen Rd | 0.54mi | 2/2.0 (-1) | 1,286 (-4%) | 7mo | $82,500 | $64 | 53 |
| 1009 Dearborn St | 0.51mi | 3/1.0 | 1,478 (+10%) | 9mo | $209,500 | $142 | 51 |
| 1525 N 6th St | 0.73mi | 3/2.0 | 1,322 (-1%) | 11mo | $200,000 | $151 | 51 |
| 420 Mahon Hollow Dr | 0.51mi | 3/2.0 | 1,192 (-11%) | 10mo | $239,000 | $201 | 45 |
| 1417 N 6th St | 0.74mi | 4/2.0 (+1) | 1,154 (-14%) | 1mo | $245,500 | $213 | 32 |
Match score weights: distance 35% · size 25% · config 20% · recency 20%. Top-matched comps best support the ARV.
Projected returns pro-forma
-3.0% appreciation · 3.0% rent growth · sell at horizon
- IRR
- -9.3%
- Equity multiple
- 0.66×
- Total profit
- $-15,744
- Equity at exit
- $24,527
- IRR
- 0.1%
- Equity multiple
- 1.01×
- Total profit
- $432
- Equity at exit
- $14,223
Cash invested: $46,060 (down + closing). Projections, not guarantees.
Landlord ↔ Tenant lean methodology
- Overall (STATE)
- 87 Strongly Landlord-Friendly
- State Texas
- 87 Strongly Landlord-Friendly · R+5
- County
- — inherits STATE
- City
- — inherits STATE
ZIP-level market 76704
- Home prices YoY
- -2.7%
- Active inventory
- 87
- Price-to-rent
- 8.2×
Monthly cashflow live
- Estimated rent
- $1,670 high interval (Pro) →
- Mortgage (P&I)
- −$863
- Tax from tax record
- −$217 /mo · $2,605/yr
- Insurance
- −$69
- HOA
- −$0
- Vacancy / Maint / Mgmt
- −$351
- Net cashflow
- $171
Break-even live
Sensitivity live
| Price | -10% $264 | -5% $217 | +0% $171 | +5% $124 | +10% $78 |
|---|---|---|---|---|---|
| Rent | -10% $39 | -5% $105 | +0% $171 | +5% $237 | +10% $303 |
| Rate | -1.0pp $254 | -0.5pp $213 | base $171 | +0.5pp $128 | +1.0pp $85 |
UW: 25.0% down · 7.5% · 30yr · 1.5% tax · 5.0% vac · 8.0% maint · 8.0% mgmt
Financing live
Cash to close
- Down payment
- $41,125
- Closing costs
- $4,935
- Reserves months
- —
- Total cash needed
- —
Loan-product check · same deal, 3 products live
Conventional
25% down · 7.5% · 30yr
- Down + closing
- —
- Monthly P&I
- —
- Monthly cashflow
- —
- DSCR
- —
- Eligible?
- —
Personal DTI + credit; lowest rate.
DSCR
20% down · 8.5% · 30yr
- Down + closing
- —
- Monthly P&I
- —
- Monthly cashflow
- —
- DSCR
- —
- Eligible?
- —
No personal income docs; deal must DSCR.
Hard money
10% down · 12.0% · 12mo
- Down + closing
- —
- Monthly P&I
- —
- Monthly cashflow
- —
- DSCR
- —
- Eligible?
- —
Short-term bridge; refi at stabilization.
Rent comps 25 comps
| Address | Beds | Baths | Sqft | Rent | $/sqft | DOM | Units | Dist |
|---|---|---|---|---|---|---|---|---|
| 412 Dearborn St Waco, TX | 3.0 | 2.0 | 1572 | $2,000 | $1.27 | 23d | 1 | 0.07mi |
| 1104 Sherman St Waco, TX | 2.0 | 1.0 | 1120 | $1,500 | $1.34 | 45d | 1 | 0.33mi |
| 108 Choctaw Ct Waco, TX | 3.0 | 2.0 | 1273 | $1,600 | $1.26 | 15d | 1 | 0.52mi |
| 2017 Broadway St Waco, TX | 3.0 | 1.0 | 1247 | $1,800 | $1.44 | 45d | 1 | 0.55mi |
| 1500 E James St Unit A Waco, TX | 4.0 | 4.0 | 1764 | $2,750 | $1.56 | 46d | 1 | 0.57mi |
| 609 Sherman St Waco, TX | 3.0 | 2.0 | 1028 | $1,449 | $1.41 | 23d | 1 | 0.63mi |
| 825 Garrison St Waco, TX | 3.0 | 2.0 | 1028 | $1,370 | $1.33 | 15d | 1 | 0.72mi |
| 932 Dawson St Waco, TX | 3.0 | 2.0 | 1028 | $1,449 | $1.41 | 15d | 1 | 0.80mi |
| 1606 N 9th St Waco, TX | 4.0 | 2.0 | 1392 | $1,525 | $1.10 | 23d | 1 | 0.88mi |
| 1107 Chestnut St Waco, TX | 2.0 | 1.0 | 928 | $1,300 | $1.40 | 23d | 1 | 0.92mi |
| 712 Proctor Ave Waco, TX | 4.0 | 2.0 | 1184 | $1,450 | $1.22 | 23d | 1 | 0.96mi |
| 916 Olive St Waco, TX | 3.0 | 2.0 | 1028 | $1,475 | $1.43 | 15d | 1 | 0.98mi |
| 215 Washington Ave Waco, TX | 1.0–4.0 | 1.0–4.0 | 919 | $1,737 | $1.89 | 23d | 1 | 1.04mi |
| 1226 Chestnut St Unit A Waco, TX | 3.0 | 2.0 | 980 | $925 | $0.94 | 23d | 1 | 1.04mi |
| 1600 N 11th St Unit A Waco, TX | 3.0 | 2.0 | 1217 | $1,750 | $1.44 | 45d | 1 | 1.05mi |
| 1110 N 11th St Waco, TX | 3.0 | 2.0 | 1172 | $1,495 | $1.28 | 23d | 1 | 1.14mi |
| 1104 N 11th St Waco, TX | 3.0 | 2.0 | 1231 | $1,650 | $1.34 | 23d | 1 | 1.14mi |
| 1319 Tabor St Waco, TX | 3.0 | 1.5 | 1234 | $1,700 | $1.38 | 15d | 1 | 1.20mi |
| 804 N 11th St Waco, TX | 1.0–2.0 | 1.0 | 838 | $1,200 | $1.43 | 23d | 1 | 1.21mi |
| 1013 Earle Ave Waco, TX | 3.0 | 2.0 | 1028 | $1,525 | $1.48 | 23d | 1 | 1.24mi |
| 1511 Maple Ave Waco, TX | 3.0 | 2.0 | 1487 | $1,450 | $0.98 | 45d | 1 | 1.25mi |
| 1008 E Pecan Ave Waco, TX | 3.0 | 1.0 | 1400 | $1,350 | $0.96 | 15d | 1 | 1.27mi |
| 716 N 13th St Waco, TX | 4.0 | 2.0 | 1349 | $1,675 | $1.24 | 23d | 1 | 1.36mi |
| 3400 Adeline Dr Waco, TX | 2.0 | 1.0 | 1232 | $1,150 | $0.93 | 45d | 1 | 1.46mi |
| 1621 Alexander Ave Unit A Waco, TX | 3.0 | 2.0 | 1400 | $1,695 | $1.21 | 23d | 1 | 1.47mi |
Listing history 18 events
-
2026-06-21days on market $164,500 Active 40 DOM
-
2026-06-18days on market $164,500 Active 37 DOM
-
2026-06-17days on market $164,500 Active 36 DOM
-
2026-06-16days on market $164,500 Active 35 DOM
-
2026-06-15days on market $164,500 Active 34 DOM
-
2026-06-14days on market $164,500 Active 32 DOM
-
2026-06-13days on market $164,500 Active 31 DOM
-
2026-06-10days on market $164,500 Active 29 DOM
-
2026-06-09days on market $164,500 Active 28 DOM
-
2026-06-08days on market $164,500 Active 27 DOM
-
2026-06-07days on market $164,500 Active 26 DOM
-
2026-06-05days on market $164,500 Active 23 DOM
-
2026-06-03days on market $164,500 Active 22 DOM
-
2026-06-02days on market $164,500 Active 21 DOM
-
2026-06-01days on market $164,500 Active 20 DOM
-
2026-05-31days on market $164,500 Active 19 DOM
-
2026-05-30days on market $164,500 Active 18 DOM
-
2026-04-22$164,500 Active 712-char remark
ⓘ Source: listings_history table (triggers on properties + properties_extension) + one-shot
backfill from property_details.listing_events for pre-trigger history.
Tax reassessment forecast TX · Resets to sale price
- Current annual tax
- $2,605 · $217/mo
- Projected year-2 tax
- $3,010 · $251/mo
- Expected delta
- +$406/yr (+$34/mo · 15.6%)
ⓘ Screening estimate from a state-policy table — verify with the county assessor before closing.
Climate risk First Street
- Flood 6/10 Major FEMA zone X (shaded) · 27% chance over 30 yrs
- Wildfire 4/10 Moderate
- Heat 7/10 Severe 7 d/yr ≥109°F today · 24 d/yr by 30 yrs out
- Wind 6/10 Major 63% chance of damaging wind over 30 yrs
- Air quality 2/10 Low 0 unhealthy d/yr today · 1 by 30 yrs out
Nearby sold comps map
Loading sold comps map…
Walkable amenities ~0.75 mi
Loading nearby amenities…
Taxation est. · year 1
- Rental income
- $20,037
- − Mortgage interest
- −$9,215
- − Property taxes
- −$2,605
- − Insurance
- −$822
- − Repairs & maintenance
- −$1,603
- − Management
- −$1,603
- − Depreciation
- −$4,785
- Taxable loss
- −$596
- Est. tax savings @ 24.0%
- +$143
- After-tax cash flow
- $2,193/yr
For passive investors: Depreciation is non-cash, so a rental often shows a tax loss while cash-flowing — sheltering income. Rental losses are passive: they offset passive income freely, and up to $25,000/yr can offset ordinary (W-2) income if you actively participate and your MAGI is under $100k (phasing out to $0 by $150k); unused losses carry forward. On sale, claimed depreciation is recaptured at up to 25%, and gains may owe capital-gains tax (a 1031 exchange can defer both). Figures are a year-1 estimate at your 24.0% rate — not tax advice; consult a CPA.
Schools (NCES district)
- District
- Waco ISD
- NCES district ID
- 4844280
- Math proficiency
- 20% ▼ -14.00%
- Reading proficiency
- 24% ▼ -6.00%
- Median HH income
- $29,208
- Composite
- 17.57/100
- National rank
- #9043
- State rank
- #773 of 826 in TX
Livability — Waco
- Score
- 74/100
- State rank
- #166
- US rank
- #4378
Category grades
Schools grade is shown separately in the Schools card above.
Census & demographics
- Census place
- Waco, TX
- County
- McLennan County · 213,088 people
- City population
- 125,319
- Metro
- Waco, TX
- Population (ZIP)
- 7,018
- Household income
- $30,349
- Rent vs Own
- Severe rent burden
- 603.0
Population outlook (McLennan County) Hauer SSP2
- Today (2025)
- 264,191 people
- By 2030
- 273,578 · +3.6%
- By 2040
- 291,506 · +10.3%
- By 2050
- 308,044 · +16.6%
- By 2075
- 349,648 · +32.3%
- By 2100
- 364,779 · +38.1%
Race, ethnicity, and origin ACS 2023
- Neighborhood character
- Predominantly Black (67%)
- Race & ethnicity
- Black 67% Hispanic / Latino 19% Two or more races 11% White 10%
- Hispanic origin (detail)
- Mexican 17%
- Common ancestry
- Lithuanian 2%
- Foreign-born
- 6% · Canada
- Languages at home
- 86% English-only · Spanish 14%
Political lean MEDSL · McLennan
- 2024 margin
- Solid R (+30.9) · D 34.0% · R 64.9% · Other 1.0%
- 2008→2024 swing
- -7.0pp toward R · 2008: -23.9pp · 2024: -30.9pp
- All cycles
- 2024: R+30.9 2020: R+23.4 2016: R+27.1 2012: R+29.8 2008: R+23.9
Not yet ingested
- Civics
- —
Market trends
- HPI YoY
- ▼ -5.09%
- Current HPI
- 181.8051
- Rent YoY
- —
- Metro
- Waco, TX
- State GDP YoY
- ▲ 3.95%
- F500 in state
- 110
Industry mix (Fortune 500 HQ in TX)
| Industry | F500 HQs | Revenue |
|---|---|---|
| Energy | 16 | $1,198B |
|
||
| Technology | 5 | $198B |
|
||
| Engineering / Construction | 4 | $72B |
|
||
| Energy Services | 3 | $60B |
|
||
| Utilities | 3 | $41B |
|
||
| Healthcare | 2 | $330B |
|
||
Price history
1 event — show timeline
- 2026-04-22 Listed $164,500 NTREIS
Property tax history
+6.0%/yrLatest (2025): $2,605 · +9.6% YoY. Source: county tax records.
Cash-flow waterfall
monthlySold comps — $/sqft
last 12 mo · ≤1 miLoading sold comps…