 🏷️ Likely Rental
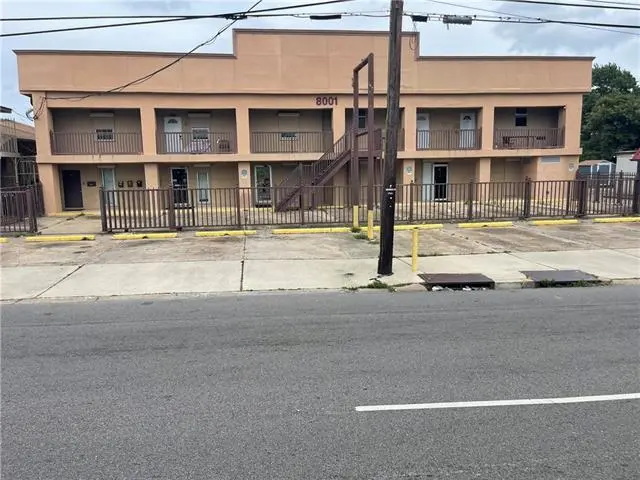
8001 D Downman Rd · New Orleans, LA
Flood risk No data
- FEMA flood zone
- —
- Chance of flooding over 30 yrs
- —
- Est. flood insurance / yr
- —
Fire risk No data
- Est. fire insurance / yr
- —
Heat risk No data
- Hot days now (above threshold)
- —
- Hot days in 30 yrs
- —
Wind risk No data
- Chance of severe wind over 30 yrs
- —
Air-quality risk No data
- Unhealthy air days now
- —
- Unhealthy air days in 30 yrs
- —
Risk factors via First Street. Map © Google.
Why this score? — see what drove the D grade
The composite is a weighted blend of 9 inputs, each scored 0–100. Each bar is that input's sub-score; the figure is the points it added to the 100-point composite (weight × sub-score).
- Cash flow +15.0/30.0
- ARV discount +7.5/15.0
- 1% rule +5.0/10.0
- DSCR +5.0/10.0
- Livability +4.0/5.0
- Condition / age +2.5/5.0
- Rent growth +2.4/5.0
- Schools +1.6/10.0
- Appreciation +0.0/10.0
$1,400
🖨 Deal sheet 📄 Offer letter ✓ Due diligence
Listing remarks MLS
Multifamily apartments available for lease in New Orleans East. Conveniently located on a bus route, this property offers easy access to public transportation, making it a practical choice for residents traveling to work, school, shopping, medical appointments, and other daily destinations. This apartment community provides a great opportunity for tenants seeking a convenient New Orleans East location with access to nearby major corridors and community services. The bus route access adds strong everyday value for residents who need reliable transportation options. Whether you are looking for comfortable living, convenient access, or a location that keeps you connected, these New Orleans East multifamily apartments are worth a closer look. Contact a member of the KW Commercial Fraiche Team today for leasing details and showing information.
Key facts
- Built 1977
- Listed 9 days
Property features AI
Finance
- Other: Tenant pays electricity; owner pays water; Property is a single-unit building
Exterior
- Parking: Off-street parking
- Utilities: Public water; Public sewer
- Home design: 2-story building
- Construction: Brick construction; Asphalt roof; Slab foundation; Built with average condition
- Exterior features: Fenced yard; City lot; Rectangular lot
Interior
- Bathrooms: 2 full bathrooms
- Heating & cooling: Central heating; Central air conditioning; HVAC energy-efficient features
- Interior features: Average condition; In-unit laundry
- Laundry & utility: Washer/dryer located in unit
Neighborhood map
What this means for you Summary
Snapshot
- This is a 3-bed/2.0-bath single-family listed at $1k.
Deal economics
- At list price, monthly cash flow is $1k ($16k/yr) — positive.
- The deal already cash-flows at list — no discount required.
- Meets the 1% rule at list price ($2k rent vs $1k).
- Cap rate 1162.3% vs local median 4.4% in New Orleans — top-decile yield for the area; either an underpriced asset or a hidden risk that comps aren't pricing in. Stress-test before assuming the spread holds.
Location & tenants
- Location reads 81/100 on livability (#3 in LA, #1,383 nationally) — a professional / high-income tenant draw. Strengths: amenities A+, commute A+, health & safety A+; Watch: crime C-, employment D.
- Orleans Parish (urban): math 11% / reading 27% proficiency, ranked #69 of 98 in LA (top 70%) — low school quality limits family demand, transient renter base, plan for 1-2y turnover; 68% free/reduced lunch — lower-income household profile, screen leases tightly.
- Market conditions: Rents soft (-0.2%/yr); 224 active listings in the ZIP; 27 comparable units currently listed for rent nearby; rentals at typical pace (median 24d on market — plan ~3-4 weeks tenant-placement turnaround); lower-income renter base — watch delinquency; 710 units permitted in Orleans Parish in 2024 (244 in 5+ unit buildings).
- At $1,719/mo this rent would consume 49% of the median local household income ($42k/yr) (locally 1767% of renters already pay >50% of income on rent) — very limited rent-growth headroom before tenants either downsize or default.
Forward outlook
- Local home prices are declining (-3.0%/yr); year-one equity from $10 of loan paydown is wiped out by about $42 of value loss. Plan a longer hold.
- Orleans County population projected at +61% by 2050 — long-run rental-demand tailwind backs the buy-and-hold thesis.
- At projected returns (-3.0% appreciation + 0.0% rent growth), your $392 cash investment doubles in ~1 year — after that, you're playing with house money.
Negotiation context
- Only 9 days on market — expect competitive offers; lowballing is unlikely to land.
- 2 sale attempts with the ask held roughly flat each time — persistent listings suggest the price (not the market) is what's stuck; bring a comps-based counter.
Questions for the listing agent
- Built in 1977 — when were the roof, HVAC, electrical panel, plumbing, and water heater last replaced?
- Is there a deadline driving the sale (1031 exchange, divorce, estate, relocation)? That informs how much negotiation room exists.
- The area grade is low — what's the realistic commute time and amenity access for the typical tenant pool here? Any planned neighborhood developments (good or bad) we should know about?
- What's the average days-on-market for RENTAL listings here right now (not sales)? A rising rental-DOM trend means longer vacancies and softer asking-rent achievability than the comps imply.
- What's the recent tenant-quality profile in this submarket — average credit score on applications, eviction rate, late-payment / NSF rate, and stable-employment percentage? A property-management company in the area should have these aggregated.
- How much new for-sale + rental construction is in the pipeline within 1–3 miles? Heavy new supply typically softens prices + rents 12–24 months out; constrained supply supports both.
Investment metrics
- 1% rule
- 122.81% ✓
- Cap rate
- 1162.28%
- Cash-on-cash
- 4128.52%
- DSCR
- 184.70
- GRM
- 0.1
CMA / ARV
- ARV (on-the-fly)
- $169,500
- Comps found
- 11
Show comp detail 11 sales within ~0.75 mi
| Address | Dist | Beds/Ba | Sqft | Sold | Price | $/sf | Match |
|---|---|---|---|---|---|---|---|
| 5704 Count Ln | 0.22mi | 3/1.5 | 1,400 (-7%) | 14mo | $85,000 | $61 | 65 |
| 7180 W Laverne St | 0.55mi | 3/2.0 | 1,540 (+3%) | 10mo | $260,000 | $169 | 62 |
| 7840 W Laverne St | 0.10mi | 3/2.0 | 1,684 (+12%) | 16mo | $235,000 | $140 | 62 |
| 7445 Beau St | 0.33mi | 3/2.0 | 1,644 (+10%) | 22mo | $185,000 | $113 | 50 |
| 6953 E Laverne St | 0.73mi | 2/1.0 (-1) | 1,560 (+4%) | 4mo | $87,000 | $56 | 47 |
| 7407 Cornwall Pl | 0.34mi | 2/1.5 (-1) | 1,400 (-7%) | 24mo | $75,000 | $54 | 46 |
| 6401 Wales St | 0.40mi | 3/2.0 | 1,285 (-14%) | 18mo | $156,000 | $121 | 42 |
| 50 Martin Dr | 0.73mi | 3/2.0 | 1,336 (-11%) | 13mo | $180,000 | $135 | 37 |
| 1307 Chimney Wood Ln | 0.45mi | 3/2.5 | 1,700 (+13%) | 23mo | $78,500 | $46 | 36 |
| 6731 Coventry St St | 0.70mi | 3/2.0 | 1,647 (+10%) | 19mo | $116,000 | $70 | 35 |
| 18 Curtis Dr | 0.75mi | 2/2.0 (-1) | 1,296 (-14%) | 8mo | $150,000 | $116 | 31 |
Match score weights: distance 35% · size 25% · config 20% · recency 20%. Top-matched comps best support the ARV.
Projected returns pro-forma
-3.0% appreciation · 0.0% rent growth · sell at horizon
- IRR
- —
- Equity multiple
- 206.76×
- Total profit
- $80,656
- Equity at exit
- $209
- IRR
- —
- Equity multiple
- 412.92×
- Total profit
- $161,472
- Equity at exit
- $121
Cash invested: $392 (down + closing). Projections, not guarantees.
Landlord ↔ Tenant lean methodology
- Overall (STATE)
- 90 Strongly Landlord-Friendly
- State Louisiana
- 90 Strongly Landlord-Friendly · R+12
- County
- — inherits STATE
- City
- — inherits STATE
ZIP-level market 70126
- Home prices YoY
- -17.0%
- Rents YoY
- -0.2%
- Active inventory
- 224
- Price-to-rent
- 0.1×
Monthly cashflow live
- Estimated rent
- $1,719 high interval (Pro) →
- Mortgage (P&I)
- −$7
- Tax est. 1.5%
- −$2 /mo · $21/yr
- Insurance
- −$1
- HOA
- −$0
- Vacancy / Maint / Mgmt
- −$361
- Net cashflow
- $1,349
Break-even live
UW: 25.0% down · 7.5% · 30yr · 1.5% tax · 5.0% vac · 8.0% maint · 8.0% mgmt
Financing live
Cash to close
- Down payment
- $350
- Closing costs
- $42
- Reserves months
- —
- Total cash needed
- —
Loan-product check · same deal, 3 products live
Conventional
25% down · 7.5% · 30yr
- Down + closing
- —
- Monthly P&I
- —
- Monthly cashflow
- —
- DSCR
- —
- Eligible?
- —
Personal DTI + credit; lowest rate.
DSCR
20% down · 8.5% · 30yr
- Down + closing
- —
- Monthly P&I
- —
- Monthly cashflow
- —
- DSCR
- —
- Eligible?
- —
No personal income docs; deal must DSCR.
Hard money
10% down · 12.0% · 12mo
- Down + closing
- —
- Monthly P&I
- —
- Monthly cashflow
- —
- DSCR
- —
- Eligible?
- —
Short-term bridge; refi at stabilization.
Rent comps 27 comps
| Address | Beds | Baths | Sqft | Rent | $/sqft | DOM | Units | Dist |
|---|---|---|---|---|---|---|---|---|
| 7918 W Laverne St New Orleans, LA | 3.0 | 2.0 | 1166 | $1,750 | $1.50 | 23d | 1 | 0.05mi |
| 6025 Wales St New Orleans, LA | 3.0 | 1.0 | 1147 | $1,550 | $1.35 | 23d | 1 | 0.11mi |
| 6027 Wales St New Orleans, LA | 3.0 | 1.0 | 1146 | $1,550 | $1.35 | 23d | 1 | 0.12mi |
| 6030 Kuebel Dr New Orleans, LA | 3.0 | 2.0 | 1100 | $1,600 | $1.45 | 23d | 1 | 0.12mi |
| 6032 Kuebel Dr New Orleans, LA | 3.0 | 2.0 | 1100 | $1,600 | $1.45 | 23d | 1 | 0.12mi |
| 7702 Belcrest Pl New Orleans, LA | 3.0 | 1.5 | 1150 | $1,650 | $1.43 | 23d | 1 | 0.18mi |
| 7611 Mayfair Pl New Orleans, LA | 2.0 | 1.5 | 1440 | $1,450 | $1.01 | 3d | 1 | 0.21mi |
| 5704 Count Ln New Orleans, LA | 3.0 | 1.5 | 1572 | $1,700 | $1.08 | 23d | 1 | 0.21mi |
| 7404 Sussex Pl New Orleans, LA | 2.0 | 1.5 | 1400 | $1,450 | $1.04 | 2d | 1 | 0.35mi |
| 7530 Newcastle St New Orleans, LA | 3.0 | 2.0 | 1913 | $1,800 | $0.94 | 23d | 1 | 0.51mi |
| 5925 Pauline Dr New Orleans, LA | 3.0 | 2.0 | 1566 | $2,325 | $1.48 | 16d | 1 | 0.86mi |
| 5747 Pauline Dr New Orleans, LA | 3.0 | 1.0 | 1300 | $1,400 | $1.08 | 11d | 1 | 0.93mi |
| 6628 Harbourview Dr New Orleans, LA | 3.0 | 2.5 | 1520 | $1,700 | $1.12 | 3d | 1 | 1.11mi |
| 4722 Shalimar Dr New Orleans, LA | 3.0 | 2.0 | 1157 | $1,400 | $1.21 | 23d | 1 | 1.13mi |
| 4819 21 Francis Dr New Orleans, LA | 3.0 | 1.0 | 1272 | $1,880 | $1.48 | 3d | 1 | 1.15mi |
| 8025 Pompano St New Orleans, LA | 3.0 | 1.0 | 1131 | $1,595 | $1.41 | 16d | 1 | 1.16mi |
| 4745 Francis Dr New Orleans, LA | 3.0 | 2.0 | 1311 | $1,550 | $1.18 | 16d | 1 | 1.20mi |
| 7909 Edward St New Orleans, LA | 3.0 | 1.5 | 1073 | $1,850 | $1.72 | 3d | 1 | 1.25mi |
| 5920 Boeing St New Orleans, LA | 3.0 | 1.5 | 1340 | $1,400 | $1.04 | 23d | 1 | 1.27mi |
| 4722 Mithra St New Orleans, LA | 3.0 | 1.5 | 1295 | $1,600 | $1.24 | 23d | 1 | 1.29mi |
| 4522 Shalimar Dr New Orleans, LA | 3.0 | 2.0 | 1350 | $1,850 | $1.37 | 23d | 1 | 1.31mi |
| 4527 Shalimar Dr New Orleans, LA | 3.0 | 1.5 | 1174 | $1,550 | $1.32 | 23d | 1 | 1.32mi |
| 4441 Cessna Ct New Orleans, LA | 3.0 | 1.5 | 1400 | $1,600 | $1.14 | 23d | 1 | 1.36mi |
| 6530 Peoples Ave New Orleans, LA | 3.0 | 2.0 | 1200 | $1,800 | $1.50 | 23d | 1 | 1.37mi |
| 4409 Skyview Dr New Orleans, LA | 4.0 | 2.5 | 1560 | $1,700 | $1.09 | 16d | 1 | 1.38mi |
| 5550 Press Dr New Orleans, LA | 3.0 | 2.0 | 1640 | $2,000 | $1.22 | 16d | 1 | 1.45mi |
| 6416 Baccich St New Orleans, LA | 3.0 | 2.0 | 1908 | $2,500 | $1.31 | 43d | 1 | 1.45mi |
Listing history 7 events
-
2026-06-18days on market $1,400 Active 9 DOM
-
2026-06-17days on market $1,400 Active 8 DOM
-
2026-06-16days on market $1,400 Active 7 DOM
-
2026-06-15days on market $1,400 Active 6 DOM
-
2026-06-13days on market $1,400 Active 4 DOM
-
2026-06-10remarks 699-char remark
-
2026-06-10$1,400 Active 1 DOM
ⓘ Source: listings_history table (triggers on properties + properties_extension) + one-shot
backfill from property_details.listing_events for pre-trigger history.
Nearby sold comps map
Loading sold comps map…
Walkable amenities ~0.75 mi
Loading nearby amenities…
Taxation est. · year 1
- Rental income
- $20,633
- − Mortgage interest
- −$78
- − Property taxes
- −$21
- − Insurance
- −$7
- − Repairs & maintenance
- −$1,651
- − Management
- −$1,651
- − Depreciation
- −$41
- Taxable income
- $17,184
- Est. tax owed @ 24.0%
- −$4,124
- After-tax cash flow
- $12,060/yr
For passive investors: Depreciation is non-cash, so a rental often shows a tax loss while cash-flowing — sheltering income. Rental losses are passive: they offset passive income freely, and up to $25,000/yr can offset ordinary (W-2) income if you actively participate and your MAGI is under $100k (phasing out to $0 by $150k); unused losses carry forward. On sale, claimed depreciation is recaptured at up to 25%, and gains may owe capital-gains tax (a 1031 exchange can defer both). Figures are a year-1 estimate at your 24.0% rate — not tax advice; consult a CPA.
Schools (NCES district)
- District
- Orleans Parish
- NCES district ID
- 2201170
- Math proficiency
- 11% ▼ -52.00%
- Reading proficiency
- 27% ▼ -46.00%
- Median HH income
- $37,011
- Composite
- 15.78/100
- National rank
- #9271
- State rank
- #69 of 98 in LA
Livability — New Orleans
- Score
- 81/100
- State rank
- #3
- US rank
- #1383
Category grades
Schools grade is shown separately in the Schools card above.
Census & demographics
- Census place
- New Orleans, LA
- County
- Orleans Parish · 338,817 people
- City population
- 338,817
- Metro
- New Orleans-Metairie, LA
- Population (ZIP)
- 27,047
- Household income
- $41,709
- Rent vs Own
- Severe rent burden
- 1767.0
Population outlook (Orleans County) Hauer SSP2
- Today (2025)
- 513,025 people
- By 2030
- 575,781 · +12.2%
- By 2040
- 700,174 · +36.5%
- By 2050
- 826,541 · +61.1%
- By 2075
- 1,123,374 · +119.0%
- By 2100
- 1,355,609 · +164.2%
Race, ethnicity, and origin ACS 2023
- Neighborhood character
- Predominantly Black (85%)
- Race & ethnicity
- Black 85% Hispanic / Latino 6% Two or more races 5% White 5%
- Hispanic origin (detail)
- Common ancestry
- Lithuanian 1% Italian 1%
- Foreign-born
- 4% · Canada, Vietnam
- Languages at home
- 94% English-only · Spanish 5% Other Indo-European 1%
Political lean MEDSL · Orleans
- 2024 margin
- Solid D (+67.0) · D 82.2% · R 15.2% · Other 2.7%
- 2008→2024 swing
- +6.7pp toward D · 2008: 60.3pp · 2024: 67.0pp
- All cycles
- 2024: D+67.0 2020: D+68.2 2016: D+66.2 2012: D+62.5 2008: D+60.3
Not yet ingested
- Civics
- —
Market trends
- HPI YoY
- ▼ -36.35%
- Current HPI
- 177.355
- Rent YoY
- ▼ -0.24%
- Metro
- New Orleans-Metairie, LA
- State GDP YoY
- ▲ 3.29%
- F500 in state
- 10
Industry mix (Fortune 500 HQ in LA)
| Industry | F500 HQs | Revenue |
|---|---|---|
| Telecommunications | 2 | $23B |
|
||
| Utilities | 1 | $12B |
|
||
| Wholesale / Distribution | 1 | $5B |
|
||
| Advertising | 1 | $2B |
|
||
Price history
+0.0% since first listed2 events — show timeline
- 2026-06-09 Listed $1,400 AcadianaMLS
- 2026-06-09 Listed $1,400 GSREIN
Cash-flow waterfall
monthlySold comps — $/sqft
last 12 mo · ≤1 miLoading sold comps…