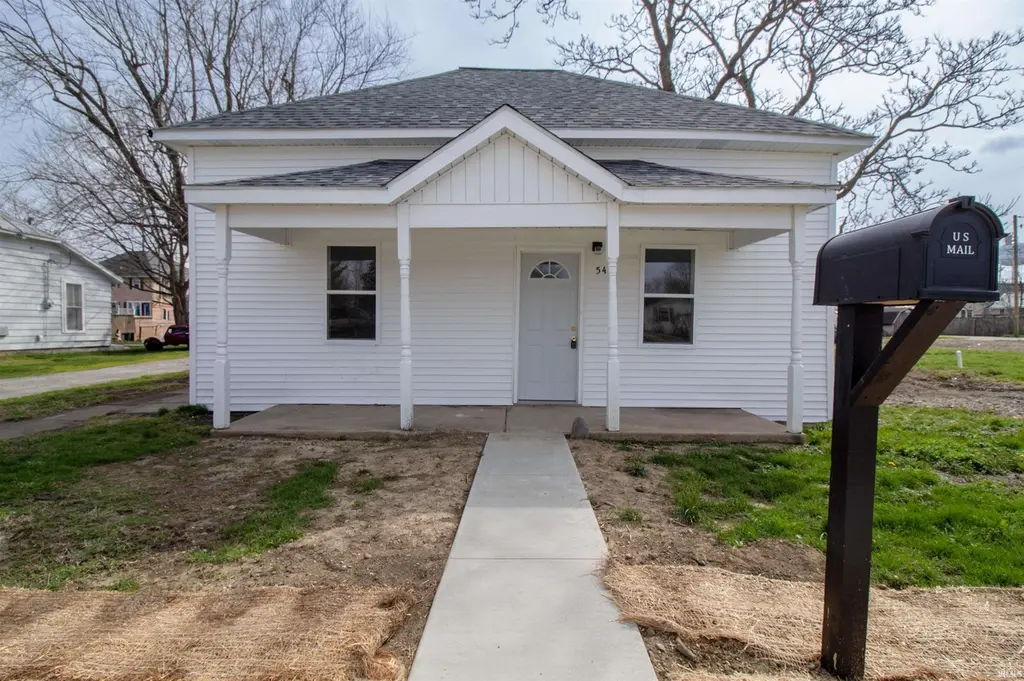
544 N Meridian St · Winchester, IN
Flood risk 1/10 · Minimal
- FEMA flood zone
- X (unshaded)
- Chance of flooding over 30 yrs
- 0.0%
- Est. flood insurance / yr
- $507 – $1,088
Fire risk 1/10 · Minimal
- Est. fire insurance / yr
- $717 – $1,331
Heat risk 3/10 · Minor
- Hot days now (above 100°F)
- 7 days/yr
- Hot days in 30 yrs
- 18 days/yr
Wind risk 2/10 · Minimal
- Chance of severe wind over 30 yrs
- 1.0%
Air-quality risk 3/10 · Minor
- Unhealthy air days now
- 2 days/yr
- Unhealthy air days in 30 yrs
- 4 days/yr
Risk factors via First Street. Map © Google.
Why this score? — see what drove the D grade
The composite is a weighted blend of 9 inputs, each scored 0–100. Each bar is that input's sub-score; the figure is the points it added to the 100-point composite (weight × sub-score).
- Cash flow +15.8/30.0
- Appreciation +10.0/10.0
- DSCR +4.9/10.0
- Livability +3.4/5.0
- 1% rule +3.0/10.0
- Schools +2.9/10.0
- Rent growth +2.5/5.0
- Condition / age +2.5/5.0
- ARV discount +0.0/15.0
$109,900
🖨 Deal sheet (PDF) 📄 Offer letter ✓ Due diligence
Listing remarks MLS
Welcome to 544 N Meridian Street! This charming 2-bed, 1-bath home offers 916 square feet of comfortable living space with a spacious feel. You'll love the generously sized rooms and ample closet space, providing both functionality and flexibility. Recent updates - including fresh paint and new flooring - give the home a clean, modern touch while maintaining its inviting character. Whether you're a first-time buyer or looking to downsize, this move-in-ready property is a fantastic opportunity!
Key facts
- 6,098 sq ft lot
- Built 1900
- Listed 80 days
Neighborhood map
What this means for you Summary
Snapshot
- This is a 2-bed/1.0-bath single-family listed at $110k.
Deal economics
- At list price, monthly cash flow is $50 ($600/yr) — positive.
- The deal already cash-flows at list — no discount required.
- To meet the 1% rule (rent ≥ 1% of price), the offer needs to be $88k (19.8% below list).
- Recommended offer: $88k (19.8% below list) — sets the bar for 1% rule.
- Cap rate 6.8% vs local median 5.1% in Winchester — top-decile yield for the area; either an underpriced asset or a hidden risk that comps aren't pricing in. Stress-test before assuming the spread holds.
Location & tenants
- Location reads 67/100 on livability (#240 in IN) — a middle-class / working-renter tenant base. Strengths: cost of living A+, housing A+, crime B; Watch: health & safety D, amenities F, commute F.
- Randolph Central School Corporation (town): math 32% / reading 37% proficiency, ranked #201 of 301 in IN (top 67%) — families likely to look elsewhere, expect single-tenant / working-renter base with shorter leases.
- Zoned schools: O R Baker Elementary School (338 students, 57% FRL); Lee L Driver Middle School (math 27% / reading 33%, grade F, #208 of 330 statewide, top 64%, 291 students, 56% FRL); Winchester Community High School (math 17% / reading 47%, grade F, #295 of 369 statewide, top 82%, 414 students, 47% FRL).
- Market conditions: 52 active listings in the ZIP; 19 units permitted in Randolph County in 2024 (0 in 5+ unit buildings).
Forward outlook
- In year one you build about $12k of equity ($760 loan paydown + $11k appreciation (10.0% local appreciation)).
- Randolph County population projected at -26% by 2050 — secular population decline; favor cash flow + early exit over multi-decade hold.
- At projected returns (10.0% appreciation + 3.0% rent growth), your $31k cash investment doubles in ~3 years — after that, you're playing with house money.
- By year 4, paydown + projected appreciation supports a ~$42k cash-out refi (75% LTV) — recoverable capital for the next deal without selling this one.
Negotiation context
- It's been on market 81 days — a 6% lower offer ($103k) is reasonable based on typical stale-listing flexibility.
Risks & watch-outs
- Watch-outs: built in 1900 — expect roof / HVAC / electrical / plumbing capex.
Questions for the listing agent
- It's been on market 81 days. Have you received any prior offers? Is the seller open to a 20% concession, seller financing, or rate buy-down credit?
- Built in 1900 — when were the roof, HVAC, electrical panel, plumbing, and water heater last replaced?
- Why hasn't it sold? Are there any deal-killer items the seller is aware of (foundation, flood, title, zoning, code violations)?
- Is there a deadline driving the sale (1031 exchange, divorce, estate, relocation)? That informs how much negotiation room exists.
- Schools are D-rated, which usually means shorter tenancies and higher turnover. Who's the typical renter profile here, and what's been the actual vacancy rate?
- The area grade is low — what's the realistic commute time and amenity access for the typical tenant pool here? Any planned neighborhood developments (good or bad) we should know about?
- What's the average days-on-market for RENTAL listings here right now (not sales)? A rising rental-DOM trend means longer vacancies and softer asking-rent achievability than the comps imply.
- What's the recent tenant-quality profile in this submarket — average credit score on applications, eviction rate, late-payment / NSF rate, and stable-employment percentage? A property-management company in the area should have these aggregated.
- How much new for-sale + rental construction is in the pipeline within 1–3 miles? Heavy new supply typically softens prices + rents 12–24 months out; constrained supply supports both.
Investment metrics
- 1% rule
- 0.80% ✗
- Cap rate
- 6.84%
- Cash-on-cash
- 1.95%
- DSCR
- 1.09
- GRM
- 10.4
CMA / ARV
- ARV (median comp)
- $78,966
- List price
- $109,900
- Delta
- 39.17%
- Verdict
- OVERPRICED
- Comps
- 20 within 1.0 mi
Show comp detail 4 sales within ~0.75 mi
| Address | Dist | Beds/Ba | Sqft | Sold | Price | $/sf | Match |
|---|---|---|---|---|---|---|---|
| 516 N Union St | 0.34mi | 2/1.0 | 1,049 (+14%) | 6mo | $78,000 | $74 | 54 |
| 419 E Carl St | 0.72mi | 2/1.0 | 877 (-4%) | 9mo | $103,900 | $118 | 51 |
| 865 N West St | 0.34mi | 3/1.0 (+1) | 1,008 (+10%) | 13mo | $52,400 | $52 | 51 |
| 425 Western Ave | 0.66mi | 2/1.0 | 1,008 (+10%) | 18mo | $85,000 | $84 | 38 |
Match score weights: distance 35% · size 25% · config 20% · recency 20%. Top-matched comps best support the ARV.
Projected returns pro-forma
10.0% appreciation · 3.0% rent growth · sell at horizon
- IRR
- 25.7%
- Equity multiple
- 3.05×
- Total profit
- $62,985
- Equity at exit
- $99,007
- IRR
- 22.6%
- Equity multiple
- 6.94×
- Total profit
- $182,863
- Equity at exit
- $213,512
Cash invested: $30,772 (down + closing). Projections, not guarantees.
Landlord ↔ Tenant lean methodology
- Overall (STATE)
- 90 Strongly Landlord-Friendly
- State Indiana
- 90 Strongly Landlord-Friendly · R+11
- County
- — inherits STATE
- City
- — inherits STATE
ZIP-level market 47394
- Home prices YoY
- 6.8%
- Active inventory
- 52
- Price-to-rent
- 10.4×
Monthly cashflow live
- Estimated rent
- $882 medium interval (Pro) →
- Mortgage (P&I)
- −$576
- Tax from tax record
- −$24 /mo · $292/yr
- Insurance
- −$46
- HOA
- −$0
- Vacancy / Maint / Mgmt
- −$185
- Net cashflow
- $50
Break-even live
Sensitivity live
| Price | -10% $112 | -5% $81 | +0% $50 | +5% $19 | +10% $-12 |
|---|---|---|---|---|---|
| Rent | -10% $-20 | -5% $15 | +0% $50 | +5% $85 | +10% $120 |
| Rate | -1.0pp $105 | -0.5pp $78 | base $50 | +0.5pp $22 | +1.0pp $-7 |
UW: 25.0% down · 7.5% · 30yr · 1.5% tax · 5.0% vac · 8.0% maint · 8.0% mgmt
Financing live
Cash to close
- Down payment
- $27,475
- Closing costs
- $3,297
- Reserves months
- —
- Total cash needed
- —
Loan-product check · same deal, 3 products live
Conventional
25% down · 7.5% · 30yr
- Down + closing
- —
- Monthly P&I
- —
- Monthly cashflow
- —
- DSCR
- —
- Eligible?
- —
Personal DTI + credit; lowest rate.
DSCR
20% down · 8.5% · 30yr
- Down + closing
- —
- Monthly P&I
- —
- Monthly cashflow
- —
- DSCR
- —
- Eligible?
- —
No personal income docs; deal must DSCR.
Hard money
10% down · 12.0% · 12mo
- Down + closing
- —
- Monthly P&I
- —
- Monthly cashflow
- —
- DSCR
- —
- Eligible?
- —
Short-term bridge; refi at stabilization.
Listing history 18 events
-
2026-06-22days on market $109,900 Active 81 DOM
-
2026-06-21days on market $109,900 Active 80 DOM
-
2026-06-21days on market $109,900 Active 79 DOM
-
2026-06-18days on market $109,900 Active 77 DOM
-
2026-06-17days on market $109,900 Active 76 DOM
-
2026-06-16days on market $109,900 Active 75 DOM
-
2026-06-15days on market $109,900 Active 74 DOM
-
2026-06-13days on market $109,900 Active 72 DOM
-
2026-06-12days on market $109,900 Active 71 DOM
-
2026-06-09days on market $109,900 Active 68 DOM
-
2026-06-08days on market $109,900 Active 67 DOM
-
2026-06-07days on market $109,900 Active 66 DOM
-
2026-06-04days on market $109,900 Active 62 DOM
-
2026-06-02days on market $109,900 Active 61 DOM
-
2026-06-01days on market $109,900 Active 60 DOM
-
2026-05-31days on market $109,900 Active 59 DOM
-
2026-05-31days on market $109,900 Active 58 DOM
-
2026-04-02$119,900 Active 498-char remark
Show marketing remark (498 chars)
Welcome to 544 N Meridian Street! This charming 2-bed, 1-bath home offers 916 square feet of comfortable living space with a spacious feel. You'll love the generously sized rooms and ample closet space, providing both functionality and flexibility. Recent updates - including fresh paint and new flooring - give the home a clean, modern touch while maintaining its inviting character. Whether you're a first-time buyer or looking to downsize, this move-in-ready property is a fantastic opportunity!
ⓘ Source: listings_history table (triggers on properties + properties_extension) + one-shot
backfill from property_details.listing_events for pre-trigger history.
Tax reassessment forecast IN · Partial reset (capped growth)
- Current annual tax
- $292 · $24/mo
- Projected year-2 tax
- $613 · $51/mo
- Expected delta
- +$321/yr (+$27/mo · 110.0%)
ⓘ Screening estimate from a state-policy table — verify with the county assessor before closing.
Climate risk First Street
- Flood 1/10 Low FEMA zone X (unshaded) · 0% chance over 30 yrs
- Wildfire 1/10 Low
- Heat 3/10 Moderate 7 d/yr ≥100°F today · 18 d/yr by 30 yrs out
- Wind 2/10 Low 100% chance of damaging wind over 30 yrs
- Air quality 3/10 Moderate 2 unhealthy d/yr today · 4 by 30 yrs out
Nearby sold comps map
Loading sold comps map…
Walkable amenities ~0.75 mi
Loading nearby amenities…
Taxation est. · year 1
- Rental income
- $10,580
- − Mortgage interest
- −$6,156
- − Property taxes
- −$292
- − Insurance
- −$550
- − Repairs & maintenance
- −$846
- − Management
- −$846
- − Depreciation
- −$3,197
- Taxable loss
- −$1,308
- Est. tax savings @ 24.0%
- +$314
- After-tax cash flow
- $914/yr
For passive investors: Depreciation is non-cash, so a rental often shows a tax loss while cash-flowing — sheltering income. Rental losses are passive: they offset passive income freely, and up to $25,000/yr can offset ordinary (W-2) income if you actively participate and your MAGI is under $100k (phasing out to $0 by $150k); unused losses carry forward. On sale, claimed depreciation is recaptured at up to 25%, and gains may owe capital-gains tax (a 1031 exchange can defer both). Figures are a year-1 estimate at your 24.0% rate — not tax advice; consult a CPA.
Schools (NCES district)
- District
- Randolph Central School Corporation
- NCES district ID
- 1801770
- Math proficiency
- 32% ▼ -7.00%
- Reading proficiency
- 37% ▼ -4.00%
- Median HH income
- $41,627
- Composite
- 29.12/100
- National rank
- #6589
- State rank
- #201 of 301 in IN
Livability — Winchester
- Score
- 67/100
- State rank
- #240
- US rank
- #10313
Category grades
Schools grade is shown separately in the Schools card above.
Census & demographics
- Census place
- Winchester, IN
- City population
- 8,137
- Population (ZIP)
- 8,137
Population outlook (Randolph County) Hauer SSP2
- Today (2025)
- 22,998 people
- By 2030
- 21,815 · -5.1%
- By 2040
- 19,360 · -15.8%
- By 2050
- 17,010 · -26.0%
- By 2075
- 12,491 · -45.7%
- By 2100
- 8,986 · -60.9%
Race, ethnicity, and origin ACS 2023
- Neighborhood character
- Predominantly White (96%)
- Race & ethnicity
- White 96% Two or more races 2% Hispanic / Latino 1%
- Common ancestry
- Lithuanian 2% Italian 2% Slovak 2%
- Foreign-born
- 1%
- Languages at home
- 99% English-only · Spanish 1% Other Asian/Pacific 1%
Political lean MEDSL · Randolph
- 2024 margin
- Solid R (+53.7) · D 22.3% · R 75.9% · Other 1.8%
- 2008→2024 swing
- -44.9pp toward R · 2008: -8.8pp · 2024: -53.7pp
- All cycles
- 2024: R+53.7 2020: R+52.4 2016: R+48.5 2012: R+24.1 2008: R+8.8
Not yet ingested
- Civics
- —
Market trends
- HPI YoY
- ▲ 14.76%
- Current HPI
- 233.216
- Rent YoY
- —
- Metro
- —
- State GDP YoY
- ▲ 2.90%
- F500 in state
- 18
Industry mix (Fortune 500 HQ in IN)
| Industry | F500 HQs | Revenue |
|---|---|---|
| Industrial Machinery | 2 | $37B |
|
||
| Healthcare | 1 | $177B |
|
||
| Pharmaceuticals | 1 | $45B |
|
||
| Metals / Steel | 1 | $18B |
|
||
| Agriculture | 1 | $17B |
|
||
| Packaging | 1 | $12B |
|
||
Price history
1 event — show timeline
- 2026-04-02 Listed $119,900 IRMLS
Property tax history
-2.7%/yrLatest (2024): $292 · +0.0% YoY. Source: county tax records.
Cash-flow waterfall
monthlySold comps — $/sqft
last 12 mo · ≤1 miLoading sold comps…