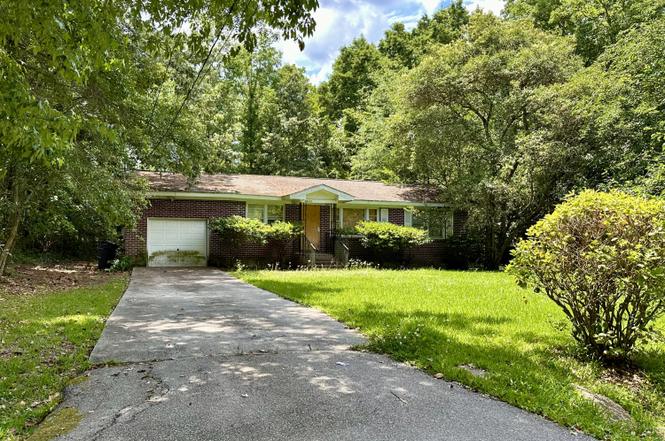
8943 Furr St · North Charleston, SC
Flood risk 1/10 · Minimal
- FEMA flood zone
- X (unshaded)
- Chance of flooding over 30 yrs
- 0.0%
- Est. flood insurance / yr
- $507 – $1,088
Fire risk 3/10 · Minor
- Est. fire insurance / yr
- $783 – $1,453
Heat risk 9/10 · Severe
- Hot days now (above 107°F)
- 7 days/yr
- Hot days in 30 yrs
- 17 days/yr
Wind risk 8/10 · Major
- Chance of severe wind over 30 yrs
- 99.0%
Air-quality risk 2/10 · Minimal
- Unhealthy air days now
- 2 days/yr
- Unhealthy air days in 30 yrs
- 2 days/yr
Risk factors via First Street. Map © Google.
Why this score? — see what drove the C grade
The composite is a weighted blend of 9 inputs, each scored 0–100. Each bar is that input's sub-score; the figure is the points it added to the 100-point composite (weight × sub-score).
- Cash flow +18.1/30.0
- ARV discount +15.0/15.0
- DSCR +5.7/10.0
- 1% rule +4.9/10.0
- Schools +4.3/10.0
- Livability +3.3/5.0
- Rent growth +2.8/5.0
- Condition / age +2.5/5.0
- Appreciation +0.0/10.0
$206,000
🖨 Deal sheet 📄 Offer letter ✓ Due diligence
Listing remarks
Attention all Investor/Rehab/Renovation Buyers - This property is 1 of 30 being sold by the Seller and can be purchased individually or as a group. A fantastic opportunity for investors, owner-occupants, or anyone looking for a renovation project. PLEASE NOTE: Properties are being sold strictly as-is and Seller will make no modifications or repairs. If square footage is important, please measure. Seller has set a call for offers to ensure all interested parties have equal opportunity to preview the homes, so please send your highest and best offer when you submit. * * * DUE TO TROPICAL STORM DEBBY the NEW OFFER DEADLINE is SUNDAY, 8/18/2024 at 11:59PM. * * * Seller will not respond to
Key facts
- 0.41 acre lot
- Garage
- Built 1986
Neighborhood map
What this means for you Summary
Snapshot
- This is a 3-bed/1.0-bath single-family listed at $206k.
Deal economics
- At list price, monthly cash flow is $181 ($2k/yr) — positive.
- The deal already cash-flows at list — no discount required.
- To meet the 1% rule (rent ≥ 1% of price), the offer needs to be $203k (1.4% below list).
- Recommended offer: $200k (3.0% below list) — sets the bar for market timing.
- Cap rate 7.3% vs local median 4.0% in North Charleston — top-decile yield for the area; either an underpriced asset or a hidden risk that comps aren't pricing in. Stress-test before assuming the spread holds.
Location & tenants
- Location reads 66/100 on livability (#122 in SC) — a middle-class / working-renter tenant base. Strengths: housing A+, health & safety A+, cost of living A; Watch: employment C-, crime F, amenities F.
- Charleston 01 (urban): math 48% / reading 53% proficiency, ranked #7 of 80 in SC (top 9%) — acceptable for families but not a draw, mixed tenant base, ~2y average lease.
- Zoned schools: A. C. Corcoran Elementary (math 21% / reading 16%, grade F, #506 of 597 statewide, top 85%, 767 students, 100% FRL); Northwoods Middle (math 11% / reading 16%, grade F, #207 of 229 statewide, top 91%, 738 students, 100% FRL); Rb Stall High (math 49% / reading 63%, grade C, #126 of 196 statewide, top 65%, 1,952 students, 100% FRL) — zoned schools average 100% FRL vs 44% district-wide (56 pts higher); higher-poverty schools than district average — tighter screening recommended.
- Zoned-school proficiency averages 29% at this address vs 50% district-wide (-21 pts) — the specific schools serving this property underperform the Charleston 01 average; the district grade overstates school quality for this exact location.
- Market conditions: Rents rising (+1.4%/yr); 174 active listings in the ZIP; 21 comparable units currently listed for rent nearby; rentals leasing fast (median 12d on market — plan ~1-2 weeks tenant-placement turnaround); 4,156 units permitted in Charleston County in 2024 (857 in 5+ unit buildings).
- At $2,031/mo this rent would consume 49% of the median local household income ($50k/yr) (locally 2054% of renters already pay >50% of income on rent) — very limited rent-growth headroom before tenants either downsize or default.
Forward outlook
- Local home prices are declining (-3.0%/yr); year-one equity from $1k of loan paydown is wiped out by about $6k of value loss. Plan a longer hold.
- Charleston County population projected at +44% by 2050 — long-run rental-demand tailwind backs the buy-and-hold thesis.
Negotiation context
- It's been on market 39 days — a 3% lower offer ($200k) is reasonable based on typical stale-listing flexibility.
- 2 sale attempts since 2y ago with the ask held roughly flat each time — persistent listings suggest the price (not the market) is what's stuck; bring a comps-based counter.
Risks & watch-outs
- Climate carrying-cost: severe wind risk, 99% chance of damaging wind over 30y; extreme-heat days projected 7→17/yr by 2055 (HVAC capex compounding) — expect insurance premiums to compound above CPI over the hold.
Questions for the listing agent
- It's been on market 39 days. Have you received any prior offers? Is the seller open to a 3% concession, seller financing, or rate buy-down credit?
- Is there a deadline driving the sale (1031 exchange, divorce, estate, relocation)? That informs how much negotiation room exists.
- Crime grade is F in this area — have there been break-ins, vandalism, or insurance claims at this property in the last 3 years? What carrier currently insures it and at what premium?
- What's the average days-on-market for RENTAL listings here right now (not sales)? A rising rental-DOM trend means longer vacancies and softer asking-rent achievability than the comps imply.
- What's the recent tenant-quality profile in this submarket — average credit score on applications, eviction rate, late-payment / NSF rate, and stable-employment percentage? A property-management company in the area should have these aggregated.
- How much new for-sale + rental construction is in the pipeline within 1–3 miles? Heavy new supply typically softens prices + rents 12–24 months out; constrained supply supports both.
Investment metrics
- 1% rule
- 0.99% ✗
- Cap rate
- 7.35%
- Cash-on-cash
- 3.77%
- DSCR
- 1.17
- GRM
- 8.5
CMA / ARV
- ARV (on-the-fly)
- $258,120
- Comps found
- 12
Show comp detail 12 sales within ~0.75 mi
| Address | Dist | Beds/Ba | Sqft | Sold | Price | $/sf | Match |
|---|---|---|---|---|---|---|---|
| 2772 Donner Ave | 0.37mi | 3/2.0 | 1,052 (-3%) | 2mo | $312,000 | $297 | 72 |
| 2931 Salamander Creek Ln | 0.15mi | 3/2.0 | 1,190 (+10%) | 5mo | $324,425 | $273 | 68 |
| 8867 Salamander Rd #63 | 0.25mi | 3/2.5 | 1,175 (+9%) | 1mo | $264,990 | $226 | 67 |
| 8867 Salamander Rd #15 | 0.25mi | 3/2.5 | 1,175 (+9%) | 1mo | $280,490 | $239 | 66 |
| 8867 Salamander Rd #10 | 0.25mi | 3/2.5 | 1,175 (+9%) | 1mo | $269,990 | $230 | 66 |
| 8867 Salamander Rd #66 | 0.25mi | 3/2.5 | 1,175 (+9%) | 2mo | $284,000 | $242 | 66 |
| 8867 Salamander Rd #19 | 0.25mi | 3/2.5 | 1,175 (+9%) | 2mo | $255,490 | $217 | 66 |
| 8867 Salamander Rd #18 | 0.25mi | 3/2.5 | 1,175 (+9%) | 2mo | $272,990 | $232 | 66 |
| 8867 Salamander Rd #4 | 0.19mi | 3/2.5 | 1,175 (+9%) | 6mo | $320,000 | $272 | 65 |
| 8867 Salamander Rd #13 | 0.25mi | 3/2.5 | 1,175 (+9%) | 4mo | $315,990 | $269 | 64 |
| 8867 Salamander Rd #7 | 0.25mi | 3/2.5 | 1,175 (+9%) | 6mo | $275,000 | $234 | 63 |
| 8934 Powell Rd | 0.55mi | 2/1.0 (-1) | 1,152 (+7%) | 1mo | $275,000 | $239 | 58 |
Match score weights: distance 35% · size 25% · config 20% · recency 20%. Top-matched comps best support the ARV.
Projected returns pro-forma
-3.0% appreciation · 1.37% rent growth · sell at horizon
- IRR
- -12.2%
- Equity multiple
- 0.56×
- Total profit
- $-25,093
- Equity at exit
- $30,715
- IRR
- -5.7%
- Equity multiple
- 0.66×
- Total profit
- $-19,891
- Equity at exit
- $17,811
Cash invested: $57,680 (down + closing). Projections, not guarantees.
Landlord ↔ Tenant lean methodology
- Overall (STATE)
- 90 Strongly Landlord-Friendly
- State South Carolina
- 90 Strongly Landlord-Friendly · R+6
- County
- — inherits STATE
- City
- — inherits STATE
ZIP-level market 29406
- Home prices YoY
- -6.7%
- Rents YoY
- 1.4%
- Active inventory
- 174
- Price-to-rent
- 8.5×
Monthly cashflow live
- Estimated rent
- $2,031 high interval (Pro) →
- Mortgage (P&I)
- −$1,080
- Tax est. 1.5%
- −$258 /mo · $3,090/yr
- Insurance
- −$86
- HOA
- −$0
- Vacancy / Maint / Mgmt
- −$427
- Net cashflow
- $181
Break-even live
UW: 25.0% down · 7.5% · 30yr · 1.5% tax · 5.0% vac · 8.0% maint · 8.0% mgmt
Financing live
Cash to close
- Down payment
- $51,500
- Closing costs
- $6,180
- Reserves months
- —
- Total cash needed
- —
Loan-product check · same deal, 3 products live
Conventional
25% down · 7.5% · 30yr
- Down + closing
- —
- Monthly P&I
- —
- Monthly cashflow
- —
- DSCR
- —
- Eligible?
- —
Personal DTI + credit; lowest rate.
DSCR
20% down · 8.5% · 30yr
- Down + closing
- —
- Monthly P&I
- —
- Monthly cashflow
- —
- DSCR
- —
- Eligible?
- —
No personal income docs; deal must DSCR.
Hard money
10% down · 12.0% · 12mo
- Down + closing
- —
- Monthly P&I
- —
- Monthly cashflow
- —
- DSCR
- —
- Eligible?
- —
Short-term bridge; refi at stabilization.
Rent comps 21 comps
| Address | Beds | Baths | Sqft | Rent | $/sqft | DOM | Units | Dist |
|---|---|---|---|---|---|---|---|---|
| 8907 Deerwood Dr North Charleston, SC | 2.0 | 2.0 | 1000 | $1,700 | $1.70 | 23d | 1 | 0.21mi |
| 9325 Blue House Rd Ladson, SC | 2.0 | 2.0 | 987 | $1,815 | $1.84 | 11d | 1 | 0.55mi |
| 9255 Blue House Rd Ladson, SC | 3.0 | 1.0–2.0 | 864 | $2,225 | $2.57 | 2d | 15 | 0.61mi |
| 3073 Brigham Ct North Charleston, SC | 3.0 | 2.0 | 1252 | $1,850 | $1.48 | 21d | 1 | 0.65mi |
| 9345 Blue House Rd Ladson, SC | 3.0 | 2.0 | 1471 | $2,285 | $1.55 | 19d | 1 | 0.67mi |
| 9345 Blue House Rd Ladson, SC | 3.0 | 2.0 | 1471 | $2,215 | $1.51 | 2d | 1 | 0.67mi |
| 9345 Blue House Rd Ladson, SC | 2.0 | 2.0 | 1256 | $1,855 | $1.48 | 11d | 1 | 0.67mi |
| 8755 Jenny Lind St Charleston, SC | 1.0–3.0 | 1.0–2.0 | 940 | $1,641 | $1.75 | 19d | 1 | 0.78mi |
| 2510 Atlantic Palms Ln Charleston, SC | 1.0–3.0 | 1.0–2.0 | 1006 | $2,251 | $2.24 | 2d | 20 | 0.86mi |
| 2605 Elms Plantation Blvd North Charleston, SC | 2.0 | 2.0 | 1071 | $1,455 | $1.36 | 23d | 1 | 0.87mi |
| 3000 Cypress Lk Rd North Charleston, SC | 1.0–3.0 | 1.0–2.0 | 1121 | $2,343 | $2.09 | 2d | 29 | 0.96mi |
| 8554 S Waccamaw Ct Charleston, SC | 3.0 | 2.0 | 1028 | $1,950 | $1.90 | 23d | 1 | 1.05mi |
| 8524 Brookforest Dr Charleston, SC | 3.0 | 2.0 | 1244 | $3,249 | $2.61 | 23d | 1 | 1.07mi |
| 3001 Cypress Lake Rd North Charleston, SC | 1.0–3.0 | 1.0–2.5 | 1008 | $2,600 | $2.58 | 2d | 26 | 1.09mi |
| 8483 Yadkin Cir Unit D Charleston, SC | 3.0 | 2.0 | 1414 | $1,800 | $1.27 | 11d | 1 | 1.11mi |
| 3730 Ingleside Blvd Ladson, SC | 1.0–3.0 | 1.0–2.0 | 1009 | $2,506 | $2.48 | 2d | 20 | 1.14mi |
| 8471 Yadkin Cir Unit M Charleston, SC | 3.0 | 2.5 | 1432 | $2,550 | $1.78 | 23d | 1 | 1.14mi |
| 3715 Ingleside Blvd Ladson, SC | 1.0–3.0 | 1.0–2.0 | 958 | $1,509 | $1.57 | 2d | 10 | 1.19mi |
| 8400 Palmetto Commerce Pkwy Ladson, SC | 1.0–3.0 | 1.0–2.0 | 1029 | $2,369 | $2.30 | 2d | 30 | 1.42mi |
| 8031 Hyannis Ct North Charleston, SC | 4.0 | 3.0 | 1500 | $2,150 | $1.43 | 19d | 1 | 1.46mi |
| 3300 Shipley St Ladson, SC | 1.0–3.0 | 1.0–2.0 | 1001 | $2,170 | $2.17 | 2d | 10 | 1.47mi |
Listing history 4 events
-
2024-09-10status Pending
-
2024-09-10status Active
-
2024-08-24historical Active Under Contract
-
2024-08-01$206,000 Active
ⓘ Source: listings_history table (triggers on properties + properties_extension) + one-shot
backfill from property_details.listing_events for pre-trigger history.
Climate risk First Street
- Flood 1/10 Low FEMA zone X (unshaded) · 0% chance over 30 yrs
- Wildfire 3/10 Moderate
- Heat 9/10 Extreme 7 d/yr ≥107°F today · 17 d/yr by 30 yrs out
- Wind 8/10 Severe 99% chance of damaging wind over 30 yrs
- Air quality 2/10 Low 2 unhealthy d/yr today · 2 by 30 yrs out
Nearby sold comps map
Loading sold comps map…
Walkable amenities ~0.75 mi
Loading nearby amenities…
Taxation est. · year 1
- Rental income
- $24,376
- − Mortgage interest
- −$11,539
- − Property taxes
- −$3,090
- − Insurance
- −$1,030
- − Repairs & maintenance
- −$1,950
- − Management
- −$1,950
- − Depreciation
- −$5,993
- Taxable loss
- −$1,176
- Est. tax savings @ 24.0%
- +$282
- After-tax cash flow
- $2,456/yr
For passive investors: Depreciation is non-cash, so a rental often shows a tax loss while cash-flowing — sheltering income. Rental losses are passive: they offset passive income freely, and up to $25,000/yr can offset ordinary (W-2) income if you actively participate and your MAGI is under $100k (phasing out to $0 by $150k); unused losses carry forward. On sale, claimed depreciation is recaptured at up to 25%, and gains may owe capital-gains tax (a 1031 exchange can defer both). Figures are a year-1 estimate at your 24.0% rate — not tax advice; consult a CPA.
Schools (NCES district)
- District
- Charleston 01
- NCES district ID
- 4501440
- Math proficiency
- 48% ▼ -2.00%
- Reading proficiency
- 53% ▬ 0.00%
- Median HH income
- $52,376
- Composite
- 43.41/100
- National rank
- #3018
- State rank
- #7 of 80 in SC
Livability — North Charleston
- Score
- 66/100
- State rank
- #122
- US rank
- #12222
Category grades
Schools grade is shown separately in the Schools card above.
Census & demographics
- Census place
- North Charleston, SC
- County
- Charleston County · 366,793 people
- City population
- 108,266
- Metro
- Charleston-North Charleston, SC
- Population (ZIP)
- 32,001
- Household income
- $49,815
- Rent vs Own
- Severe rent burden
- 2054.0
Population outlook (Charleston County) Hauer SSP2
- Today (2025)
- 480,562 people
- By 2030
- 525,921 · +9.4%
- By 2040
- 612,189 · +27.4%
- By 2050
- 691,627 · +43.9%
- By 2075
- 847,979 · +76.5%
- By 2100
- 926,482 · +92.8%
Race, ethnicity, and origin ACS 2023
- Neighborhood character
- Diverse neighborhood (Simpson 0.70)
- Race & ethnicity
- Black 40% White 32% Hispanic / Latino 19% Two or more races 9% Asian 3%
- Hispanic origin (detail)
- Mexican 10% Puerto Rican 1%
- Common ancestry
- Romanian 1% Italian 1% Lithuanian 1%
- Foreign-born
- 15% · Canada, Vietnam
- Languages at home
- 79% English-only · Spanish 17% Vietnamese 1% Tagalog/Filipino 1%
Political lean MEDSL · Charleston
- 2024 margin
- Lean D (+5.7) · D 51.9% · R 46.3% · Other 1.8%
- 2008→2024 swing
- -2.7pp toward R · 2008: 8.3pp · 2024: 5.7pp
- All cycles
- 2024: D+5.7 2020: D+12.9 2016: D+7.9 2012: D+2.4 2008: D+8.3
Not yet ingested
- Civics
- —
Market trends
- HPI YoY
- ▼ -27.09%
- Current HPI
- 374.9164
- Rent YoY
- ▲ 1.37%
- Metro
- Charleston-North Charleston, SC
- State GDP YoY
- ▲ 4.51%
- F500 in state
- 2
Industry mix (Fortune 500 HQ in SC)
| Industry | F500 HQs | Revenue |
|---|---|---|
| Packaging | 1 | $7B |
|
||
Price history
4 events — show timeline
- 2024-09-10 Pending — Charleston Trident MLS
- 2024-09-10 Relisted — Charleston Trident MLS
- 2024-08-24 Contingent — Charleston Trident MLS
- 2024-08-01 Listed $206,000 Charleston Trident MLS
Cash-flow waterfall
monthlySold comps — $/sqft
last 12 mo · ≤1 miLoading sold comps…