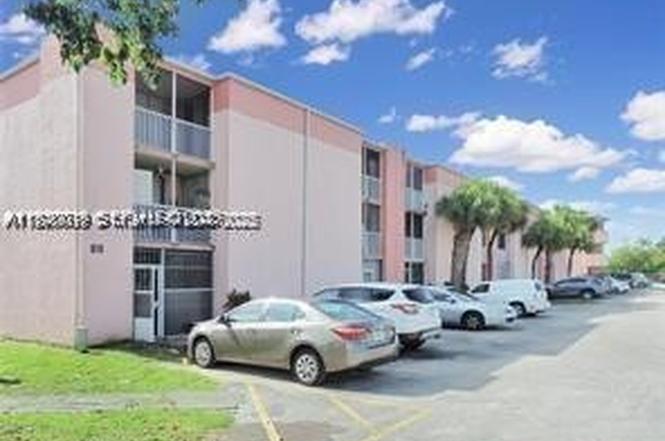
19701 SW 114th Ave Unit 269-14 · South Miami Heights, FL
Flood risk 4/10 · Minor
- FEMA flood zone
- AH
- Chance of flooding over 30 yrs
- 0.22%
- Est. flood insurance / yr
- $1,142 – $2,507
Fire risk 1/10 · Minimal
- Est. fire insurance / yr
- $947 – $1,759
Heat risk 10/10 · Severe
- Hot days now (above 105°F)
- 7 days/yr
- Hot days in 30 yrs
- 31 days/yr
Wind risk 10/10 · Severe
- Chance of severe wind over 30 yrs
- 99.0%
Air-quality risk 2/10 · Minimal
- Unhealthy air days now
- 1 days/yr
- Unhealthy air days in 30 yrs
- 1 days/yr
Risk factors via First Street. Map © Google.
Why this score? — see what drove the C grade
The composite is a weighted blend of 9 inputs, each scored 0–100. Each bar is that input's sub-score; the figure is the points it added to the 100-point composite (weight × sub-score).
- Cash flow +22.3/30.0
- 1% rule +10.0/10.0
- ARV discount +7.5/15.0
- DSCR +7.1/10.0
- Schools +4.2/10.0
- Livability +3.9/5.0
- Condition / age +2.5/5.0
- Rent growth +2.3/5.0
- Appreciation +0.0/10.0
$129,900
🖨 Deal sheet 📄 Offer letter ✓ Due diligence
Listing remarks
Spacious 2-bedroom, 2-bathroom condo for sale on the 2nd floor, featuring a private balcony and elevator access. Washer and dryer available in the building, with water included. Conveniently located near schools and restaurants, with easy access to US-1 and major highways. Situated in a secure, gated community. Currently rented to an excellent tenant—great investment opportunity.
Key facts
- Gated community
- Private balcony
- Washer and dryer
Tags
Property features AI
Finance
- Financial info: Lease considered; Pets allowed with size limit (maximum 20 lbs)
- HOA & community: Monthly association fee; Association amenities include clubhouse, laundry, elevator(s); HOA covers common areas, insurance, laundry, grounds maintenance, structure maintenance, pool(s), roof, trash, water
Exterior
- Parking: Assigned parking; Guest parking
- Security: Closed-circuit cameras; Complex fenced; Fire alarm; Smoke detectors
- Utilities: Has cooling (central air)
- Home design: Attached property; 3-story building; Entry on level 2
- Construction: Block construction; Resale property
- Exterior features: Balcony; Screened balcony/porch; Exterior lighting
Interior
- Kitchen: Electric range; Refrigerator
- Flooring: Tile flooring
- Bathrooms: 2 full bathrooms
- Heating & cooling: Central air conditioning
- Interior features: Second floor entry; Other interior features
- Laundry & utility: Common area laundry; Electric water heater
Neighborhood map
What this means for you Summary
Snapshot
- This is a 2-bed/2.0-bath condo listed at $130k.
Deal economics
- At list price, monthly cash flow is $61 ($730/yr) — positive.
- The deal already cash-flows at list — no discount required.
- Meets the 1% rule at list price ($2k rent vs $130k).
- Recommended offer: $114k (12.0% below list) — sets the bar for market timing.
- Cap rate 8.3% vs local median 3.6% in South Miami Heights — top-decile yield for the area; either an underpriced asset or a hidden risk that comps aren't pricing in. Stress-test before assuming the spread holds.
Location & tenants
- Location reads 78/100 on livability (#169 in FL, #2,539 nationally) — a middle-class / working-renter tenant base. Strengths: housing A+, health & safety A+, schools A; Watch: employment D+, amenities F.
- Miami-Dade (suburban): math 45% / reading 54% proficiency, ranked #40 of 73 in FL (top 55%) — families likely to look elsewhere, expect single-tenant / working-renter base with shorter leases; 64% free/reduced lunch — lower-income household profile, screen leases tightly.
- Market conditions: Rents soft (-0.8%/yr); 376 active listings in the ZIP; 40 comparable units currently listed for rent nearby; rentals at typical pace (median 21d on market — plan ~3-4 weeks tenant-placement turnaround); solid renter incomes; 10,051 units permitted in Miami-Dade County in 2024 (7,758 in 5+ unit buildings).
Forward outlook
- Local home prices are declining (-3.0%/yr); year-one equity from $898 of loan paydown is wiped out by about $4k of value loss. Plan a longer hold.
- Miami-Dade County population projected at +28% by 2050 — long-run rental-demand tailwind backs the buy-and-hold thesis.
Negotiation context
- It's been on market 184 days — a 12% lower offer ($114k) is reasonable based on typical stale-listing flexibility.
- 2 sale attempts; this cycle's ask has dropped $28k (18%) from the opening price — seller is motivated, your offer sets the floor, not the list.
Risks & watch-outs
- Watch-outs: flood insurance adds $152/mo; HOA is 24% of rent.
- Climate carrying-cost: in FEMA flood zone AH (mandatory federal flood insurance); severe wind risk, 99% chance of damaging wind over 30y; extreme-heat days projected 7→31/yr by 2055 (HVAC capex compounding) — expect insurance premiums to compound above CPI over the hold.
Questions for the listing agent
- It's been on market 184 days. Have you received any prior offers? Is the seller open to a 12% concession, seller financing, or rate buy-down credit?
- Built in 1974 — when were the roof, HVAC, electrical panel, plumbing, and water heater last replaced?
- What's the actual annual flood-insurance premium (NFIP or private), and is the property in a SFHA with mandatory coverage?
- What does the HOA fee cover, when was the last increase, and are there any pending special assessments or reserve-fund shortfalls?
- Any open or pending special assessments — roof, HVAC, plumbing, elevator, façade? What's the per-unit balance and payoff schedule, and is the seller paying it off at close or rolling it to the buyer?
- Why hasn't it sold? Are there any deal-killer items the seller is aware of (foundation, flood, title, zoning, code violations)?
- Is there a deadline driving the sale (1031 exchange, divorce, estate, relocation)? That informs how much negotiation room exists.
- Schools are A-rated — typically a magnet for longer-tenancy family renters. What's the average tenant stay here, and is there a school-zone premium baked into asking?
- What's the average days-on-market for RENTAL listings here right now (not sales)? A rising rental-DOM trend means longer vacancies and softer asking-rent achievability than the comps imply.
- What's the recent tenant-quality profile in this submarket — average credit score on applications, eviction rate, late-payment / NSF rate, and stable-employment percentage? A property-management company in the area should have these aggregated.
- How much new apartment / multifamily construction is in the pipeline within 1–3 miles? Heavy new supply (>2% of stock underway) typically softens rents 12–24 months out; light construction supports rent growth.
Investment metrics
- 1% rule
- 1.55% ✓
- Cap rate
- 8.26%
- Cash-on-cash
- 7.02%
- DSCR
- 1.31
- GRM
- 5.4
CMA / ARV
No comps found within radius.
Projected returns pro-forma
-3.0% appreciation · 0.0% rent growth · sell at horizon
- IRR
- -18.6%
- Equity multiple
- 0.38×
- Total profit
- $-22,665
- Equity at exit
- $19,369
- IRR
- -27.5%
- Equity multiple
- 0.01×
- Total profit
- $-35,883
- Equity at exit
- $11,231
Cash invested: $36,372 (down + closing). Projections, not guarantees.
Landlord ↔ Tenant lean methodology
- Overall (STATE)
- 87 Strongly Landlord-Friendly
- State Florida
- 87 Strongly Landlord-Friendly · R+3
- County
- — inherits STATE
- City
- — inherits STATE
ZIP-level market 33157
- Rents YoY
- -0.8%
- Active inventory
- 376
- Price-to-rent
- 5.4×
Monthly cashflow live
- Estimated rent
- $2,017 high interval (Pro) →
- Mortgage (P&I)
- −$681
- Tax est. 1.5%
- −$162 /mo · $1,948/yr
- Insurance
- −$54
- Flood insurance flood zone
- −$152 /mo · $1,824/yr
- HOA
- −$483
- Vacancy / Maint / Mgmt
- −$424
- Net cashflow
- $61
Break-even live
UW: 25.0% down · 7.5% · 30yr · 1.5% tax · 5.0% vac · 8.0% maint · 8.0% mgmt
Financing live
Cash to close
- Down payment
- $32,475
- Closing costs
- $3,897
- Reserves months
- —
- Total cash needed
- —
Loan-product check · same deal, 3 products live
Conventional
25% down · 7.5% · 30yr
- Down + closing
- —
- Monthly P&I
- —
- Monthly cashflow
- —
- DSCR
- —
- Eligible?
- —
Personal DTI + credit; lowest rate.
DSCR
20% down · 8.5% · 30yr
- Down + closing
- —
- Monthly P&I
- —
- Monthly cashflow
- —
- DSCR
- —
- Eligible?
- —
No personal income docs; deal must DSCR.
Hard money
10% down · 12.0% · 12mo
- Down + closing
- —
- Monthly P&I
- —
- Monthly cashflow
- —
- DSCR
- —
- Eligible?
- —
Short-term bridge; refi at stabilization.
Rent comps 40 comps
| Address | Beds | Baths | Sqft | Rent | $/sqft | DOM | Units | Dist |
|---|---|---|---|---|---|---|---|---|
| 19841 SW 114th Ave #310 Miami, FL | 2.0 | 2.0 | 800 | $1,750 | $2.19 | 24d | 1 | 0.08mi |
| 19729 SW 114th Ave #150 Miami, FL | 2.0 | 2.0 | 800 | $1,980 | $2.48 | 7d | 1 | 0.08mi |
| 19729 SW 114th Ave #250 Miami, FL | 2.0 | 2.0 | 800 | $1,675 | $2.09 | 11d | 1 | 0.08mi |
| 19751 SW 114th Ave #349 Miami, FL | 2.0 | 2.0 | 800 | $1,790 | $2.24 | 5d | 1 | 0.08mi |
| 19751 SW 114th Ave Miami, FL | 2.0 | 2.0 | 800 | $1,812 | $2.27 | 17d | 2 | 0.08mi |
| 19771 SW 114th Ave #328 Miami, FL | 2.0 | 2.0 | 800 | $1,900 | $2.38 | 17d | 1 | 0.08mi |
| 19791 SW 114th Ave Miami, FL | 2.0 | 2.0 | 800 | $1,700 | $2.12 | 7d | 2 | 0.08mi |
| 19729 SW 114th Ave #150 Miami, FL | 2.0 | 2.0 | 800 | $1,980 | $2.48 | 21d | 1 | 0.08mi |
| 19715 SW 114th Ave #352 Miami, FL | 2.0 | 2.0 | 800 | $1,700 | $2.12 | 24d | 1 | 0.08mi |
| 19751 SW 114th Ave Unit 347 Miami, FL | 2.0 | 2.0 | 800 | $1,875 | $2.34 | 24d | 1 | 0.08mi |
| 11307 SW 200th St Unit 106B Miami, FL | 2.0 | 2.0 | 840 | $1,900 | $2.26 | 20d | 1 | 0.14mi |
| 11309 SW 200th St Unit 103C Miami, FL | 2.0 | 2.0 | 840 | $2,100 | $2.50 | 24d | 1 | 0.15mi |
| 11301 SW 200th St Unit 108A Miami, FL | 1.0 | 1.5 | 703 | $1,449 | $2.06 | 21d | 1 | 0.16mi |
| 11301 SW 200th St Unit 104A Miami, FL | 1.0 | 1.5 | 703 | $1,600 | $2.28 | 10d | 1 | 0.16mi |
| 19800 SW 110th Ct Cutler Bay, FL | 1.0 | 1.0 | 625 | $1,572 | $2.52 | 3d | 1 | 0.34mi |
| 20221 SW 112th Ct Unit 2 Miami, FL | 1.0 | 1.0 | 607 | $1,300 | $2.14 | 24d | 1 | 0.38mi |
| 20221 SW 112th Ct Unit 2 Miami, FL | 1.0 | 1.0 | 607 | $1,300 | $2.14 | 3d | 1 | 0.38mi |
| 11040 SW 196th St #412 Cutler Bay, FL | 2.0 | 2.0 | 809 | $2,200 | $2.72 | 14d | 1 | 0.50mi |
| 11040 SW 196th St Cutler Bay, FL | 2.0 | 2.0 | 809 | $2,070 | $2.56 | 5d | 2 | 0.50mi |
| 11060 SW 196th St Cutler Bay, FL | 2.0 | 2.0 | 861 | $1,862 | $2.16 | 20d | 3 | 0.51mi |
| 11060 SW 196th St Cutler Bay, FL | 2.0 | 2.0 | 861 | $1,950 | $2.26 | 24d | 2 | 0.51mi |
| 11060 SW 196th St Cutler Bay, FL | 2.0 | 2.0 | 861 | $1,950 | $2.26 | 5d | 2 | 0.51mi |
| 11050 SW 196th St #103 Cutler Bay, FL | 2.0 | 2.0 | 809 | $1,950 | $2.41 | 21d | 1 | 0.51mi |
| 19800 SW 103rd Ct #201 Cutler Bay, FL | 2.0 | 2.0 | 921 | $2,250 | $2.44 | 1d | 1 | 0.83mi |
| 11750 SW 186th St Miami, FL | 3.0 | 1.0 | 864 | $2,400 | $2.78 | 19d | 1 | 0.89mi |
| 12235 SW 202nd St Unit 12235 Miami, FL | 3.0 | 1.0 | 1125 | $2,750 | $2.44 | 24d | 1 | 0.91mi |
| 20225 SW 106th Ave Cutler Bay, FL | 3.0 | 1.0 | 968 | $2,650 | $2.74 | 20d | 1 | 0.93mi |
| 12230 SW 203rd St Miami, FL | 3.0 | 1.0 | 1050 | $2,800 | $2.67 | 24d | 1 | 0.94mi |
| 12230 SW 203rd St Miami, FL | 3.0 | 1.0 | 1050 | $2,800 | $2.67 | 2d | 1 | 0.94mi |
| 12230 SW 203rd St Miami, FL | 3.0 | 1.0 | 1050 | $2,800 | $2.67 | 3d | 1 | 0.94mi |
| 19701 SW 103rd Ct Unit 19701 Cutler Bay, FL | 3.0 | 1.0 | 1044 | $2,600 | $2.49 | 24d | 1 | 0.94mi |
| 11930 SW 187th St Unit 1 Miami, FL | 1.0 | 1.0 | 580 | $1,400 | $2.41 | 24d | 1 | 0.96mi |
| 11840 SW 212th St Unit 11840 Miami, FL | 2.0 | 1.0 | 1104 | $1,700 | $1.54 | 24d | 1 | 1.00mi |
| 11920 SW 212th St Unit 11920 Miami, FL | 2.0 | 1.0 | 1100 | $2,200 | $2.00 | 7d | 1 | 1.06mi |
| 11611 SW 215th St Unit 11611 Miami, FL | 2.0 | 1.0 | 756 | $2,000 | $2.65 | 24d | 1 | 1.09mi |
| 19362 SW 103rd Ct Unit B Cutler Bay, FL | 3.0 | 2.0 | 974 | $2,600 | $2.67 | 4d | 1 | 1.16mi |
| 19362 SW 103rd Ct Unit B Cutler Bay, FL | 3.0 | 2.0 | 974 | $2,600 | $2.67 | 24d | 1 | 1.16mi |
| 18305 SW 110th Ave Unit 18305 (Bldg 1) -109 Miami, FL | 2.0 | 2.0 | 986 | $2,430 | $2.46 | 24d | 1 | 1.16mi |
| 10363 SW 207th Ter #10363 Cutler Bay, FL | 3.0 | 1.0 | 1015 | $2,400 | $2.36 | 24d | 1 | 1.24mi |
| 21850 Old Dixie Hwy Miami, FL | 1.0–2.0 | 1.0 | 873 | $2,399 | $2.75 | 1d | 4 | 1.43mi |
HOA detail condo
- Monthly dues
- $483 · $5,796/yr
- Likely covers
- watersecurity
- Assessments
- None detected in remarks — confirm with the listing agent.
Listing history 18 events
-
2026-06-18days on market $129,900 Active 184 DOM
-
2026-06-17days on market $129,900 Active 183 DOM
-
2026-06-16days on market $129,900 Active 182 DOM
-
2026-06-15days on market $129,900 Active 181 DOM
-
2026-06-13days on market $129,900 Active 179 DOM
-
2026-06-09days on market $129,900 Active 175 DOM
-
2026-06-08days on market $129,900 Active 174 DOM
-
2026-06-07days on market $129,900 Active 173 DOM
-
2026-06-04days on market $129,900 Active 170 DOM
-
2026-06-03days on market $129,900 Active 169 DOM
-
2026-06-02days on market $129,900 Active 168 DOM
-
2026-06-01days on market $129,900 Active 167 DOM
-
2026-05-31days on market $129,900 Active 166 DOM
-
2026-05-11status Active
-
2026-03-30historical Active Under Contract
-
2026-02-25price $129,900
-
2026-01-05price $139,900
-
2025-12-16$158,000 Active
ⓘ Source: listings_history table (triggers on properties + properties_extension) + one-shot
backfill from property_details.listing_events for pre-trigger history.
Climate risk First Street
- Flood 4/10 Moderate FEMA zone AH · 22% chance over 30 yrs
- Wildfire 1/10 Low
- Heat 10/10 Extreme 7 d/yr ≥105°F today · 31 d/yr by 30 yrs out
- Wind 10/10 Extreme 99% chance of damaging wind over 30 yrs
- Air quality 2/10 Low 1 unhealthy d/yr today · 1 by 30 yrs out
Nearby sold comps map
Loading sold comps map…
Walkable amenities ~0.75 mi
Loading nearby amenities…
Taxation est. · year 1
- Rental income
- $24,207
- − Mortgage interest
- −$7,276
- − Property taxes
- −$1,948
- − Insurance
- −$2,474
- − Repairs & maintenance
- −$1,937
- − Management
- −$1,937
- − HOA
- −$5,796
- − Depreciation
- −$3,779
- Taxable loss
- −$940
- Est. tax savings @ 24.0%
- +$226
- After-tax cash flow
- $956/yr
For passive investors: Depreciation is non-cash, so a rental often shows a tax loss while cash-flowing — sheltering income. Rental losses are passive: they offset passive income freely, and up to $25,000/yr can offset ordinary (W-2) income if you actively participate and your MAGI is under $100k (phasing out to $0 by $150k); unused losses carry forward. On sale, claimed depreciation is recaptured at up to 25%, and gains may owe capital-gains tax (a 1031 exchange can defer both). Figures are a year-1 estimate at your 24.0% rate — not tax advice; consult a CPA.
Schools (NCES district)
- District
- Miami-Dade
- NCES district ID
- 1200390
- Math proficiency
- 45% ▼ -16.00%
- Reading proficiency
- 54% ▼ -5.00%
- Median HH income
- $43,928
- Composite
- 41.76/100
- National rank
- #3397
- State rank
- #40 of 73 in FL
Livability — South Miami Heights
- Score
- 78/100
- State rank
- #169
- US rank
- #2539
Category grades
Schools grade is shown separately in the Schools card above.
Census & demographics
- Census place
- South Miami Heights, FL
- County
- Miami-Dade County · 2,697,751 people
- Metro
- Miami-Fort Lauderdale-Pompano Beach, FL
- Population (ZIP)
- 70,596
- Household income
- $81,589
- Rent vs Own
- Severe rent burden
- 2340.0
Population outlook (Miami-Dade County) Hauer SSP2
- Today (2025)
- 3,126,439 people
- By 2030
- 3,325,765 · +6.4%
- By 2040
- 3,697,561 · +18.3%
- By 2050
- 4,012,134 · +28.3%
- By 2075
- 4,605,612 · +47.3%
- By 2100
- 4,866,598 · +55.7%
Race, ethnicity, and origin ACS 2023
- Neighborhood character
- Diverse neighborhood (Simpson 0.61)
- Race & ethnicity
- Hispanic / Latino 56% Two or more races 33% Black 19% White 19% Asian 2%
- Hispanic origin (detail)
- Mexican 2% Puerto Rican 3% Cuban 30% Dominican 1%
- Common ancestry
- Hispanic 2% Lithuanian 1% Romanian 1%
- Foreign-born
- 42% · Canada, Jamaica, China
- Languages at home
- 43% English-only · Spanish 52% French/Haitian/Cajun 2% Other Indo-European 1%
Political lean MEDSL · Miami-Dade
- 2024 margin
- R (+11.4) · D 43.9% · R 55.4%
- 2008→2024 swing
- -27.6pp toward R · 2008: 16.1pp · 2024: -11.4pp
- All cycles
- 2024: R+11.4 2020: D+7.3 2016: D+29.6 2012: D+23.7 2008: D+16.1
Not yet ingested
- Civics
- —
Market trends
- HPI YoY
- ▼ -457.85%
- Current HPI
- 481.93
- Rent YoY
- ▼ -0.75%
- Metro
- Miami-Fort Lauderdale-Pompano Beach, FL
- State GDP YoY
- ▲ 3.28%
- F500 in state
- 36
Industry mix (Fortune 500 HQ in FL)
| Industry | F500 HQs | Revenue |
|---|---|---|
| Industrial Technology | 2 | $29B |
|
||
| Insurance | 2 | $17B |
|
||
| Retail | 1 | $60B |
|
||
| Technology Distribution | 1 | $58B |
|
||
| Homebuilding | 1 | $35B |
|
||
| Technology Manufacturing | 1 | $35B |
|
||
Price history
-17.8% since first listed5 events — show timeline
- 2026-05-11 Relisted — MARMLS
- 2026-03-30 Contingent — MARMLS
- 2026-02-25 Price Changed $129,900 MARMLS
- 2026-01-05 Price Changed $139,900 MARMLS
- 2025-12-16 Listed $158,000 MARMLS
Cash-flow waterfall
monthlySold comps — $/sqft
last 12 mo · ≤1 miLoading sold comps…