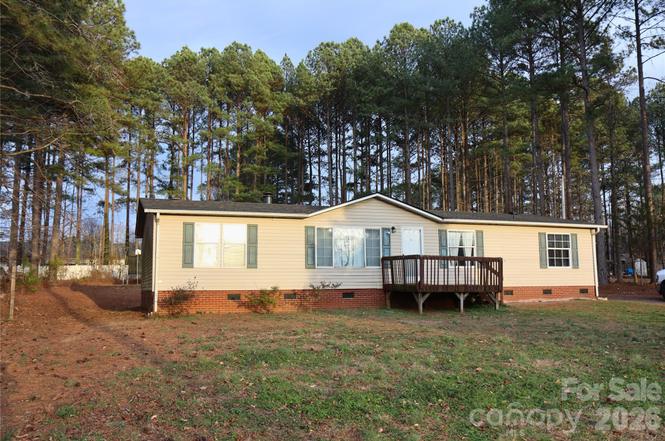
2110 Beth Haven Church Rd · Denver, NC
Flood risk 1/10 · Minimal
- FEMA flood zone
- X (unshaded)
- Chance of flooding over 30 yrs
- 0.0%
- Est. flood insurance / yr
- $507 – $1,088
Fire risk 4/10 · Minor
- Est. fire insurance / yr
- $906 – $1,684
Heat risk 6/10 · Moderate
- Hot days now (above 104°F)
- 7 days/yr
- Hot days in 30 yrs
- 17 days/yr
Wind risk 4/10 · Minor
- Chance of severe wind over 30 yrs
- 8.0%
Air-quality risk 3/10 · Minor
- Unhealthy air days now
- 3 days/yr
- Unhealthy air days in 30 yrs
- 3 days/yr
Risk factors via First Street. Map © Google.
Why this score? — see what drove the C- grade
The composite is a weighted blend of 9 inputs, each scored 0–100. Each bar is that input's sub-score; the figure is the points it added to the 100-point composite (weight × sub-score).
- Cash flow +22.1/30.0
- ARV discount +7.5/15.0
- DSCR +7.1/10.0
- Schools +4.8/10.0
- 1% rule +4.7/10.0
- Livability +3.3/5.0
- Condition / age +2.5/5.0
- Rent growth +2.4/5.0
- Appreciation +0.0/10.0
$204,000
🖨 Deal sheet 📄 Offer letter ✓ Due diligence
Listing remarks
Discover the charm of modern living in this beautifully updated manufactured home nestled in a serene community that offers the perfect blend of comfort and convenience. This charming 3 bedroom 2 full bathroom home offers 1,512 sq. ft. of thoughtfully designed living space featuring a spacious open-concept living area, a well appointed kitchen with updated cabinets and a cozy dining space perfect for family and friends to gather. The owners suite has a remodeled bathroom, featuring a walk in shower and garden tub. Step outside onto your back deck where you can look out on almost an acre while enjoying the peace and fresh country air, or step out further and sit around your fire pit under th
Key facts
- 0.76 acre lot
- Built 2002
- Listed 98 days
Property features AI
Finance
- Other: Zoning: R-T
- HOA & community: No HOA
Exterior
- Parking: Driveway
- Utilities: Well water; Septic system installed
- Home design: Manufactured doublewide single-family residence; One level; Level lot; Roads are gravel and paved; publicly maintained
- Construction: Manufactured construction with vinyl exterior; Composition roof; Crawl space foundation; Built as a manufactured home
- Exterior features: Deck; Rear porch; Fire pit; Back yard fencing (fenced)
Interior
- Kitchen: Dishwasher; Disposal; Electric oven; Electric range; Microwave; Refrigerator
- Bedrooms: 3 bedrooms on the main level
- Flooring: Laminate flooring
- Bathrooms: 2 full bathrooms on the main level
- Heating & cooling: Forced air heating; Central air conditioning
- Interior features: Open floor plan with 1 total room listed; Wood-burning fireplace in the family room
- Laundry & utility: Dedicated laundry room with utility sink; Electric water heater
Neighborhood map
What this means for you Summary
Snapshot
- This is a 3-bed/2.0-bath manufactured listed at $204k.
Deal economics
- At list price, monthly cash flow is $329 ($4k/yr) — positive.
- The deal already cash-flows at list — no discount required.
- To meet the 1% rule (rent ≥ 1% of price), the offer needs to be $199k (2.5% below list).
- Recommended offer: $186k (9.0% below list) — sets the bar for market timing.
- Cap rate 8.2% vs local median 2.1% in Denver — top-decile yield for the area; either an underpriced asset or a hidden risk that comps aren't pricing in. Stress-test before assuming the spread holds.
Location & tenants
- Location reads 66/100 on livability (#255 in NC) — a middle-class / working-renter tenant base. Strengths: crime A+, cost of living A+, housing B+; Watch: employment D, amenities F, commute F.
- Lincoln County Schools (rural): math 57% / reading 55% proficiency, ranked #42 of 178 in NC (top 24%) — acceptable for families but not a draw, mixed tenant base, ~2y average lease.
- Market conditions: Rents soft (-0.3%/yr); 373 active listings in the ZIP; 1 comparable units currently listed for rent nearby; high-income renter base; 697 units permitted in Lincoln County in 2024 (0 in 5+ unit buildings).
Forward outlook
- Local home prices are declining (-3.0%/yr); year-one equity from $1k of loan paydown is wiped out by about $6k of value loss. Plan a longer hold.
- Lincoln County population projected at +8% by 2050 — modest demand growth; plan on rents tracking national, not racing it.
Negotiation context
- It's been on market 98 days — a 9% lower offer ($186k) is reasonable based on typical stale-listing flexibility.
- 4 sale attempts with the ask held roughly flat each time — persistent listings suggest the price (not the market) is what's stuck; bring a comps-based counter.
- Current owner paid $82k; list at $204k implies a 147% gain — meaningful room to come down on a strong offer.
Risks & watch-outs
- Climate carrying-cost: extreme-heat days projected 7→17/yr by 2055 (HVAC capex compounding) — expect insurance premiums to compound above CPI over the hold.
Questions for the listing agent
- It's been on market 98 days. Have you received any prior offers? Is the seller open to a 9% concession, seller financing, or rate buy-down credit?
- Why hasn't it sold? Are there any deal-killer items the seller is aware of (foundation, flood, title, zoning, code violations)?
- Is there a deadline driving the sale (1031 exchange, divorce, estate, relocation)? That informs how much negotiation room exists.
- Schools are B-rated — typically a magnet for longer-tenancy family renters. What's the average tenant stay here, and is there a school-zone premium baked into asking?
- What's the average days-on-market for RENTAL listings here right now (not sales)? A rising rental-DOM trend means longer vacancies and softer asking-rent achievability than the comps imply.
- What's the recent tenant-quality profile in this submarket — average credit score on applications, eviction rate, late-payment / NSF rate, and stable-employment percentage? A property-management company in the area should have these aggregated.
- How much new for-sale + rental construction is in the pipeline within 1–3 miles? Heavy new supply typically softens prices + rents 12–24 months out; constrained supply supports both.
Investment metrics
- 1% rule
- 0.97% ✗
- Cap rate
- 8.23%
- Cash-on-cash
- 6.92%
- DSCR
- 1.31
- GRM
- 8.5
CMA / ARV
No comps found within radius.
Projected returns pro-forma
-3.0% appreciation · 0.0% rent growth · sell at horizon
- IRR
- -8.8%
- Equity multiple
- 0.69×
- Total profit
- $-17,973
- Equity at exit
- $30,417
- IRR
- -3.4%
- Equity multiple
- 0.80×
- Total profit
- $-11,450
- Equity at exit
- $17,638
Cash invested: $57,120 (down + closing). Projections, not guarantees.
Landlord ↔ Tenant lean methodology
- Overall (STATE)
- 85 Strongly Landlord-Friendly
- State North Carolina
- 85 Strongly Landlord-Friendly · R+3
- County
- — inherits STATE
- City
- — inherits STATE
ZIP-level market 28037
- Home prices YoY
- -22.3%
- Rents YoY
- -0.3%
- Active inventory
- 373
- Price-to-rent
- 8.5×
Monthly cashflow live
- Estimated rent
- $1,989 medium interval (Pro) →
- Mortgage (P&I)
- −$1,070
- Tax from tax record
- −$87 /mo · $1,040/yr
- Insurance
- −$85
- HOA
- −$0
- Vacancy / Maint / Mgmt
- −$418
- Net cashflow
- $329
Break-even live
UW: 25.0% down · 7.5% · 30yr · 1.5% tax · 5.0% vac · 8.0% maint · 8.0% mgmt
Financing live
Cash to close
- Down payment
- $51,000
- Closing costs
- $6,120
- Reserves months
- —
- Total cash needed
- —
Loan-product check · same deal, 3 products live
Conventional
25% down · 7.5% · 30yr
- Down + closing
- —
- Monthly P&I
- —
- Monthly cashflow
- —
- DSCR
- —
- Eligible?
- —
Personal DTI + credit; lowest rate.
DSCR
20% down · 8.5% · 30yr
- Down + closing
- —
- Monthly P&I
- —
- Monthly cashflow
- —
- DSCR
- —
- Eligible?
- —
No personal income docs; deal must DSCR.
Hard money
10% down · 12.0% · 12mo
- Down + closing
- —
- Monthly P&I
- —
- Monthly cashflow
- —
- DSCR
- —
- Eligible?
- —
Short-term bridge; refi at stabilization.
Rent comps 1 comps
| Address | Beds | Baths | Sqft | Rent | $/sqft | DOM | Units | Dist |
|---|---|---|---|---|---|---|---|---|
| 2805 Sweeping Pine Ln Denver, NC | 3.0 | 2.0 | 1680 | $2,100 | $1.25 | 18d | 1 | 0.06mi |
Listing history 14 events
-
2026-06-02statusdays on market $204,000 Pending 98 DOM
-
2026-06-01days on market $204,000 Active 97 DOM
-
2026-05-31days on market $204,000 Active 96 DOM
-
2026-05-20status Active
-
2026-03-03status Active
-
2026-02-23price $205,000
-
2026-02-10price $215,000
-
2026-02-10status Active
-
2025-12-03historical Active Under Contract
-
2025-11-14$200,000 Active
-
2025-11-12historical $200,000
-
2008-07-25soldstatus $82,500
-
2002-04-10soldstatus $90,000
-
2001-11-02soldstatus $335,000
ⓘ Source: listings_history table (triggers on properties + properties_extension) + one-shot
backfill from property_details.listing_events for pre-trigger history.
Tax reassessment forecast NC · Resets to sale price
- Current annual tax
- $1,040 · $87/mo
- Projected year-2 tax
- $1,673 · $139/mo
- Expected delta
- +$633/yr (+$53/mo · 60.8%)
ⓘ Screening estimate from a state-policy table — verify with the county assessor before closing.
Climate risk First Street
- Flood 1/10 Low FEMA zone X (unshaded) · 0% chance over 30 yrs
- Wildfire 4/10 Moderate
- Heat 6/10 Major 7 d/yr ≥104°F today · 17 d/yr by 30 yrs out
- Wind 4/10 Moderate 8% chance of damaging wind over 30 yrs
- Air quality 3/10 Moderate 3 unhealthy d/yr today · 3 by 30 yrs out
Nearby sold comps map
Loading sold comps map…
Walkable amenities ~0.75 mi
Loading nearby amenities…
Taxation est. · year 1
- Rental income
- $23,863
- − Mortgage interest
- −$11,427
- − Property taxes
- −$1,040
- − Insurance
- −$1,020
- − Repairs & maintenance
- −$1,909
- − Management
- −$1,909
- − Depreciation
- −$5,935
- Taxable income
- $623
- Est. tax owed @ 24.0%
- −$149
- After-tax cash flow
- $3,804/yr
For passive investors: Depreciation is non-cash, so a rental often shows a tax loss while cash-flowing — sheltering income. Rental losses are passive: they offset passive income freely, and up to $25,000/yr can offset ordinary (W-2) income if you actively participate and your MAGI is under $100k (phasing out to $0 by $150k); unused losses carry forward. On sale, claimed depreciation is recaptured at up to 25%, and gains may owe capital-gains tax (a 1031 exchange can defer both). Figures are a year-1 estimate at your 24.0% rate — not tax advice; consult a CPA.
Schools (NCES district)
- District
- Lincoln County Schools
- NCES district ID
- 3702680
- Math proficiency
- 57% ▲ 7.00%
- Reading proficiency
- 55% ▲ 1.00%
- Median HH income
- $49,203
- Composite
- 47.7/100
- National rank
- #2242
- State rank
- #42 of 178 in NC
Livability — Denver
- Score
- 66/100
- State rank
- #255
- US rank
- #11212
Category grades
Schools grade is shown separately in the Schools card above.
Census & demographics
- County
- Lincoln County · 69,118 people
- City population
- 28,768
- Metro
- Charlotte-Concord-Gastonia, NC-SC
- Population (ZIP)
- 28,768
- Household income
- $111,703
- Rent vs Own
- Severe rent burden
- 546.0
Population outlook (Lincoln County) Hauer SSP2
- Today (2025)
- 86,972 people
- By 2030
- 89,467 · +2.9%
- By 2040
- 93,107 · +7.1%
- By 2050
- 94,304 · +8.4%
- By 2075
- 95,190 · +9.4%
- By 2100
- 90,096 · +3.6%
Race, ethnicity, and origin ACS 2023
- Neighborhood character
- Predominantly White (90%)
- Race & ethnicity
- White 90% Two or more races 6% Hispanic / Latino 4% Black 2%
- Common ancestry
- Slovak 4% Romanian 3% Iranian 3%
- Foreign-born
- 3% · Canada, Guatemala
- Languages at home
- 96% English-only · Spanish 2% German/W. Germanic 1%
Political lean MEDSL · Lincoln
- 2024 margin
- Solid R (+45.7) · D 26.8% · R 72.5%
- 2008→2024 swing
- -12.4pp toward R · 2008: -33.3pp · 2024: -45.7pp
- All cycles
- 2024: R+45.7 2020: R+45.9 2016: R+47.7 2012: R+38.9 2008: R+33.3
Not yet ingested
- Civics
- —
Market trends
- HPI YoY
- ▼ -75.60%
- Current HPI
- 263.1328
- Rent YoY
- ▼ -0.26%
- Metro
- Charlotte-Concord-Gastonia, NC-SC
- State GDP YoY
- ▲ 3.28%
- F500 in state
- 26
Industry mix (Fortune 500 HQ in NC)
| Industry | F500 HQs | Revenue |
|---|---|---|
| Financial Services | 2 | $213B |
|
||
| Retail | 2 | $95B |
|
||
| Industrial Conglomerate | 1 | $38B |
|
||
| Metals / Steel | 1 | $35B |
|
||
| Utilities | 1 | $30B |
|
||
| Industrial Machinery | 1 | $19B |
|
||
Price history
-38.8% since first listed11 events — show timeline
- 2026-05-20 Relisted — CANOPYMLS as Distributed by MLS Grid
- 2026-03-03 Relisted — CANOPYMLS as Distributed by MLS Grid
- 2026-02-23 Price Changed $205,000 CANOPYMLS as Distributed by MLS Grid
- 2026-02-10 Price Changed $215,000 CANOPYMLS as Distributed by MLS Grid
- 2026-02-10 Relisted — CANOPYMLS as Distributed by MLS Grid
- 2025-12-03 Contingent — CANOPYMLS as Distributed by MLS Grid
- 2025-11-14 Listed $200,000 CANOPYMLS as Distributed by MLS Grid
- 2025-11-12 Coming Soon $200,000 CANOPYMLS as Distributed by MLS Grid
- 2008-07-25 Sold (Public Records) $82,500 Public Records
- 2002-04-10 Sold (Public Records) $90,000 Public Records
- 2001-11-02 Sold (Public Records) $335,000 Public Records
Property tax history
+3.3%/yrLatest (2025): $1,040 · +0.3% YoY. Source: county tax records.
Cash-flow waterfall
monthlySold comps — $/sqft
last 12 mo · ≤1 miLoading sold comps…