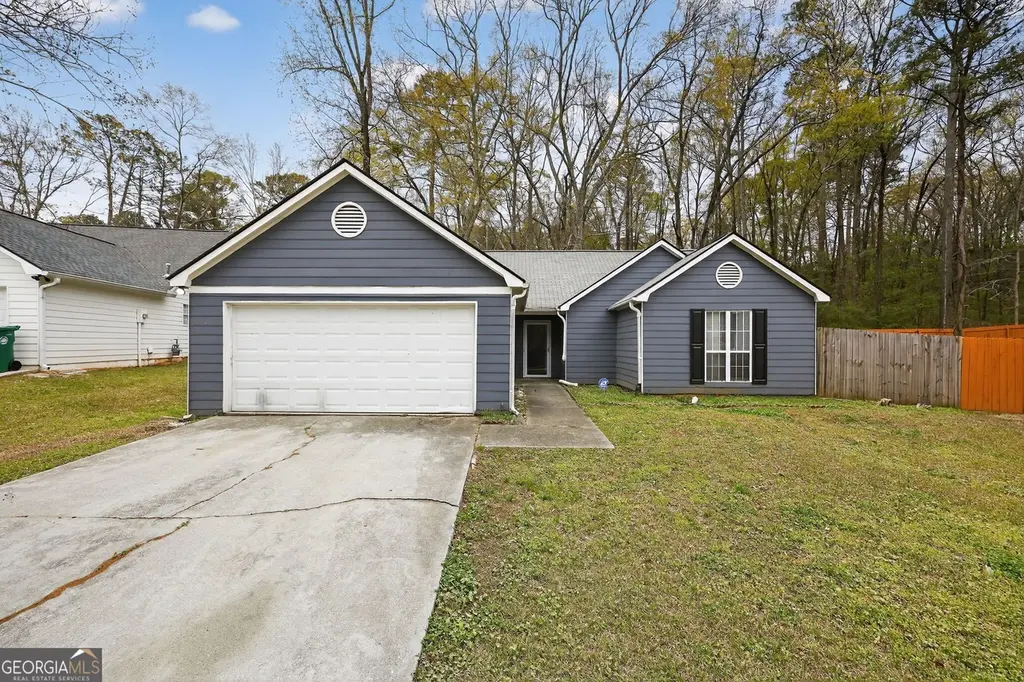
7295 Drake Ave · Stonecrest, GA
Flood risk 7/10 · Major
- FEMA flood zone
- X (unshaded)
- Chance of flooding over 30 yrs
- 0.78%
- Est. flood insurance / yr
- $507 – $1,088
Fire risk 1/10 · Minimal
- Est. fire insurance / yr
- $963 – $1,789
Heat risk 6/10 · Moderate
- Hot days now (above 105°F)
- 7 days/yr
- Hot days in 30 yrs
- 18 days/yr
Wind risk 5/10 · Moderate
- Chance of severe wind over 30 yrs
- 23.0%
Air-quality risk 5/10 · Moderate
- Unhealthy air days now
- 7 days/yr
- Unhealthy air days in 30 yrs
- 10 days/yr
Risk factors via First Street. Map © Google.
Why this score? — see what drove the D grade
The composite is a weighted blend of 9 inputs, each scored 0–100. Each bar is that input's sub-score; the figure is the points it added to the 100-point composite (weight × sub-score).
- ARV discount +14.1/15.0
- Cash flow +11.1/30.0
- 1% rule +3.9/10.0
- DSCR +3.2/10.0
- Rent growth +2.8/5.0
- Livability +2.5/5.0
- Condition / age +2.5/5.0
- Schools +2.1/10.0
- Appreciation +0.0/10.0
$224,900
🖨 Deal sheet 📄 Offer letter ✓ Due diligence
Listing remarks MLS
Beautiful 3bed, 2bath Lithonia home! Hardwood floors, updated kitchen with appliances, and spacious yard perfect for entertaining. Enjoy gas heat, central AC, and move-in ready comfort. No HOA. Top schools nearby - Rock Chapel Elementary, Lithonia Middle & High. Don't miss this gem!
Key facts
- Spacious yard
- Central ac
- Move-in ready
Tags
Neighborhood map
What this means for you Summary
Snapshot
- This is a 3-bed/2.0-bath single-family listed at $225k.
Deal economics
- At list price, monthly cash flow is $-156 ($-2k/yr) — negative.
- To cash-flow at today's rent, offer at most $197k (12.3% below list).
- To meet the 1% rule (rent ≥ 1% of price), the offer needs to be $200k (11.0% below list).
- Recommended offer: $197k (12.3% below list) — sets the bar for cash-flow.
Location & tenants
- Location reads: area grade D — affects rentability + tenant quality, not the cash-flow math above.
- Dekalb County (suburban): math 19% / reading 28% proficiency, ranked #125 of 174 in GA (top 72%) — low school quality limits family demand, transient renter base, plan for 1-2y turnover; 68% free/reduced lunch — lower-income household profile, screen leases tightly.
- Market conditions: Rents rising (+1.2%/yr); 435 active listings in the ZIP; 12 comparable units currently listed for rent nearby; rentals at typical pace (median 25d on market — plan ~3-4 weeks tenant-placement turnaround); 1,240 units permitted in DeKalb County in 2024 (385 in 5+ unit buildings).
- This rent runs 39% of the median local income ($62k/yr) — at the standard rent-burdened threshold; future hikes will face affordability resistance.
Forward outlook
- Local home prices are declining (-3.0%/yr); year-one equity from $2k of loan paydown is wiped out by about $7k of value loss. Plan a longer hold.
- DeKalb County population projected at +28% by 2050 — long-run rental-demand tailwind backs the buy-and-hold thesis.
Negotiation context
- It's been on market 79 days — a 6% lower offer ($211k) is reasonable based on typical stale-listing flexibility.
- 3 sale attempts since 13y ago with the ask held roughly flat each time — persistent listings suggest the price (not the market) is what's stuck; bring a comps-based counter.
Risks & watch-outs
- Watch-outs: flood insurance adds $66/mo.
- Climate carrying-cost: major flood risk; moderate wind risk, 23% chance of damaging wind over 30y; extreme-heat days projected 7→18/yr by 2055 (HVAC capex compounding) — expect insurance premiums to compound above CPI over the hold.
Questions for the listing agent
- What do current leases actually rent for vs. the listed asking? Can we see a recent rent roll and the last 12 months of T-12 income?
- It's been on market 79 days. Have you received any prior offers? Is the seller open to a 12% concession, seller financing, or rate buy-down credit?
- What's the actual annual flood-insurance premium (NFIP or private), and is the property in a SFHA with mandatory coverage?
- What does the HOA fee cover, when was the last increase, and are there any pending special assessments or reserve-fund shortfalls?
- Why hasn't it sold? Are there any deal-killer items the seller is aware of (foundation, flood, title, zoning, code violations)?
- Is there a deadline driving the sale (1031 exchange, divorce, estate, relocation)? That informs how much negotiation room exists.
- The area grade is low — what's the realistic commute time and amenity access for the typical tenant pool here? Any planned neighborhood developments (good or bad) we should know about?
- What's the average days-on-market for RENTAL listings here right now (not sales)? A rising rental-DOM trend means longer vacancies and softer asking-rent achievability than the comps imply.
- What's the recent tenant-quality profile in this submarket — average credit score on applications, eviction rate, late-payment / NSF rate, and stable-employment percentage? A property-management company in the area should have these aggregated.
- How much new for-sale + rental construction is in the pipeline within 1–3 miles? Heavy new supply typically softens prices + rents 12–24 months out; constrained supply supports both.
Investment metrics
- 1% rule
- 0.89% ✗
- Cap rate
- 5.81%
- Cash-on-cash
- -1.71%
- DSCR
- 0.92
- GRM
- 9.4
CMA / ARV
- ARV (median comp)
- $263,694
- List price
- $224,900
- Delta
- -14.71%
- Verdict
- UNDERPRICED
- Comps
- 20 within 1.0 mi
Show comp detail 12 sales within ~0.75 mi
| Address | Dist | Beds/Ba | Sqft | Sold | Price | $/sf | Match |
|---|---|---|---|---|---|---|---|
| 7185 Pinnacle Way | 0.58mi | 3/2.0 | 1,344 (-1%) | 3mo | $227,000 | $169 | 69 |
| 781 Hyde Ct | 0.18mi | 3/2.0 | 1,505 (+11%) | 7mo | $240,000 | $159 | 68 |
| 692 Shore Overlook | 0.63mi | 3/2.0 | 1,335 (-2%) | 3mo | $190,000 | $142 | 65 |
| 660 Kilkenny Cir | 0.25mi | 3/2.5 | 1,523 (+12%) | 4mo | $228,000 | $150 | 63 |
| 854 Asbury Trl | 0.42mi | 3/2.0 | 1,480 (+9%) | 5mo | $250,000 | $169 | 62 |
| 731 Stonebridge Park Cir | 0.52mi | 3/2.0 | 1,448 (+6%) | 6mo | $260,000 | $180 | 60 |
| 754 Shore Dr | 0.71mi | 3/2.0 | 1,396 (+3%) | 5mo | $205,000 | $147 | 58 |
| 7508 Asbury Manor Dr | 0.56mi | 3/2.0 | 1,512 (+11%) | 2mo | $244,977 | $162 | 53 |
| 7518 Edenberry Way | 0.51mi | 3/2.0 | 1,194 (-12%) | 9mo | $199,000 | $167 | 48 |
| 751 Stonebridge Park Cir | 0.53mi | 3/2.5 | 1,560 (+15%) | 1mo | $239,600 | $154 | 48 |
| 734 Stonebridge Park Cir | 0.54mi | 4/2.5 (+1) | 1,536 (+13%) | 5mo | $295,000 | $192 | 42 |
| 865 Stonebridge Park Cir | 0.73mi | 3/2.5 | 1,554 (+14%) | 1mo | $268,335 | $173 | 39 |
Match score weights: distance 35% · size 25% · config 20% · recency 20%. Top-matched comps best support the ARV.
Projected returns pro-forma
-3.0% appreciation · 1.18% rent growth · sell at horizon
- IRR
- -23.5%
- Equity multiple
- 0.21×
- Total profit
- $-49,853
- Equity at exit
- $33,533
- IRR
- -24.8%
- Equity multiple
- -0.11×
- Total profit
- $-69,887
- Equity at exit
- $19,445
Cash invested: $62,972 (down + closing). Projections, not guarantees.
Landlord ↔ Tenant lean methodology
- Overall (STATE)
- 90 Strongly Landlord-Friendly
- State Georgia
- 90 Strongly Landlord-Friendly · R+3
- County
- — inherits STATE
- City
- — inherits STATE
ZIP-level market 30058
- Home prices YoY
- -21.4%
- Rents YoY
- 1.2%
- Active inventory
- 435
- Price-to-rent
- 9.4×
Monthly cashflow live
- Estimated rent
- $2,001 high interval (Pro) →
- Mortgage (P&I)
- −$1,179
- Tax from tax record
- −$385 /mo · $4,618/yr
- Insurance
- −$94
- Flood insurance flood zone
- −$66 /mo · $798/yr
- HOA
- −$13
- Vacancy / Maint / Mgmt
- −$420
- Net cashflow
- $-156
Break-even live
UW: 25.0% down · 7.5% · 30yr · 1.5% tax · 5.0% vac · 8.0% maint · 8.0% mgmt
Financing live
Cash to close
- Down payment
- $56,225
- Closing costs
- $6,747
- Reserves months
- —
- Total cash needed
- —
Loan-product check · same deal, 3 products live
Conventional
25% down · 7.5% · 30yr
- Down + closing
- —
- Monthly P&I
- —
- Monthly cashflow
- —
- DSCR
- —
- Eligible?
- —
Personal DTI + credit; lowest rate.
DSCR
20% down · 8.5% · 30yr
- Down + closing
- —
- Monthly P&I
- —
- Monthly cashflow
- —
- DSCR
- —
- Eligible?
- —
No personal income docs; deal must DSCR.
Hard money
10% down · 12.0% · 12mo
- Down + closing
- —
- Monthly P&I
- —
- Monthly cashflow
- —
- DSCR
- —
- Eligible?
- —
Short-term bridge; refi at stabilization.
Rent comps 12 comps
| Address | Beds | Baths | Sqft | Rent | $/sqft | DOM | Units | Dist |
|---|---|---|---|---|---|---|---|---|
| 493 Stonemill Mnr Lithonia, GA | 3.0 | 2.5 | 1646 | $1,945 | $1.18 | 44d | 1 | 0.21mi |
| 493 Stonemill Mnr Lithonia, GA | 4.0 | 2.0 | 1646 | $2,055 | $1.25 | 24d | 1 | 0.21mi |
| 842 Asbury Trl Lithonia, GA | 3.0 | 2.0 | 1578 | $1,829 | $1.16 | 5d | 1 | 0.38mi |
| 738 Stonebridge Way Lithonia, GA | 3.0 | 2.0 | 1352 | $1,880 | $1.39 | 24d | 1 | 0.66mi |
| 883 Timbervale Ln Lithonia, GA | 3.0 | 2.5 | 1848 | $2,075 | $1.12 | 5d | 1 | 0.96mi |
| 888 Timbercrest Ct Lithonia, GA | 4.0 | 2.0 | 1632 | $1,850 | $1.13 | 44d | 1 | 1.01mi |
| 6936 Deshon Ridge Dr Lithonia, GA | 3.0 | 2.5 | 1872 | $1,781 | $0.95 | 5d | 1 | 1.02mi |
| 712 Pembelton Ct Lithonia, GA | 3.0 | 2.0 | 1200 | $1,665 | $1.39 | 44d | 1 | 1.13mi |
| 5088 Phillip Ct Stone Mountain, GA | 3.0 | 2.0 | 1624 | $1,845 | $1.14 | 15d | 1 | 1.40mi |
| 1370 Rogers Trce Lithonia, GA | 3.0 | 2.5 | 1564 | $1,725 | $1.10 | 13d | 1 | 1.46mi |
| 6683 Shapiro Ct Stone Mountain, GA | 3.0 | 2.5 | 1672 | $2,255 | $1.35 | 44d | 1 | 1.47mi |
| 5162 Manitou Way Stone Mountain, GA | 3.0 | 2.0 | 1728 | $1,530 | $0.89 | 15d | 1 | 1.48mi |
HOA detail
- Monthly dues
- $13 · $156/yr
- Likely covers
- gas
Listing history 27 events
-
2026-06-18days on market $224,900 Active 79 DOM
-
2026-06-17days on market $224,900 Active 78 DOM
-
2026-06-16days on market $224,900 Active 77 DOM
-
2026-06-15days on market $224,900 Active 76 DOM
-
2026-06-13days on market $224,900 Active 74 DOM
-
2026-06-09days on market $224,900 Active 70 DOM
-
2026-06-08days on market $224,900 Active 69 DOM
-
2026-06-07days on market $224,900 Active 68 DOM
-
2026-06-04days on market $224,900 Active 65 DOM
-
2026-06-03days on market $224,900 Active 64 DOM
-
2026-06-02days on market $224,900 Active 63 DOM
-
2026-06-01days on market $224,900 Active 62 DOM
-
2026-05-31days on market $224,900 Active 61 DOM
-
2026-04-24price $224,900 287-char remark
Show marketing remark (287 chars)
Beautiful 3bed, 2bath Lithonia home! Hardwood floors, updated kitchen with appliances, and spacious yard perfect for entertaining. Enjoy gas heat, central AC, and move-in ready comfort. No HOA. Top schools nearby - Rock Chapel Elementary, Lithonia Middle & High. Don't miss this gem!
-
2026-03-31$229,900 New 287-char remark
Show marketing remark (287 chars)
Beautiful 3bed, 2bath Lithonia home! Hardwood floors, updated kitchen with appliances, and spacious yard perfect for entertaining. Enjoy gas heat, central AC, and move-in ready comfort. No HOA. Top schools nearby - Rock Chapel Elementary, Lithonia Middle & High. Don't miss this gem!
-
2022-02-24soldstatus $4,479,001
-
2017-07-24soldstatus $754,800
-
2017-01-01historical
-
2016-10-20price $80,300
-
2016-10-10price $100,000
-
2016-09-06$105,600 New
-
2014-05-01historical
-
2013-12-07price $88,461 Increased
-
2013-10-29$80,419 New
-
2013-01-03soldstatus $45,300
-
2004-06-18soldstatus $128,600
-
1995-07-06soldstatus $78,000
ⓘ Source: listings_history table (triggers on properties + properties_extension) + one-shot
backfill from property_details.listing_events for pre-trigger history.
Tax reassessment forecast GA · Resets to sale price
- Current annual tax
- $4,618 · $385/mo
- Projected year-2 tax
- $4,618 · $385/mo
- Expected delta
- $0/yr ($0/mo · 0.0%)
ⓘ Screening estimate from a state-policy table — verify with the county assessor before closing.
Climate risk First Street
- Flood 7/10 Severe FEMA zone X (unshaded) · 78% chance over 30 yrs
- Wildfire 1/10 Low
- Heat 6/10 Major 7 d/yr ≥105°F today · 18 d/yr by 30 yrs out
- Wind 5/10 Major 23% chance of damaging wind over 30 yrs
- Air quality 5/10 Major 7 unhealthy d/yr today · 10 by 30 yrs out
Nearby sold comps map
Loading sold comps map…
Walkable amenities ~0.75 mi
Loading nearby amenities…
Taxation est. · year 1
- Rental income
- $24,017
- − Mortgage interest
- −$12,598
- − Property taxes
- −$4,618
- − Insurance
- −$1,922
- − Repairs & maintenance
- −$1,921
- − Management
- −$1,921
- − HOA
- −$156
- − Depreciation
- −$6,543
- Taxable loss
- −$5,662
- Est. tax savings @ 24.0%
- +$1,359
- After-tax cash flow
- $-516/yr
For passive investors: Depreciation is non-cash, so a rental often shows a tax loss while cash-flowing — sheltering income. Rental losses are passive: they offset passive income freely, and up to $25,000/yr can offset ordinary (W-2) income if you actively participate and your MAGI is under $100k (phasing out to $0 by $150k); unused losses carry forward. On sale, claimed depreciation is recaptured at up to 25%, and gains may owe capital-gains tax (a 1031 exchange can defer both). Figures are a year-1 estimate at your 24.0% rate — not tax advice; consult a CPA.
Schools (NCES district)
- District
- Dekalb County
- NCES district ID
- 1301740
- Math proficiency
- 19% ▼ -12.00%
- Reading proficiency
- 28% ▼ -7.00%
- Median HH income
- $51,448
- Composite
- 20.92/100
- National rank
- #8482
- State rank
- #125 of 174 in GA
Livability — Stonecrest
No livability data for this city. (Only ~50 U.S. cities are tracked.)
Census & demographics
- County
- Dekalb County · 782,738 people
- City population
- 106,165
- Metro
- Atlanta-Sandy Springs-Alpharetta, GA
- Population (ZIP)
- 62,614
- Household income
- $61,684
- Rent vs Own
- Severe rent burden
- 3471.0
Population outlook (DeKalb County) Hauer SSP2
- Today (2025)
- 839,977 people
- By 2030
- 891,768 · +6.2%
- By 2040
- 988,894 · +17.7%
- By 2050
- 1,074,583 · +27.9%
- By 2075
- 1,245,026 · +48.2%
- By 2100
- 1,303,135 · +55.1%
Race, ethnicity, and origin ACS 2023
- Neighborhood character
- Predominantly Black (91%)
- Race & ethnicity
- Black 91% Hispanic / Latino 3% White 3% Two or more races 3%
- Common ancestry
- Hispanic 0%
- Foreign-born
- 12% · Canada, United Kingdom
- Languages at home
- 93% English-only · Spanish 2% French/Haitian/Cajun 1%
Political lean MEDSL · DeKalb
- 2024 margin
- Solid D (+64.8) · D 81.9% · R 17.1% · Other 1.0%
- 2008→2024 swing
- +6.1pp toward D · 2008: 58.6pp · 2024: 64.8pp
- All cycles
- 2024: D+64.8 2020: D+67.4 2016: D+64.8 2012: D+56.8 2008: D+58.6
Not yet ingested
- Civics
- —
Market trends
- HPI YoY
- ▼ -60.90%
- Current HPI
- 224.0366
- Rent YoY
- ▲ 1.18%
- Metro
- Atlanta-Sandy Springs-Alpharetta, GA
- State GDP YoY
- ▲ 2.66%
- F500 in state
- 28
Industry mix (Fortune 500 HQ in GA)
| Industry | F500 HQs | Revenue |
|---|---|---|
| Paper / Packaging | 2 | $29B |
|
||
| Retail | 1 | $160B |
|
||
| Transportation / Logistics | 1 | $91B |
|
||
| Airlines | 1 | $62B |
|
||
| Consumer Goods | 1 | $47B |
|
||
| Utilities | 1 | $25B |
|
||
Price history
+188.3% since first listed14 events — show timeline
- 2026-04-24 Price Changed $224,900 GAMLS
- 2026-03-31 Listed $229,900 GAMLS
- 2022-02-24 Sold (Public Records) $4,479,001 Public Records
- 2017-07-24 Sold (Public Records) $754,800 Public Records
- 2017-01-01 Listing Removed — GAMLS
- 2016-10-20 Price Changed $80,300 GAMLS
- 2016-10-10 Price Changed $100,000 GAMLS
- 2016-09-06 Listed $105,600 GAMLS
- 2014-05-01 Listing Removed — GAMLS
- 2013-12-07 Price Changed $88,461 GAMLS
- 2013-10-29 Listed $80,419 GAMLS
- 2013-01-03 Sold (Public Records) $45,300 Public Records
- 2004-06-18 Sold (Public Records) $128,600 Public Records
- 1995-07-06 Sold (Public Records) $78,000 Public Records
Property tax history
+4.6%/yrLatest (2025): $4,618 · +30.1% YoY. Source: county tax records.
Cash-flow waterfall
monthlySold comps — $/sqft
last 12 mo · ≤1 miLoading sold comps…