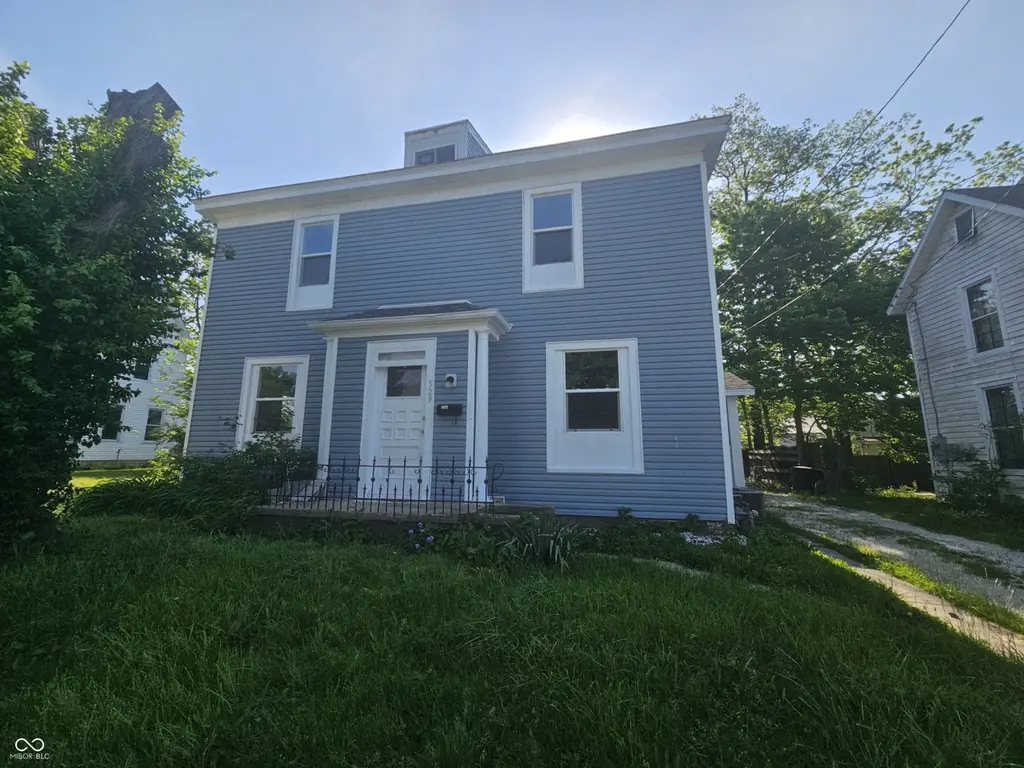
529 N Wabash St · Wabash, IN
Flood risk 1/10 · Minimal
- FEMA flood zone
- X (unshaded)
- Chance of flooding over 30 yrs
- 0.0%
- Est. flood insurance / yr
- $473 – $860
Fire risk 1/10 · Minimal
- Est. fire insurance / yr
- $717 – $1,331
Heat risk 3/10 · Minor
- Hot days now (above 101°F)
- 7 days/yr
- Hot days in 30 yrs
- 17 days/yr
Wind risk 2/10 · Minimal
- Chance of severe wind over 30 yrs
- —
Air-quality risk 2/10 · Minimal
- Unhealthy air days now
- 1 days/yr
- Unhealthy air days in 30 yrs
- 2 days/yr
Risk factors via First Street. Map © Google.
Why this score? — see what drove the D+ grade
The composite is a weighted blend of 9 inputs, each scored 0–100. Each bar is that input's sub-score; the figure is the points it added to the 100-point composite (weight × sub-score).
- ARV discount +15.0/15.0
- Cash flow +13.1/30.0
- DSCR +3.9/10.0
- Livability +3.8/5.0
- 1% rule +3.1/10.0
- Rent growth +2.5/5.0
- Schools +2.5/10.0
- Condition / age +2.5/5.0
- Appreciation +0.0/10.0
$129,000
🖨 Deal sheet (PDF) 📄 Offer letter ✓ Due diligence
Listing remarks
Welcome to 529 N Wabash St, a beautifully proportioned 4-bedroom, 2-bathroom home that perfectly blends character with classic comfort. Featuring a generous layout with over 2,400 square feet of living space, this property offers plenty of room for a growing household or anyone looking for space to spread out. Stepping inside, you are greeted by an inviting living area showcasing a mix of cozy flooring and great natural light. The functional floor plan includes one convenient bedroom on the main level and three additional bedrooms upstairs, providing an ideal layout for privacy or a dedicated home office space. Outside, the manageable lot features a fenced yard, perfect for pets, play, or w
Key facts
- Inviting living area
- Fenced yard
- Local schools
Tags
Property features AI
Finance
- Other: Lot size about 0.12 acre (< 1/4 acre); Residential property
Exterior
- Security: Smoke detectors
- Utilities: Public water; Municipal sewer connected
- Home design: Single-family residence; Two levels
- Construction: Wood siding; Block foundation
- Exterior features: Storage shed
Interior
- Kitchen: Refrigerator; Range hood
- Bedrooms: Four bedrooms total — three on the upper level and one on the main level
- Flooring: Hardwood floors
- Bathrooms: Two full bathrooms — one on the upper level and one on the main level
- Heating & cooling: Electric heating; Central air conditioning
- Interior features: Attic access; Hardwood floors; Finished basement
- Laundry & utility: Main-level laundry room
Neighborhood map
What this means for you Summary
Snapshot
- This is a 3-bed/2.0-bath single-family listed at $129k.
Deal economics
- At list price, monthly cash flow is $-5 ($-55/yr) — negative.
- To cash-flow at today's rent, offer at most $128k (0.6% below list).
- To meet the 1% rule (rent ≥ 1% of price), the offer needs to be $104k (19.1% below list).
- Recommended offer: $104k (19.1% below list) — sets the bar for 1% rule.
- Cap rate 6.3% vs local median 4.0% in Wabash — top-decile yield for the area; either an underpriced asset or a hidden risk that comps aren't pricing in. Stress-test before assuming the spread holds.
Location & tenants
- Location reads 76/100 on livability (#48 in IN, #3,353 nationally) — a middle-class / working-renter tenant base. Strengths: cost of living A+, housing A+, health & safety A+; Watch: employment D, commute F.
- Wabash City Schools (town): math 21% / reading 38% proficiency, ranked #249 of 301 in IN (top 83%) — low school quality limits family demand, transient renter base, plan for 1-2y turnover.
- Zoned schools: O J Neighbours Elementary School (math 24% / reading 25%, grade F, #762 of 994 statewide, top 78%, 391 students, 57% FRL); Wabash Middle School (math 18% / reading 43%, grade F, #203 of 330 statewide, top 63%, 443 students, 60% FRL); Wabash High School (math 27% / reading 42%, grade F, #270 of 369 statewide, top 77%, 478 students, 53% FRL).
- Market conditions: 37 active listings in the ZIP; 42 units permitted in Wabash County in 2024 (0 in 5+ unit buildings).
Forward outlook
- Local home prices are declining (-3.0%/yr); year-one equity from $892 of loan paydown is wiped out by about $4k of value loss. Plan a longer hold.
- Wabash County population projected at -16% by 2050 — secular population decline; favor cash flow + early exit over multi-decade hold.
Negotiation context
- Only 2 days on market — expect competitive offers; lowballing is unlikely to land.
- 5 sale attempts since 2y ago with the ask held roughly flat each time — persistent listings suggest the price (not the market) is what's stuck; bring a comps-based counter.
Questions for the listing agent
- What do current leases actually rent for vs. the listed asking? Can we see a recent rent roll and the last 12 months of T-12 income?
- Built in 1965 — when were the roof, HVAC, electrical panel, plumbing, and water heater last replaced?
- Is there a deadline driving the sale (1031 exchange, divorce, estate, relocation)? That informs how much negotiation room exists.
- Schools are D-rated, which usually means shorter tenancies and higher turnover. Who's the typical renter profile here, and what's been the actual vacancy rate?
- The area grade is low — what's the realistic commute time and amenity access for the typical tenant pool here? Any planned neighborhood developments (good or bad) we should know about?
- What's the average days-on-market for RENTAL listings here right now (not sales)? A rising rental-DOM trend means longer vacancies and softer asking-rent achievability than the comps imply.
- What's the recent tenant-quality profile in this submarket — average credit score on applications, eviction rate, late-payment / NSF rate, and stable-employment percentage? A property-management company in the area should have these aggregated.
- How much new for-sale + rental construction is in the pipeline within 1–3 miles? Heavy new supply typically softens prices + rents 12–24 months out; constrained supply supports both.
Investment metrics
- 1% rule
- 0.81% ✗
- Cap rate
- 6.25%
- Cash-on-cash
- -0.15%
- DSCR
- 0.99
- GRM
- 10.3
CMA / ARV
- ARV (on-the-fly)
- $199,746
- Comps found
- 12
Show comp detail 12 sales within ~0.75 mi
| Address | Dist | Beds/Ba | Sqft | Sold | Price | $/sf | Match |
|---|---|---|---|---|---|---|---|
| 425 N Huntington St | 0.15mi | 4/2.0 (+1) | 2,220 (-10%) | 6mo | $18,000 | $8 | 67 |
| 143 Stitt St | 0.27mi | 4/1.5 (+1) | 2,406 (-2%) | 17mo | $35,000 | $15 | 62 |
| 370 N Wabash St | 0.20mi | 3/3.5 | 2,336 (-5%) | 18mo | $262,000 | $112 | 61 |
| 42 E Sinclair St | 0.37mi | 4/2.0 (+1) | 2,528 (+2%) | 16mo | $145,000 | $57 | 60 |
| 147 Grant St | 0.66mi | 4/2.0 (+1) | 2,464 (-0%) | 9mo | $174,900 | $71 | 56 |
| 432 Ferry St | 0.49mi | 4/2.5 (+1) | 2,280 (-8%) | 3mo | $179,000 | $79 | 55 |
| 447 Stitt Street St | 0.48mi | 3/1.0 | 2,210 (-10%) | 2mo | $145,000 | $66 | 55 |
| 459 E Hill St | 0.58mi | 3/1.5 | 2,213 (-10%) | 3mo | $277,000 | $125 | 52 |
| 11 Elmwood Dr | 0.25mi | 3/2.5 | 2,170 (-12%) | 19mo | $266,500 | $123 | 50 |
| 528 Congress St | 0.40mi | 4/2.0 (+1) | 2,186 (-11%) | 9mo | $183,000 | $84 | 50 |
| 48 Pawling St | 0.15mi | 3/1.0 | 2,832 (+15%) | 21mo | $229,900 | $81 | 47 |
| 1460 Inez St | 0.63mi | 3/4.0 | 2,802 (+14%) | 20mo | $480,000 | $171 | 23 |
Match score weights: distance 35% · size 25% · config 20% · recency 20%. Top-matched comps best support the ARV.
Projected returns pro-forma
-3.0% appreciation · 3.0% rent growth · sell at horizon
- IRR
- -16.6%
- Equity multiple
- 0.41×
- Total profit
- $-21,219
- Equity at exit
- $19,234
- IRR
- -8.4%
- Equity multiple
- 0.48×
- Total profit
- $-18,945
- Equity at exit
- $11,154
Cash invested: $36,120 (down + closing). Projections, not guarantees.
Landlord ↔ Tenant lean methodology
- Overall (STATE)
- 90 Strongly Landlord-Friendly
- State Indiana
- 90 Strongly Landlord-Friendly · R+11
- County
- — inherits STATE
- City
- — inherits STATE
ZIP-level market 46992
- Home prices YoY
- -21.3%
- Active inventory
- 37
- Price-to-rent
- 10.3×
Monthly cashflow live
- Estimated rent
- $1,044 medium interval (Pro) →
- Mortgage (P&I)
- −$676
- Tax from tax record
- −$99 /mo · $1,189/yr
- Insurance
- −$54
- HOA
- −$0
- Vacancy / Maint / Mgmt
- −$219
- Net cashflow
- $-5
Break-even live
Sensitivity live
| Price | -10% $68 | -5% $32 | +0% $-5 | +5% $-41 | +10% $-78 |
|---|---|---|---|---|---|
| Rent | -10% $-87 | -5% $-46 | +0% $-5 | +5% $37 | +10% $78 |
| Rate | -1.0pp $60 | -0.5pp $28 | base $-5 | +0.5pp $-38 | +1.0pp $-72 |
UW: 25.0% down · 7.5% · 30yr · 1.5% tax · 5.0% vac · 8.0% maint · 8.0% mgmt
Financing live
Cash to close
- Down payment
- $32,250
- Closing costs
- $3,870
- Reserves months
- —
- Total cash needed
- —
Loan-product check · same deal, 3 products live
Conventional
25% down · 7.5% · 30yr
- Down + closing
- —
- Monthly P&I
- —
- Monthly cashflow
- —
- DSCR
- —
- Eligible?
- —
Personal DTI + credit; lowest rate.
DSCR
20% down · 8.5% · 30yr
- Down + closing
- —
- Monthly P&I
- —
- Monthly cashflow
- —
- DSCR
- —
- Eligible?
- —
No personal income docs; deal must DSCR.
Hard money
10% down · 12.0% · 12mo
- Down + closing
- —
- Monthly P&I
- —
- Monthly cashflow
- —
- DSCR
- —
- Eligible?
- —
Short-term bridge; refi at stabilization.
Listing history 10 events
-
2026-05-20$129,000 Active
-
2025-08-12historical
-
2025-05-16$139,000 Active
-
2024-11-21historical
-
2024-11-01historical $1,300
-
2024-10-14price $146,000
-
2024-10-02$1,300
-
2024-09-03$147,000 Active
-
2024-08-27historical
-
2024-07-20$147,500 Active
ⓘ Source: listings_history table (triggers on properties + properties_extension) + one-shot
backfill from property_details.listing_events for pre-trigger history.
Tax reassessment forecast IN · Partial reset (capped growth)
- Current annual tax
- $1,189 · $99/mo
- Projected year-2 tax
- $1,189 · $99/mo
- Expected delta
- $0/yr ($0/mo · 0.0%)
ⓘ Screening estimate from a state-policy table — verify with the county assessor before closing.
Climate risk First Street
- Flood 1/10 Low FEMA zone X (unshaded) · 0% chance over 30 yrs
- Wildfire 1/10 Low
- Heat 3/10 Moderate 7 d/yr ≥101°F today · 17 d/yr by 30 yrs out
- Wind 2/10 Low
- Air quality 2/10 Low 1 unhealthy d/yr today · 2 by 30 yrs out
Nearby sold comps map
Loading sold comps map…
Walkable amenities ~0.75 mi
Loading nearby amenities…
Taxation est. · year 1
- Rental income
- $12,528
- − Mortgage interest
- −$7,226
- − Property taxes
- −$1,189
- − Insurance
- −$645
- − Repairs & maintenance
- −$1,002
- − Management
- −$1,002
- − Depreciation
- −$3,753
- Taxable loss
- −$2,290
- Est. tax savings @ 24.0%
- +$550
- After-tax cash flow
- $494/yr
For passive investors: Depreciation is non-cash, so a rental often shows a tax loss while cash-flowing — sheltering income. Rental losses are passive: they offset passive income freely, and up to $25,000/yr can offset ordinary (W-2) income if you actively participate and your MAGI is under $100k (phasing out to $0 by $150k); unused losses carry forward. On sale, claimed depreciation is recaptured at up to 25%, and gains may owe capital-gains tax (a 1031 exchange can defer both). Figures are a year-1 estimate at your 24.0% rate — not tax advice; consult a CPA.
Schools (NCES district)
- District
- Wabash City Schools
- NCES district ID
- 1812150
- Math proficiency
- 21% ▼ -10.00%
- Reading proficiency
- 38% ▼ -7.00%
- Median HH income
- $38,900
- Composite
- 24.66/100
- National rank
- #7622
- State rank
- #249 of 301 in IN
Livability — Wabash
- Score
- 76/100
- State rank
- #48
- US rank
- #3353
Category grades
Schools grade is shown separately in the Schools card above.
Census & demographics
- Census place
- Wabash, IN
- City population
- 16,475
- Population (ZIP)
- 16,475
Population outlook (Wabash County) Hauer SSP2
- Today (2025)
- 30,872 people
- By 2030
- 29,933 · -3.0%
- By 2040
- 27,877 · -9.7%
- By 2050
- 25,887 · -16.1%
- By 2075
- 22,404 · -27.4%
- By 2100
- 19,461 · -37.0%
Race, ethnicity, and origin ACS 2023
- Neighborhood character
- Predominantly White (93%)
- Race & ethnicity
- White 93% Hispanic / Latino 4% Two or more races 3%
- Common ancestry
- Lithuanian 2% Italian 1% Iranian 1%
- Foreign-born
- 1% · Canada
- Languages at home
- 98% English-only · Spanish 1%
Political lean MEDSL · Wabash
- 2024 margin
- Solid R (+50.8) · D 23.9% · R 74.7% · Other 1.4%
- 2008→2024 swing
- -30.7pp toward R · 2008: -20.1pp · 2024: -50.8pp
- All cycles
- 2024: R+50.8 2020: R+49.9 2016: R+50.7 2012: R+36.2 2008: R+20.1
Not yet ingested
- Civics
- —
Market trends
- HPI YoY
- ▼ -59.46%
- Current HPI
- 220.0458
- Rent YoY
- —
- Metro
- —
- State GDP YoY
- ▲ 2.90%
- F500 in state
- 18
Industry mix (Fortune 500 HQ in IN)
| Industry | F500 HQs | Revenue |
|---|---|---|
| Industrial Machinery | 2 | $37B |
|
||
| Healthcare | 1 | $177B |
|
||
| Pharmaceuticals | 1 | $45B |
|
||
| Metals / Steel | 1 | $18B |
|
||
| Agriculture | 1 | $17B |
|
||
| Packaging | 1 | $12B |
|
||
Price history
-12.5% since first listed11 events — show timeline
- 2026-05-23 Pending — MIBOR as Distributed by MLS Grid
- 2026-05-20 Listed $129,000 MIBOR as Distributed by MLS Grid
- 2025-08-12 Listing Removed — MIBOR as Distributed by MLS Grid
- 2025-05-16 Listed $139,000 MIBOR as Distributed by MLS Grid
- 2024-11-21 Listing Removed — MIBOR as Distributed by MLS Grid
- 2024-11-01 Rental Removed $1,300 TURBOTENANT
- 2024-10-14 Price Changed $146,000 MIBOR as Distributed by MLS Grid
- 2024-10-02 Listed for Rent $1,300 TURBOTENANT
- 2024-09-03 Listed $147,000 MIBOR as Distributed by MLS Grid
- 2024-08-27 Listing Removed — MIBOR as Distributed by MLS Grid
- 2024-07-20 Listed $147,500 MIBOR as Distributed by MLS Grid
Property tax history
+6.4%/yrLatest (2024): $1,189 · +6.6% YoY. Source: county tax records.
Cash-flow waterfall
monthlySold comps — $/sqft
last 12 mo · ≤1 miLoading sold comps…