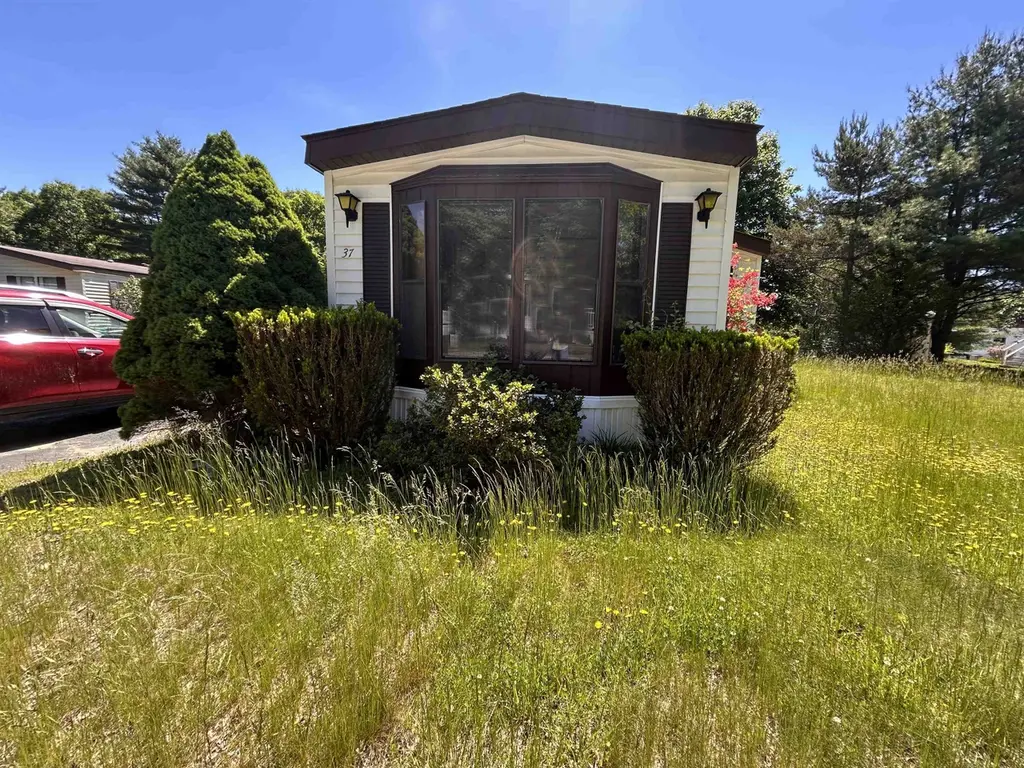
37 Monadnock Dr · Rochester, NH
Flood risk No data
- FEMA flood zone
- —
- Chance of flooding over 30 yrs
- —
- Est. flood insurance / yr
- —
Fire risk No data
- Est. fire insurance / yr
- —
Heat risk No data
- Hot days now (above threshold)
- —
- Hot days in 30 yrs
- —
Wind risk No data
- Chance of severe wind over 30 yrs
- —
Air-quality risk No data
- Unhealthy air days now
- —
- Unhealthy air days in 30 yrs
- —
Risk factors via First Street. Map © Google.
Why this score? — see what drove the C grade
The composite is a weighted blend of 9 inputs, each scored 0–100. Each bar is that input's sub-score; the figure is the points it added to the 100-point composite (weight × sub-score).
- ARV discount +15.0/15.0
- Cash flow +14.6/30.0
- 1% rule +10.0/10.0
- DSCR +4.5/10.0
- Livability +4.2/5.0
- Rent growth +3.6/5.0
- Schools +2.7/10.0
- Condition / age +2.5/5.0
- Appreciation +0.0/10.0
$99,900
🖨 Deal sheet (PDF) 📄 Offer letter ✓ Due diligence
Listing remarks
Spacious 2-bedroom, 1¾-bath home located in a Cocheco River Estates, a 55+ community. This spacious home offers open concept living space and privacy with bedrooms at opposite ends! Enter under a canopy at the front door and enjoy the enclosed porch at the back of the home. Includes a shed for storage. Park allows one small dog and one cat. This home offers the perfect canvas for your personal updates and design ideas. Property sold as-is, quick close possible!
Key facts
- Shed for storage
- Enclosed porch
- Built 1985
Tags
Property features AI
Finance
- Other: Located in a mobile home park (Cocheco River Estates); mobile make: Parkwood; serial number PBI-6258
- HOA & community: Monthly community fee of 900 covering sewer, trash, water and park rent; Association road frontage
Exterior
- Parking: Paved driveway
- Utilities: Public water; Public sewer; 100 Amp service with circuit breakers; High-speed internet available; Cable available
- Home design: Manufactured/mobile home; Existing construction; Park-approved unit
- Construction: Built in 1985; Wood frame with vinyl siding; Asphalt shingle roof
- Exterior features: Level lot; Paved driveway
Interior
- Kitchen: Electric stove; Dishwasher
- Flooring: Carpet; Vinyl
- Bathrooms: One full bathroom; One three-quarter bathroom
- Heating & cooling: Oil heat; Central air conditioning
- Interior features: Five total rooms; Carpet and vinyl flooring
- Laundry & utility: Washer; Dryer
Neighborhood map
What this means for you Summary
Snapshot
- This is a 2-bed/1.5-bath manufactured listed at $100k.
Deal economics
- At list price, monthly cash flow is $24 ($291/yr) — positive.
- The deal already cash-flows at list — no discount required.
- Meets the 1% rule at list price ($2k rent vs $100k).
- Cap rate 6.6% vs local median 3.3% in Rochester — top-decile yield for the area; either an underpriced asset or a hidden risk that comps aren't pricing in. Stress-test before assuming the spread holds.
Location & tenants
- Location reads 84/100 on livability (#8 in NH, #698 nationally) — a professional / high-income tenant draw. Strengths: crime A+, commute A+, cost of living A+; Watch: amenities C-.
- Rochester School District (suburban): math 27% / reading 35% proficiency, ranked #83 of 98 in NH (top 85%) — families likely to look elsewhere, expect single-tenant / working-renter base with shorter leases.
- Zoned schools: Chamberlain Street School (math 24% / reading 27%, grade F, #227 of 263 statewide, top 86%, 298 students, 45% FRL); Rochester Middle School (math 18% / reading 27%, grade F, #85 of 96 statewide, top 89%, 847 students, 37% FRL); Spaulding High School (math 30% / reading 49%, grade F, #63 of 90 statewide, top 74%, 1,301 students, 32% FRL) — zoned schools at 38% FRL track the district average.
- Market conditions: Rents rising fast (+4.2%/yr); 109 active listings in the ZIP; 2 comparable units currently listed for rent nearby; solid renter incomes; 951 units permitted in Strafford County in 2024 (551 in 5+ unit buildings).
- This rent runs 32% of the median local income ($79k/yr) — at the standard rent-burdened threshold; future hikes will face affordability resistance.
Forward outlook
- Local home prices are declining (-3.0%/yr); year-one equity from $691 of loan paydown is wiped out by about $3k of value loss. Plan a longer hold.
- Strafford County population projected at +7% by 2050 — modest demand growth; plan on rents tracking national, not racing it.
Negotiation context
- Only 10 days on market — expect competitive offers; lowballing is unlikely to land.
- Current owner paid $85k; 18% above their basis — modest negotiation headroom, anchor on the comps not their cost.
Risks & watch-outs
- Watch-outs: HOA is 43% of rent.
Questions for the listing agent
- What does the HOA fee cover, when was the last increase, and are there any pending special assessments or reserve-fund shortfalls?
- Is there a deadline driving the sale (1031 exchange, divorce, estate, relocation)? That informs how much negotiation room exists.
- What's the average days-on-market for RENTAL listings here right now (not sales)? A rising rental-DOM trend means longer vacancies and softer asking-rent achievability than the comps imply.
- What's the recent tenant-quality profile in this submarket — average credit score on applications, eviction rate, late-payment / NSF rate, and stable-employment percentage? A property-management company in the area should have these aggregated.
- How much new for-sale + rental construction is in the pipeline within 1–3 miles? Heavy new supply typically softens prices + rents 12–24 months out; constrained supply supports both.
Investment metrics
- 1% rule
- 2.10% ✓
- Cap rate
- 6.58%
- Cash-on-cash
- 1.04%
- DSCR
- 1.05
- GRM
- 4.0
CMA / ARV
- ARV (on-the-fly)
- $145,320
- Comps found
- 12
Show comp detail 12 sales within ~0.75 mi
| Address | Dist | Beds/Ba | Sqft | Sold | Price | $/sf | Match |
|---|---|---|---|---|---|---|---|
| 22 Cherokee Way | 0.03mi | 2/2.0 | 1,211 (0%) | 0mo | $115,000 | $95 | 96 |
| 5 Monadnock Dr | 0.19mi | 2/2.0 | 1,211 (0%) | 1mo | $108,000 | $89 | 88 |
| 32 Monadnock Dr | 0.18mi | 2/2.0 | 1,248 (+3%) | 6mo | $120,000 | $96 | 80 |
| 20 Seneca St | 0.23mi | 3/2.0 (+1) | 1,188 (-2%) | 1mo | $137,000 | $115 | 78 |
| 44 Monadnock Dr | 0.15mi | 2/2.0 | 1,211 (0%) | 17mo | $168,000 | $139 | 77 |
| 19 Shiloh Dr | 0.25mi | 3/2.0 (+1) | 1,296 (+7%) | 8mo | $150,000 | $116 | 63 |
| 49 Shiloh Dr | 0.36mi | 3/2.0 (+1) | 1,296 (+7%) | 6mo | $155,000 | $120 | 59 |
| 35 Seneca St | 0.22mi | 3/2.0 (+1) | 1,296 (+7%) | 16mo | $180,000 | $139 | 58 |
| 14 Whispering Wind Ln | 0.67mi | 2/2.0 | 1,216 (+0%) | 12mo | $166,000 | $137 | 56 |
| 74 Seneca St | 0.27mi | 3/2.0 (+1) | 1,378 (+14%) | 2mo | $144,000 | $104 | 56 |
| 23 Monadnock Dr | 0.17mi | 3/2.0 (+1) | 1,386 (+14%) | 14mo | $225,000 | $162 | 50 |
| 3 Whispering Wind Ln | 0.64mi | 3/1.0 (+1) | 1,050 (-13%) | 10mo | $149,000 | $142 | 32 |
Match score weights: distance 35% · size 25% · config 20% · recency 20%. Top-matched comps best support the ARV.
Projected returns pro-forma
-3.0% appreciation · 4.22% rent growth · sell at horizon
- IRR
- -10.9%
- Equity multiple
- 0.59×
- Total profit
- $-11,426
- Equity at exit
- $14,895
- IRR
- 2.4%
- Equity multiple
- 1.20×
- Total profit
- $5,479
- Equity at exit
- $8,638
Cash invested: $27,972 (down + closing). Projections, not guarantees.
Landlord ↔ Tenant lean methodology
- Overall (STATE)
- 56 Moderately Landlord-Leaning
- State New Hampshire
- 56 Moderately Landlord-Leaning · D+1
- County
- — inherits STATE
- City
- — inherits STATE
ZIP-level market 03867
- Home prices YoY
- -22.0%
- Rents YoY
- 4.2%
- Active inventory
- 109
- Price-to-rent
- 4.0×
Monthly cashflow live
- Estimated rent
- $2,096 medium interval (Pro) →
- Mortgage (P&I)
- −$524
- Tax from tax record
- −$166 /mo · $1,997/yr
- Insurance
- −$42
- HOA
- −$900
- Vacancy / Maint / Mgmt
- −$440
- Net cashflow
- $24
Break-even live
Sensitivity live
| Price | -10% $81 | -5% $53 | +0% $24 | +5% $-4 | +10% $-32 |
|---|---|---|---|---|---|
| Rent | -10% $-141 | -5% $-59 | +0% $24 | +5% $107 | +10% $190 |
| Rate | -1.0pp $75 | -0.5pp $50 | base $24 | +0.5pp $-2 | +1.0pp $-28 |
UW: 25.0% down · 7.5% · 30yr · 1.5% tax · 5.0% vac · 8.0% maint · 8.0% mgmt
Financing live
Cash to close
- Down payment
- $24,975
- Closing costs
- $2,997
- Reserves months
- —
- Total cash needed
- —
Loan-product check · same deal, 3 products live
Conventional
25% down · 7.5% · 30yr
- Down + closing
- —
- Monthly P&I
- —
- Monthly cashflow
- —
- DSCR
- —
- Eligible?
- —
Personal DTI + credit; lowest rate.
DSCR
20% down · 8.5% · 30yr
- Down + closing
- —
- Monthly P&I
- —
- Monthly cashflow
- —
- DSCR
- —
- Eligible?
- —
No personal income docs; deal must DSCR.
Hard money
10% down · 12.0% · 12mo
- Down + closing
- —
- Monthly P&I
- —
- Monthly cashflow
- —
- DSCR
- —
- Eligible?
- —
Short-term bridge; refi at stabilization.
Rent comps 2 comps
| Address | Beds | Baths | Sqft | Rent | $/sqft | DOM | Units | Dist |
|---|---|---|---|---|---|---|---|---|
| 36 Farmington Rd Rochester, NH | 1.0–2.0 | 1.0 | 875 | $2,300 | $2.63 | 0d | 1 | 0.26mi |
| 9 Elm Ct Rochester, NH | 2.0 | 1.0 | 1100 | $2,000 | $1.82 | 0d | 1 | 1.12mi |
HOA detail
- Monthly dues
- $900 · $10,800/yr
Listing history 8 events
-
2026-06-21days on market $99,900 Active 10 DOM
-
2026-06-18days on market $99,900 Active 7 DOM
-
2026-06-17days on market $99,900 Active 6 DOM
-
2026-06-16days on market $99,900 Active 5 DOM
-
2026-06-15days on market $99,900 Active 4 DOM
-
2026-06-13days on market $99,900 Active 2 DOM
-
2026-06-13remarks 466-char remark
-
2026-06-13$99,900 Active 1 DOM
ⓘ Source: listings_history table (triggers on properties + properties_extension) + one-shot
backfill from property_details.listing_events for pre-trigger history.
Tax reassessment forecast NH · Partial reset (capped growth)
- Current annual tax
- $1,997 · $166/mo
- Projected year-2 tax
- $2,087 · $174/mo
- Expected delta
- +$90/yr (+$8/mo · 4.5%)
ⓘ Screening estimate from a state-policy table — verify with the county assessor before closing.
Nearby sold comps map
Loading sold comps map…
Walkable amenities ~0.75 mi
Loading nearby amenities…
Taxation est. · year 1
- Rental income
- $25,158
- − Mortgage interest
- −$5,596
- − Property taxes
- −$1,997
- − Insurance
- −$500
- − Repairs & maintenance
- −$2,013
- − Management
- −$2,013
- − HOA
- −$10,800
- − Depreciation
- −$2,906
- Taxable loss
- −$666
- Est. tax savings @ 24.0%
- +$160
- After-tax cash flow
- $451/yr
For passive investors: Depreciation is non-cash, so a rental often shows a tax loss while cash-flowing — sheltering income. Rental losses are passive: they offset passive income freely, and up to $25,000/yr can offset ordinary (W-2) income if you actively participate and your MAGI is under $100k (phasing out to $0 by $150k); unused losses carry forward. On sale, claimed depreciation is recaptured at up to 25%, and gains may owe capital-gains tax (a 1031 exchange can defer both). Figures are a year-1 estimate at your 24.0% rate — not tax advice; consult a CPA.
Schools (NCES district)
- District
- Rochester School District
- NCES district ID
- 3305940
- Math proficiency
- 27% ▼ -15.00%
- Reading proficiency
- 35% ▼ -14.00%
- Median HH income
- $51,080
- Composite
- 27.11/100
- National rank
- #7039
- State rank
- #83 of 98 in NH
Livability — Rochester
- Score
- 84/100
- State rank
- #8
- US rank
- #698
Category grades
Schools grade is shown separately in the Schools card above.
Census & demographics
- Census place
- Rochester, NH
- County
- Strafford County · 75,181 people
- City population
- 22,732
- Metro
- Boston-Cambridge-Newton, MA-NH
- Population (ZIP)
- 22,732
- Household income
- $78,674
- Rent vs Own
- Severe rent burden
- 663.0
Population outlook (Strafford County) Hauer SSP2
- Today (2025)
- 132,503 people
- By 2030
- 135,377 · +2.2%
- By 2040
- 139,609 · +5.4%
- By 2050
- 141,803 · +7.0%
- By 2075
- 149,280 · +12.7%
- By 2100
- 148,667 · +12.2%
Race, ethnicity, and origin ACS 2023
- Neighborhood character
- Predominantly White (93%)
- Race & ethnicity
- White 93% Two or more races 4% Hispanic / Latino 2% Asian 1%
- Common ancestry
- Lithuanian 12% Romanian 2% Serbian 2%
- Foreign-born
- 3% · Canada
- Languages at home
- 96% English-only · Spanish 1% French/Haitian/Cajun 1%
Political lean MEDSL · Strafford
- 2024 margin
- D (+12.1) · D 55.5% · R 43.5% · Other 1.0%
- 2008→2024 swing
- -8.3pp toward R · 2008: 20.4pp · 2024: 12.1pp
- All cycles
- 2024: D+12.1 2020: D+15.2 2016: D+8.6 2012: D+14.5 2008: D+20.4
Not yet ingested
- Civics
- —
Market trends
- HPI YoY
- ▼ -107.34%
- Current HPI
- 379.5755
- Rent YoY
- ▲ 4.22%
- Metro
- Boston-Cambridge-Newton, MA-NH
- State GDP YoY
- —
- F500 in state
- 0
Price history
+66.5% since first listed3 events — show timeline
- 2026-06-11 Listed $99,900 PrimeMLS
- 2026-05-18 Sold (Public Records) $85,000 Public Records
- 1988-08-16 Sold (Public Records) $60,000 Public Records
Property tax history
+6.8%/yrLatest (2025): $1,997 · +3.0% YoY. Source: county tax records.
Cash-flow waterfall
monthlySold comps — $/sqft
last 12 mo · ≤1 miLoading sold comps…