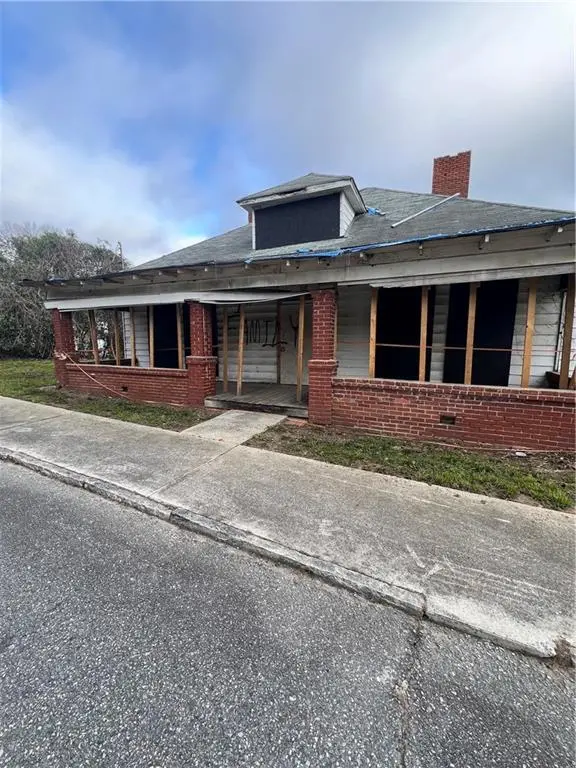
2265 Clayton St · Macon-Bibb County, GA
Flood risk 1/10 · Minimal
- FEMA flood zone
- X (unshaded)
- Chance of flooding over 30 yrs
- 0.0%
- Est. flood insurance / yr
- $473 – $860
Fire risk 1/10 · Minimal
- Est. fire insurance / yr
- $963 – $1,789
Heat risk 7/10 · Major
- Hot days now (above 108°F)
- 7 days/yr
- Hot days in 30 yrs
- 17 days/yr
Wind risk 6/10 · Moderate
- Chance of severe wind over 30 yrs
- 66.0%
Air-quality risk 3/10 · Minor
- Unhealthy air days now
- 3 days/yr
- Unhealthy air days in 30 yrs
- 4 days/yr
Risk factors via First Street. Map © Google.
Why this score? — see what drove the D grade
The composite is a weighted blend of 9 inputs, each scored 0–100. Each bar is that input's sub-score; the figure is the points it added to the 100-point composite (weight × sub-score).
- Cash flow +15.0/30.0
- ARV discount +7.5/15.0
- 1% rule +5.0/10.0
- DSCR +5.0/10.0
- Rent growth +3.7/5.0
- Livability +2.5/5.0
- Condition / age +2.5/5.0
- Schools +1.2/10.0
- Appreciation +0.0/10.0
$25,900
🖨 Deal sheet 📄 Offer letter ✓ Due diligence
Listing remarks MLS
Great investment opportunity in the heart of historic Intown Macon. Property is just a few short blocks of Mercer Law, all the shops, restaurants, downtown, and easy access to both I-75 and I-16 interstates.
Key facts
- Easy access to i-16
- Easy access to i-75
- 6,098 sq ft lot
Tags
Neighborhood map
What this means for you Summary
Snapshot
- This is a 3-bed/1.0-bath single-family listed at $26k.
Deal economics
- At list price, monthly cash flow is $1k ($12k/yr) — positive.
- The deal already cash-flows at list — no discount required.
- Meets the 1% rule at list price ($2k rent vs $26k).
- Recommended offer: $24k (9.0% below list) — sets the bar for market timing.
- Cap rate 53.8% vs local median 5.4% in Macon-Bibb County — top-decile yield for the area; either an underpriced asset or a hidden risk that comps aren't pricing in. Stress-test before assuming the spread holds.
Location & tenants
- Location reads: area grade D — affects rentability + tenant quality, not the cash-flow math above.
- Bibb County (urban): math 11% / reading 18% proficiency, ranked #161 of 174 in GA (top 92%) — low school quality limits family demand, transient renter base, plan for 1-2y turnover; 75% free/reduced lunch — lower-income household profile, screen leases tightly.
- Market conditions: Rents rising fast (+4.6%/yr); 255 active listings in the ZIP; 14 comparable units currently listed for rent nearby; rentals at typical pace (median 21d on market — plan ~3-4 weeks tenant-placement turnaround); 43% of comp listings sitting > 30 days — soft ceiling on asking rent; lower-income renter base — watch delinquency; 154 units permitted in Bibb County in 2024 (0 in 5+ unit buildings).
- At $1,556/mo this rent would consume 48% of the median local household income ($39k/yr) (locally 2674% of renters already pay >50% of income on rent) — very limited rent-growth headroom before tenants either downsize or default.
Forward outlook
- Local home prices are declining (-3.0%/yr); year-one equity from $179 of loan paydown is wiped out by about $777 of value loss. Plan a longer hold.
- Bibb County population projected at -12% by 2050 — secular population decline; favor cash flow + early exit over multi-decade hold.
- At projected returns (-3.0% appreciation + 4.6% rent growth), your $7k cash investment doubles in ~1 year — after that, you're playing with house money.
Negotiation context
- It's been on market 92 days — a 9% lower offer ($24k) is reasonable based on typical stale-listing flexibility.
- 6 sale attempts since 4y ago; this cycle's ask has dropped $19k (42%) from the opening price — seller is motivated, your offer sets the floor, not the list.
- Current owner paid $18k; 48% above their basis — modest negotiation headroom, anchor on the comps not their cost.
Risks & watch-outs
- Watch-outs: property tax is 2.7% of price; built in 1900 — expect roof / HVAC / electrical / plumbing capex.
- Climate carrying-cost: major wind risk, 66% chance of damaging wind over 30y; extreme-heat days projected 7→17/yr by 2055 (HVAC capex compounding) — expect insurance premiums to compound above CPI over the hold.
Questions for the listing agent
- It's been on market 92 days. Have you received any prior offers? Is the seller open to a 9% concession, seller financing, or rate buy-down credit?
- Built in 1900 — when were the roof, HVAC, electrical panel, plumbing, and water heater last replaced?
- Property tax is high relative to price — has the assessment been appealed recently, and will the sale trigger a re-assessment?
- Why hasn't it sold? Are there any deal-killer items the seller is aware of (foundation, flood, title, zoning, code violations)?
- Is there a deadline driving the sale (1031 exchange, divorce, estate, relocation)? That informs how much negotiation room exists.
- The area grade is low — what's the realistic commute time and amenity access for the typical tenant pool here? Any planned neighborhood developments (good or bad) we should know about?
- What's the average days-on-market for RENTAL listings here right now (not sales)? A rising rental-DOM trend means longer vacancies and softer asking-rent achievability than the comps imply.
- What's the recent tenant-quality profile in this submarket — average credit score on applications, eviction rate, late-payment / NSF rate, and stable-employment percentage? A property-management company in the area should have these aggregated.
- How much new for-sale + rental construction is in the pipeline within 1–3 miles? Heavy new supply typically softens prices + rents 12–24 months out; constrained supply supports both.
Investment metrics
- 1% rule
- 6.01% ✓
- Cap rate
- 53.79%
- Cash-on-cash
- 169.64%
- DSCR
- 8.55
- GRM
- 1.4
CMA / ARV
- ARV (median comp)
- $78,285
- List price
- $25,900
- Delta
- -66.92%
- Verdict
- UNDERPRICED
- Comps
- 20 within 1.0 mi
Show comp detail 12 sales within ~0.75 mi
| Address | Dist | Beds/Ba | Sqft | Sold | Price | $/sf | Match |
|---|---|---|---|---|---|---|---|
| 161 Buford Pl | 0.29mi | 3/2.0 | 2,184 (-3%) | 6mo | $370,000 | $169 | 72 |
| 305 Grant Ave | 0.43mi | 3/2.5 | 2,146 (-5%) | 8mo | $166,000 | $77 | 60 |
| 230 Calloway Dr | 0.26mi | 2/2.0 (-1) | 1,992 (-12%) | 2mo | $270,000 | $136 | 58 |
| 258 Beverly Pl | 0.54mi | 4/3.0 (+1) | 2,278 (+1%) | 7mo | $349,900 | $154 | 54 |
| 546 Corbin Ave | 0.70mi | 3/2.0 | 2,080 (-8%) | 2mo | $260,000 | $125 | 49 |
| 2620 Stanislaus Cir | 0.68mi | 3/2.0 | 2,019 (-10%) | 3mo | $360,000 | $178 | 45 |
| 377 Grant Ave | 0.49mi | 4/2.0 (+1) | 1,972 (-12%) | 3mo | $40,000 | $20 | 45 |
| 277 Pierce Ave | 0.46mi | 2/2.0 (-1) | 1,962 (-13%) | 5mo | $330,000 | $168 | 43 |
| 185 Stonewall Pl | 0.54mi | 3/3.0 | 2,028 (-10%) | 9mo | $348,500 | $172 | 43 |
| 1812 5th Ave W | 0.62mi | 4/2.0 (+1) | 2,005 (-11%) | 2mo | $20,000 | $10 | 42 |
| 2724 Ingleside Ave | 0.63mi | 3/2.5 | 2,493 (+11%) | 7mo | $395,000 | $158 | 41 |
| 470 General Winship Dr S | 0.60mi | 3/3.0 | 2,535 (+12%) | 7mo | $108,000 | $43 | 37 |
Match score weights: distance 35% · size 25% · config 20% · recency 20%. Top-matched comps best support the ARV.
Projected returns pro-forma
-3.0% appreciation · 4.61% rent growth · sell at horizon
- IRR
- —
- Equity multiple
- 9.78×
- Total profit
- $63,697
- Equity at exit
- $3,862
- IRR
- —
- Equity multiple
- 21.76×
- Total profit
- $150,561
- Equity at exit
- $2,239
Cash invested: $7,252 (down + closing). Projections, not guarantees.
Landlord ↔ Tenant lean methodology
- Overall (STATE)
- 90 Strongly Landlord-Friendly
- State Georgia
- 90 Strongly Landlord-Friendly · R+3
- County
- — inherits STATE
- City
- — inherits STATE
ZIP-level market 31204
- Rents YoY
- 4.6%
- Active inventory
- 255
- Price-to-rent
- 1.4×
Monthly cashflow live
- Estimated rent
- $1,556 high interval (Pro) →
- Mortgage (P&I)
- −$136
- Tax from tax record
- −$58 /mo · $691/yr
- Insurance
- −$11
- HOA
- −$0
- Vacancy / Maint / Mgmt
- −$327
- Net cashflow
- $1,025
Break-even live
UW: 25.0% down · 7.5% · 30yr · 1.5% tax · 5.0% vac · 8.0% maint · 8.0% mgmt
Financing live
Cash to close
- Down payment
- $6,475
- Closing costs
- $777
- Reserves months
- —
- Total cash needed
- —
Loan-product check · same deal, 3 products live
Conventional
25% down · 7.5% · 30yr
- Down + closing
- —
- Monthly P&I
- —
- Monthly cashflow
- —
- DSCR
- —
- Eligible?
- —
Personal DTI + credit; lowest rate.
DSCR
20% down · 8.5% · 30yr
- Down + closing
- —
- Monthly P&I
- —
- Monthly cashflow
- —
- DSCR
- —
- Eligible?
- —
No personal income docs; deal must DSCR.
Hard money
10% down · 12.0% · 12mo
- Down + closing
- —
- Monthly P&I
- —
- Monthly cashflow
- —
- DSCR
- —
- Eligible?
- —
Short-term bridge; refi at stabilization.
Rent comps 14 comps
| Address | Beds | Baths | Sqft | Rent | $/sqft | DOM | Units | Dist |
|---|---|---|---|---|---|---|---|---|
| 425 Rogers Ave Macon, GA | 3.0 | 2.0 | 1646 | $1,375 | $0.84 | 13d | 1 | 0.38mi |
| 240 Candler Dr Macon, GA | 3.0 | 2.0 | 2635 | $1,850 | $0.70 | 13d | 1 | 0.78mi |
| 2663 Hillcrest Ave Macon, GA | 3.0 | 2.0 | 1931 | $1,395 | $0.72 | 20d | 1 | 0.90mi |
| 2585 Napier Ave Unit A Macon, GA | 2.0 | 2.0 | 2007 | $950 | $0.47 | 43d | 1 | 0.99mi |
| 2733 Hillcrest Ave Macon, GA | 4.0 | 3.0 | 3094 | $2,300 | $0.74 | 13d | 1 | 1.00mi |
| 2694 Cherokee Ave Unit A Macon, GA | 3.0 | 1.5 | 1985 | $1,250 | $0.63 | 43d | 1 | 1.02mi |
| 1025 Hillyer Ave Macon, GA | 3.0 | 2.0 | 1738 | $1,800 | $1.04 | 20d | 1 | 1.06mi |
| 1025 Hillyer Ave Macon, GA | 4.0 | 2.0 | 1738 | $1,800 | $1.04 | 43d | 1 | 1.06mi |
| 305 Orange St Macon, GA | 3.0 | 2.0 | 2791 | $2,950 | $1.06 | 43d | 1 | 1.11mi |
| 919 Inverness Ave Macon, GA | 3.0 | 2.0 | 1676 | $1,549 | $0.92 | 20d | 1 | 1.12mi |
| 2794 Napier Ave Macon, GA | 3.0 | 2.0 | 1672 | $1,175 | $0.70 | 43d | 1 | 1.22mi |
| 209 Ridgewood Ave Unit 209 Macon, GA | 3.0 | 1.5 | 1600 | $1,200 | $0.75 | 20d | 1 | 1.24mi |
| 201 Ridgewood Ave Macon, GA | 3.0 | 1.5 | 1600 | $1,200 | $0.75 | 20d | 1 | 1.28mi |
| 1336 Winton Ave Macon, GA | 3.0 | 2.0 | 1632 | $1,350 | $0.83 | 43d | 1 | 1.32mi |
Listing history 35 events
-
2026-06-19days on market $25,900 Active 92 DOM
-
2026-06-18days on market $25,900 Active 91 DOM
-
2026-06-17days on market $25,900 Active 90 DOM
-
2026-06-16days on market $25,900 Active 89 DOM
-
2026-06-15days on market $25,900 Active 88 DOM
-
2026-06-14days on market $25,900 Active 86 DOM
-
2026-06-13days on market $25,900 Active 85 DOM
-
2026-06-10days on market $25,900 Active 83 DOM
-
2026-06-09days on market $25,900 Active 82 DOM
-
2026-06-09days on market $25,900 Active 81 DOM
-
2026-06-07pricedays on market $25,900 Active 80 DOM
-
2026-06-03pricedays on market $26,900 Active 76 DOM
-
2026-06-02days on market $29,500 Active 75 DOM
-
2026-06-01days on market $29,500 Active 74 DOM
-
2026-05-31days on market $29,500 Active 73 DOM
-
2026-05-30days on market $29,500 Active 72 DOM
-
2026-04-14price $35,000 207-char remark
Show marketing remark (207 chars)
Great investment opportunity in the heart of historic Intown Macon. Property is just a few short blocks of Mercer Law, all the shops, restaurants, downtown, and easy access to both I-75 and I-16 interstates.
-
2026-04-14price $35,000 207-char remark
Show marketing remark (207 chars)
Great investment opportunity in the heart of historic Intown Macon. Property is just a few short blocks of Mercer Law, all the shops, restaurants, downtown, and easy access to both I-75 and I-16 interstates.
-
2026-03-19$45,000 New 207-char remark
Show marketing remark (207 chars)
Great investment opportunity in the heart of historic Intown Macon. Property is just a few short blocks of Mercer Law, all the shops, restaurants, downtown, and easy access to both I-75 and I-16 interstates.
-
2026-03-19$45,000 Active 207-char remark
Show marketing remark (207 chars)
Great investment opportunity in the heart of historic Intown Macon. Property is just a few short blocks of Mercer Law, all the shops, restaurants, downtown, and easy access to both I-75 and I-16 interstates.
-
2024-08-30historical
-
2024-08-30historical
-
2024-08-09price $44,000
-
2024-08-09price $44,000
-
2024-07-15price $49,100
-
2024-07-15price $49,100
-
2024-06-18price $49,500
-
2024-06-18price $49,500
-
2024-05-14$50,000 New
-
2024-05-14$50,000 Active
-
2022-07-18soldstatus $17,500 Closed
-
2022-07-01status Pending
-
2022-06-17status Active
-
2022-05-26status Pending
-
2022-05-20$19,000 Active
ⓘ Source: listings_history table (triggers on properties + properties_extension) + one-shot
backfill from property_details.listing_events for pre-trigger history.
Tax reassessment forecast GA · Resets to sale price
- Current annual tax
- $691 · $58/mo
- Projected year-2 tax
- $691 · $58/mo
- Expected delta
- $0/yr ($0/mo · 0.0%)
ⓘ Screening estimate from a state-policy table — verify with the county assessor before closing.
Climate risk First Street
- Flood 1/10 Low FEMA zone X (unshaded) · 0% chance over 30 yrs
- Wildfire 1/10 Low
- Heat 7/10 Severe 7 d/yr ≥108°F today · 17 d/yr by 30 yrs out
- Wind 6/10 Major 66% chance of damaging wind over 30 yrs
- Air quality 3/10 Moderate 3 unhealthy d/yr today · 4 by 30 yrs out
Nearby sold comps map
Loading sold comps map…
Walkable amenities ~0.75 mi
Loading nearby amenities…
Taxation est. · year 1
- Rental income
- $18,674
- − Mortgage interest
- −$1,451
- − Property taxes
- −$691
- − Insurance
- −$130
- − Repairs & maintenance
- −$1,494
- − Management
- −$1,494
- − Depreciation
- −$753
- Taxable income
- $12,661
- Est. tax owed @ 24.0%
- −$3,039
- After-tax cash flow
- $9,263/yr
For passive investors: Depreciation is non-cash, so a rental often shows a tax loss while cash-flowing — sheltering income. Rental losses are passive: they offset passive income freely, and up to $25,000/yr can offset ordinary (W-2) income if you actively participate and your MAGI is under $100k (phasing out to $0 by $150k); unused losses carry forward. On sale, claimed depreciation is recaptured at up to 25%, and gains may owe capital-gains tax (a 1031 exchange can defer both). Figures are a year-1 estimate at your 24.0% rate — not tax advice; consult a CPA.
Schools (NCES district)
- District
- Bibb County
- NCES district ID
- 1300420
- Math proficiency
- 11% ▼ -14.00%
- Reading proficiency
- 18% ▼ -11.00%
- Median HH income
- $37,426
- Composite
- 12.13/100
- National rank
- #9654
- State rank
- #161 of 174 in GA
Livability — Macon-Bibb County
No livability data for this city. (Only ~50 U.S. cities are tracked.)
Census & demographics
- Census place
- Macon-Bibb County, GA
- County
- Bibb County · 164,332 people
- City population
- 143,186
- Metro
- Macon-Bibb County, GA
- Population (ZIP)
- 32,421
- Household income
- $38,784
- Rent vs Own
- Severe rent burden
- 2674.0
Population outlook (Bibb County) Hauer SSP2
- Today (2025)
- 148,772 people
- By 2030
- 145,904 · -1.9%
- By 2040
- 139,404 · -6.3%
- By 2050
- 131,603 · -11.5%
- By 2075
- 111,050 · -25.4%
- By 2100
- 83,346 · -44.0%
Race, ethnicity, and origin ACS 2023
- Neighborhood character
- Predominantly Black (65%)
- Race & ethnicity
- Black 65% White 28% Hispanic / Latino 3% Two or more races 2% Asian 1%
- Common ancestry
- Serbian 2% Slovak 1% Lithuanian 1%
- Foreign-born
- 2% · Canada
- Languages at home
- 96% English-only · Spanish 2% French/Haitian/Cajun 1%
Political lean MEDSL · Bibb
- 2024 margin
- Strong D (+22.4) · D 61.0% · R 38.5%
- 2008→2024 swing
- +4.4pp toward D · 2008: 18.0pp · 2024: 22.4pp
- All cycles
- 2024: D+22.4 2020: D+23.8 2016: D+20.2 2012: D+20.0 2008: D+18.0
Not yet ingested
- Civics
- —
Market trends
- HPI YoY
- ▼ -135.44%
- Current HPI
- 194.5459
- Rent YoY
- ▲ 4.61%
- Metro
- Macon-Bibb County, GA
- State GDP YoY
- ▲ 2.66%
- F500 in state
- 28
Industry mix (Fortune 500 HQ in GA)
| Industry | F500 HQs | Revenue |
|---|---|---|
| Paper / Packaging | 2 | $29B |
|
||
| Retail | 1 | $160B |
|
||
| Transportation / Logistics | 1 | $91B |
|
||
| Airlines | 1 | $62B |
|
||
| Consumer Goods | 1 | $47B |
|
||
| Utilities | 1 | $25B |
|
||
Price history
+84.2% since first listed19 events — show timeline
- 2026-04-14 Price Changed $35,000 GAMLS
- 2026-04-14 Price Changed $35,000 FMLS
- 2026-03-19 Listed $45,000 FMLS
- 2026-03-19 Listed $45,000 GAMLS
- 2024-08-30 Listing Removed — FMLS
- 2024-08-30 Listing Removed — GAMLS
- 2024-08-09 Price Changed $44,000 GAMLS
- 2024-08-09 Price Changed $44,000 FMLS
- 2024-07-15 Price Changed $49,100 GAMLS
- 2024-07-15 Price Changed $49,100 FMLS
- 2024-06-18 Price Changed $49,500 GAMLS
- 2024-06-18 Price Changed $49,500 FMLS
- 2024-05-14 Listed $50,000 FMLS
- 2024-05-14 Listed $50,000 GAMLS
- 2022-07-18 Sold (MLS) $17,500 FMLS
- 2022-07-01 Pending — FMLS
- 2022-06-17 Relisted — FMLS
- 2022-05-26 Pending — FMLS
- 2022-05-20 Listed $19,000 FMLS
Property tax history
+14.6%/yrLatest (2025): $691 · +3.6% YoY. Source: county tax records.
Cash-flow waterfall
monthlySold comps — $/sqft
last 12 mo · ≤1 miLoading sold comps…