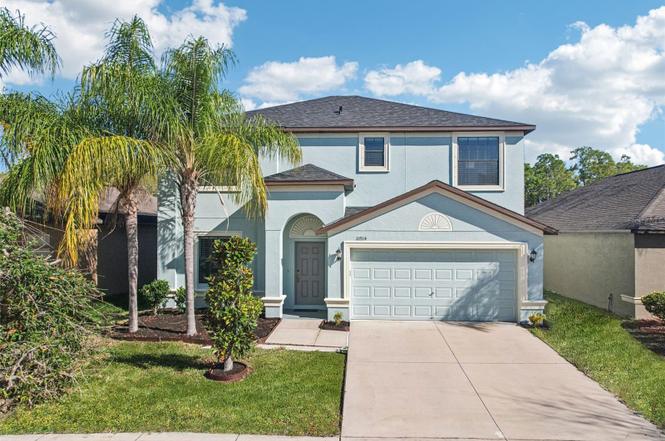
10914 Whitecap Dr · Riverview, FL
Flood risk 1/10 · Minimal
- FEMA flood zone
- X (unshaded)
- Chance of flooding over 30 yrs
- 0.0%
- Est. flood insurance / yr
- $507 – $1,088
Fire risk 4/10 · Minor
- Est. fire insurance / yr
- $947 – $1,759
Heat risk 10/10 · Severe
- Hot days now (above 109°F)
- 7 days/yr
- Hot days in 30 yrs
- 30 days/yr
Wind risk 9/10 · Severe
- Chance of severe wind over 30 yrs
- 99.0%
Air-quality risk 3/10 · Minor
- Unhealthy air days now
- 3 days/yr
- Unhealthy air days in 30 yrs
- 3 days/yr
Risk factors via First Street. Map © Google.
Why this score? — see what drove the D- grade
The composite is a weighted blend of 9 inputs, each scored 0–100. Each bar is that input's sub-score; the figure is the points it added to the 100-point composite (weight × sub-score).
- Cash flow +9.5/30.0
- ARV discount +7.5/15.0
- Appreciation +4.3/10.0
- Schools +4.2/10.0
- Livability +4.0/5.0
- Rent growth +2.8/5.0
- DSCR +2.7/10.0
- 1% rule +2.6/10.0
- Condition / age +2.5/5.0
$375,000
🖨 Deal sheet (PDF) 📄 Offer letter ✓ Due diligence
Listing remarks
BACK ON THE MARKET! Buyer Financing fell through. Step into your new home in Summerfield Crossings, a family-friendly neighborhood where tree-lined streets, walkable paths, and a welcoming community set the stage for everyday joy. This beautifully maintained home has been refreshed with a NEW ROOF AND FRESHLY PAINTED INTERIOR AND EXTERIOR IN 2025, ensuring both style and peace of mind. Inside, the home feels bright, open, and inviting. Charming arched doorways guide you through formal living and dining spaces, while the main floor’s tile flooring creates a clean, cohesive look. The kitchen offers 42” ESPRESSO CABINETRY WITH CROWN MOLDING, GRANITE COUNTERTOPS, AND A CENTRAL ISLAN
Key facts
- Central island
- Plenty of storage
- Espresso cabinetry
Tags
Neighborhood map
What this means for you Summary
Snapshot
- This is a 4-bed/3.0-bath single-family listed at $375k.
Deal economics
- At list price, monthly cash flow is $-259 ($-3k/yr) — negative.
- To cash-flow at today's rent, offer at most $329k (12.2% below list).
- To meet the 1% rule (rent ≥ 1% of price), the offer needs to be $284k (24.2% below list).
- Recommended offer: $284k (24.2% below list) — sets the bar for 1% rule.
Location & tenants
- Location reads 79/100 on livability (#134 in FL, #2,000 nationally) — a middle-class / working-renter tenant base. Strengths: housing A+, health & safety A+, employment B+; Watch: amenities F.
- Hillsborough (suburban): math 47% / reading 50% proficiency, ranked #41 of 73 in FL (top 56%) — families likely to look elsewhere, expect single-tenant / working-renter base with shorter leases.
- Zoned schools: Summerfield Crossings Elementary School (math 43% / reading 45%, grade F, #1,330 of 2,144 statewide, top 63%, 869 students, 53% FRL); East Bay High School (math 24% / reading 35%, grade F, #447 of 667 statewide, top 68%, 1,995 students, 51% FRL) — zoned schools at 52% FRL track the district average.
- Market conditions: Rents rising (+1.2%/yr); 463 active listings in the ZIP; 40 comparable units currently listed for rent nearby; rentals at typical pace (median 26d on market — plan ~3-4 weeks tenant-placement turnaround); high-income renter base; 9,053 units permitted in Hillsborough County in 2024 (4,555 in 5+ unit buildings).
Forward outlook
- Local home prices are declining (-1.4%/yr); year-one equity from $3k of loan paydown is wiped out by about $5k of value loss. Plan a longer hold.
- Hillsborough County population projected at +37% by 2050 — long-run rental-demand tailwind backs the buy-and-hold thesis.
Negotiation context
- It's been on market 34 days — a 3% lower offer ($364k) is reasonable based on typical stale-listing flexibility.
- 3 sale attempts; this cycle's ask has dropped $25k (6%) from the opening price — seller is motivated, your offer sets the floor, not the list.
Risks & watch-outs
- Climate carrying-cost: severe wind risk, 99% chance of damaging wind over 30y; extreme-heat days projected 7→30/yr by 2055 (HVAC capex compounding) — expect insurance premiums to compound above CPI over the hold.
Questions for the listing agent
- What do current leases actually rent for vs. the listed asking? Can we see a recent rent roll and the last 12 months of T-12 income?
- It's been on market 34 days. Have you received any prior offers? Is the seller open to a 24% concession, seller financing, or rate buy-down credit?
- What does the HOA fee cover, when was the last increase, and are there any pending special assessments or reserve-fund shortfalls?
- Is there a deadline driving the sale (1031 exchange, divorce, estate, relocation)? That informs how much negotiation room exists.
- Schools are B-rated — typically a magnet for longer-tenancy family renters. What's the average tenant stay here, and is there a school-zone premium baked into asking?
- The area grade is low — what's the realistic commute time and amenity access for the typical tenant pool here? Any planned neighborhood developments (good or bad) we should know about?
- What's the average days-on-market for RENTAL listings here right now (not sales)? A rising rental-DOM trend means longer vacancies and softer asking-rent achievability than the comps imply.
- What's the recent tenant-quality profile in this submarket — average credit score on applications, eviction rate, late-payment / NSF rate, and stable-employment percentage? A property-management company in the area should have these aggregated.
- How much new for-sale + rental construction is in the pipeline within 1–3 miles? Heavy new supply typically softens prices + rents 12–24 months out; constrained supply supports both.
Investment metrics
- 1% rule
- 0.76% ✗
- Cap rate
- 5.47%
- Cash-on-cash
- -2.96%
- DSCR
- 0.87
- GRM
- 11.0
CMA / ARV
No comps found within radius.
Projected returns pro-forma
-1.42% appreciation · 1.18% rent growth · sell at horizon
- IRR
- -13.3%
- Equity multiple
- 0.46×
- Total profit
- $-56,898
- Equity at exit
- $83,000
- IRR
- -8.1%
- Equity multiple
- 0.36×
- Total profit
- $-67,624
- Equity at exit
- $80,900
Cash invested: $105,000 (down + closing). Projections, not guarantees.
Landlord ↔ Tenant lean methodology
- Overall (STATE)
- 87 Strongly Landlord-Friendly
- State Florida
- 87 Strongly Landlord-Friendly · R+3
- County
- — inherits STATE
- City
- — inherits STATE
ZIP-level market 33579
- Home prices YoY
- -0.6%
- Rents YoY
- 1.2%
- Active inventory
- 463
- Price-to-rent
- 11.0×
Monthly cashflow live
- Estimated rent
- $2,842 high interval (Pro) →
- Mortgage (P&I)
- −$1,967
- Tax from tax record
- −$336 /mo · $4,031/yr
- Insurance
- −$156
- HOA
- −$45
- Vacancy / Maint / Mgmt
- −$597
- Net cashflow
- $-259
Break-even live
Sensitivity live
| Price | -10% $-46 | -5% $-152 | +0% $-259 | +5% $-365 | +10% $-471 |
|---|---|---|---|---|---|
| Rent | -10% $-483 | -5% $-371 | +0% $-259 | +5% $-146 | +10% $-34 |
| Rate | -1.0pp $-70 | -0.5pp $-163 | base $-259 | +0.5pp $-356 | +1.0pp $-455 |
UW: 25.0% down · 7.5% · 30yr · 1.5% tax · 5.0% vac · 8.0% maint · 8.0% mgmt
Financing live
Cash to close
- Down payment
- $93,750
- Closing costs
- $11,250
- Reserves months
- —
- Total cash needed
- —
Loan-product check · same deal, 3 products live
Conventional
25% down · 7.5% · 30yr
- Down + closing
- —
- Monthly P&I
- —
- Monthly cashflow
- —
- DSCR
- —
- Eligible?
- —
Personal DTI + credit; lowest rate.
DSCR
20% down · 8.5% · 30yr
- Down + closing
- —
- Monthly P&I
- —
- Monthly cashflow
- —
- DSCR
- —
- Eligible?
- —
No personal income docs; deal must DSCR.
Hard money
10% down · 12.0% · 12mo
- Down + closing
- —
- Monthly P&I
- —
- Monthly cashflow
- —
- DSCR
- —
- Eligible?
- —
Short-term bridge; refi at stabilization.
Rent comps 40 comps
| Address | Beds | Baths | Sqft | Rent | $/sqft | DOM | Units | Dist |
|---|---|---|---|---|---|---|---|---|
| 10904 Summerton Dr Riverview, FL | 4.0 | 3.0 | 2977 | $3,150 | $1.06 | 5d | 1 | 0.09mi |
| 13130 Fennway Ridge Dr Riverview, FL | 4.0 | 2.5 | 1736 | $2,219 | $1.28 | 4d | 1 | 0.12mi |
| 10905 Capstan Lake Dr Riverview, FL | 5.0 | 3.0 | 3011 | $2,800 | $0.93 | 26d | 1 | 0.25mi |
| 12962 Fennway Ridge Dr Riverview, FL | 4.0 | 2.5 | 2098 | $2,950 | $1.41 | 26d | 1 | 0.34mi |
| 10925 Subtle Trail Dr Riverview, FL | 3.0 | 2.0 | 1716 | $2,000 | $1.17 | 26d | 1 | 0.36mi |
| 11009 Golden Silence Dr Riverview, FL | 4.0 | 2.5 | 2154 | $2,800 | $1.30 | 26d | 1 | 0.43mi |
| 11025 Golden Silence Dr Riverview, FL | 3.0 | 2.5 | 1785 | $2,210 | $1.24 | 16d | 1 | 0.46mi |
| 11121 Kempton Vista Dr Riverview, FL | 4.0 | 2.0 | 1983 | $2,350 | $1.19 | 26d | 1 | 0.46mi |
| 11106 Kempton Vista Dr Riverview, FL | 4.0 | 2.5 | 3300 | $3,100 | $0.94 | 1d | 1 | 0.47mi |
| 13625 Silver Charm Ct Riverview, FL | 4.0 | 2.5 | 1907 | $2,350 | $1.23 | 26d | 1 | 0.56mi |
| 10805 Australian Pine Dr Riverview, FL | 3.0 | 2.0 | 1897 | $2,350 | $1.24 | 26d | 1 | 0.57mi |
| 11164 Golden Silence Dr Riverview, FL | 3.0 | 2.0 | 1930 | $2,050 | $1.06 | 26d | 1 | 0.61mi |
| 12942 Utopia Gardens Way Riverview, FL | 3.0 | 2.5 | 1668 | $2,390 | $1.43 | 1d | 1 | 0.62mi |
| 12942 Utopia Gardens Way Riverview, FL | 3.0 | 2.5 | 1668 | $2,350 | $1.41 | 4d | 1 | 0.62mi |
| 12961 Utopia Gardens Way Riverview, FL | 3.0 | 2.5 | 1668 | $1,890 | $1.13 | 18d | 1 | 0.65mi |
| 10505 Opus Dr Riverview, FL | 4.0 | 2.5 | 1942 | $2,550 | $1.31 | 26d | 1 | 0.65mi |
| 11322 Torrey Pines Dr Riverview, FL | 4.0 | 2.0 | 2194 | $2,300 | $1.05 | 26d | 1 | 0.69mi |
| 13305 Silvercreek Dr Riverview, FL | 3.0 | 2.0 | 1743 | $2,099 | $1.20 | 7d | 1 | 0.72mi |
| 13423 Beechberry Dr Riverview, FL | 4.0 | 2.5 | 2322 | $2,795 | $1.20 | 0d | 1 | 0.87mi |
| 13016 Prestwick Dr Riverview, FL | 4.0 | 3.0 | 2506 | $3,500 | $1.40 | 26d | 1 | 0.91mi |
| 11211 Flora Springs Dr Riverview, FL | 5.0 | 3.0 | 2320 | $2,723 | $1.17 | 25d | 1 | 1.02mi |
| 10825 Newbridge Dr Riverview, FL | 4.0 | 2.5 | 2021 | $3,500 | $1.73 | 1d | 1 | 1.05mi |
| 11176 Leland Groves Dr Riverview, FL | 4.0 | 2.5 | 2318 | $2,700 | $1.16 | 7d | 1 | 1.07mi |
| 12762 Standbridge Dr Riverview, FL | 3.0 | 2.5 | 2404 | $2,316 | $0.96 | 26d | 1 | 1.08mi |
| 12805 Avelar Manor Pl Riverview, FL | 3.0 | 2.0 | 1832 | $2,375 | $1.30 | 25d | 1 | 1.08mi |
| 12712 Longcrest Dr Riverview, FL | 4.0 | 2.0 | 1608 | $2,200 | $1.37 | 26d | 1 | 1.09mi |
| 11167 Leland Groves Dr Riverview, FL | 5.0 | 3.0 | 2526 | $3,500 | $1.39 | 26d | 1 | 1.10mi |
| 11510 Harlan Eddy Ct Riverview, FL | 4.0 | 2.0 | 2351 | $2,700 | $1.15 | 26d | 1 | 1.15mi |
| 10614 Shady Branch Dr Riverview, FL | 4.0 | 2.5 | 2482 | $2,286 | $0.92 | 16d | 1 | 1.17mi |
| 14010 Hollow Leaf Pl Riverview, FL | 3.0 | 2.0 | 1670 | $2,195 | $1.31 | 12d | 1 | 1.18mi |
| 12906 Longcrest Dr Riverview, FL | 4.0 | 2.0 | 1596 | $2,290 | $1.43 | 3d | 1 | 1.19mi |
| 11424 Misty Isle Ln Riverview, FL | 3.0 | 2.0 | 1839 | $2,165 | $1.18 | 14d | 1 | 1.20mi |
| 12845 Longcrest Dr Riverview, FL | 3.0 | 2.0 | 1812 | $2,215 | $1.22 | 0d | 1 | 1.21mi |
| 11519 Misty Isle Ln Riverview, FL | 4.0 | 2.0 | 1936 | $2,600 | $1.34 | 26d | 1 | 1.22mi |
| 11427 Misty Isle Ln Riverview, FL | 4.0 | 2.0 | 1916 | $2,310 | $1.21 | 7d | 1 | 1.22mi |
| 12722 Evington Point Dr Riverview, FL | 4.0 | 2.0 | 1750 | $2,150 | $1.23 | 7d | 1 | 1.22mi |
| 12722 Evington Point Dr Riverview, FL | 4.0 | 2.0 | 1754 | $2,150 | $1.23 | 26d | 1 | 1.22mi |
| 11412 Misty Isle Ln Riverview, FL | 5.0 | 4.0 | 2523 | $3,200 | $1.27 | 26d | 1 | 1.24mi |
| 12914 Astorwood Pl Riverview, FL | 4.0 | 2.0 | 1808 | $2,395 | $1.32 | 1d | 1 | 1.25mi |
| 12948 Tribute Dr Riverview, FL | 4.0 | 4.0 | 3000 | $2,500 | $0.83 | 5d | 1 | 1.27mi |
HOA detail
- Monthly dues
- $45 · $540/yr
Listing history 11 events
-
2026-04-23status Pending
-
2026-04-14status Active
-
2026-04-07status Pending
-
2026-03-31price $375,000
-
2026-03-13$400,000 Active
-
2026-03-01historical
-
2026-02-10price $415,000
-
2026-01-05price $422,000
-
2025-11-26price $425,000
-
2025-09-27price $434,000
-
2025-08-22$450,000 Active
ⓘ Source: listings_history table (triggers on properties + properties_extension) + one-shot
backfill from property_details.listing_events for pre-trigger history.
Tax reassessment forecast FL · Resets to sale price
- Current annual tax
- $4,031 · $336/mo
- Projected year-2 tax
- $4,031 · $336/mo
- Expected delta
- $0/yr ($0/mo · 0.0%)
ⓘ Screening estimate from a state-policy table — verify with the county assessor before closing.
Climate risk First Street
- Flood 1/10 Low FEMA zone X (unshaded) · 0% chance over 30 yrs
- Wildfire 4/10 Moderate
- Heat 10/10 Extreme 7 d/yr ≥109°F today · 30 d/yr by 30 yrs out
- Wind 9/10 Extreme 99% chance of damaging wind over 30 yrs
- Air quality 3/10 Moderate 3 unhealthy d/yr today · 3 by 30 yrs out
Nearby sold comps map
Loading sold comps map…
Walkable amenities ~0.75 mi
Loading nearby amenities…
Taxation est. · year 1
- Rental income
- $34,103
- − Mortgage interest
- −$21,006
- − Property taxes
- −$4,031
- − Insurance
- −$1,875
- − Repairs & maintenance
- −$2,728
- − Management
- −$2,728
- − HOA
- −$540
- − Depreciation
- −$10,909
- Taxable loss
- −$9,714
- Est. tax savings @ 24.0%
- +$2,331
- After-tax cash flow
- $-772/yr
For passive investors: Depreciation is non-cash, so a rental often shows a tax loss while cash-flowing — sheltering income. Rental losses are passive: they offset passive income freely, and up to $25,000/yr can offset ordinary (W-2) income if you actively participate and your MAGI is under $100k (phasing out to $0 by $150k); unused losses carry forward. On sale, claimed depreciation is recaptured at up to 25%, and gains may owe capital-gains tax (a 1031 exchange can defer both). Figures are a year-1 estimate at your 24.0% rate — not tax advice; consult a CPA.
Schools (NCES district)
- District
- Hillsborough
- NCES district ID
- 1200870
- Math proficiency
- 47% ▼ -8.00%
- Reading proficiency
- 50% ▼ -4.00%
- Median HH income
- $50,622
- Composite
- 41.6/100
- National rank
- #3435
- State rank
- #41 of 73 in FL
Livability — Riverview
- Score
- 79/100
- State rank
- #134
- US rank
- #2000
Category grades
Schools grade is shown separately in the Schools card above.
Census & demographics
- Census place
- Riverview, FL
- County
- Hillsborough County · 1,540,968 people
- City population
- 137,988
- Metro
- Tampa-St. Petersburg-Clearwater, FL
- Population (ZIP)
- 49,470
- Household income
- $116,134
- Rent vs Own
- Severe rent burden
- 258.0
Population outlook (Hillsborough County) Hauer SSP2
- Today (2025)
- 1,607,022 people
- By 2030
- 1,733,968 · +7.9%
- By 2040
- 1,979,565 · +23.2%
- By 2050
- 2,203,427 · +37.1%
- By 2075
- 2,667,893 · +66.0%
- By 2100
- 2,891,558 · +79.9%
Race, ethnicity, and origin ACS 2023
- Neighborhood character
- Highly diverse neighborhood (Simpson 0.71)
- Race & ethnicity
- White 42% Hispanic / Latino 25% Black 24% Two or more races 19% Asian 5%
- Hispanic origin (detail)
- Mexican 3% Puerto Rican 12% Cuban 3% Dominican 1%
- Common ancestry
- Hispanic 1% British 1% Romanian 1%
- Foreign-born
- 17% · Canada, Jamaica, China
- Languages at home
- 73% English-only · Spanish 19% Other Indo-European 2% French/Haitian/Cajun 1%
Political lean MEDSL · Hillsborough
- 2024 margin
- Toss-up / Even · D 47.8% · R 50.9% · Other 1.3%
- 2008→2024 swing
- -10.2pp toward R · 2008: 7.1pp · 2024: -3.1pp
- All cycles
- 2024: R+3.1 2020: D+6.9 2016: D+6.8 2012: D+6.7 2008: D+7.1
Not yet ingested
- Civics
- —
Market trends
- HPI YoY
- ▼ -1.42%
- Current HPI
- 240.5825
- Rent YoY
- ▲ 1.18%
- Metro
- Tampa-St. Petersburg-Clearwater, FL
- State GDP YoY
- ▲ 3.28%
- F500 in state
- 36
Industry mix (Fortune 500 HQ in FL)
| Industry | F500 HQs | Revenue |
|---|---|---|
| Industrial Technology | 2 | $29B |
|
||
| Insurance | 2 | $17B |
|
||
| Retail | 1 | $60B |
|
||
| Technology Distribution | 1 | $58B |
|
||
| Homebuilding | 1 | $35B |
|
||
| Technology Manufacturing | 1 | $35B |
|
||
Price history
-16.7% since first listed11 events — show timeline
- 2026-04-23 Pending — Stellar MLS as Distributed by MLS Grid
- 2026-04-14 Relisted — Stellar MLS as Distributed by MLS Grid
- 2026-04-07 Pending — Stellar MLS as Distributed by MLS Grid
- 2026-03-31 Price Changed $375,000 Stellar MLS as Distributed by MLS Grid
- 2026-03-13 Listed $400,000 Stellar MLS as Distributed by MLS Grid
- 2026-03-01 Listing Removed — Stellar MLS as Distributed by MLS Grid
- 2026-02-10 Price Changed $415,000 Stellar MLS as Distributed by MLS Grid
- 2026-01-05 Price Changed $422,000 Stellar MLS as Distributed by MLS Grid
- 2025-11-26 Price Changed $425,000 Stellar MLS as Distributed by MLS Grid
- 2025-09-27 Price Changed $434,000 Stellar MLS as Distributed by MLS Grid
- 2025-08-22 Listed $450,000 Stellar MLS as Distributed by MLS Grid
Property tax history
+23.3%/yrLatest (2025): $4,031 · +8.1% YoY. Source: county tax records.
Cash-flow waterfall
monthlySold comps — $/sqft
last 12 mo · ≤1 miLoading sold comps…