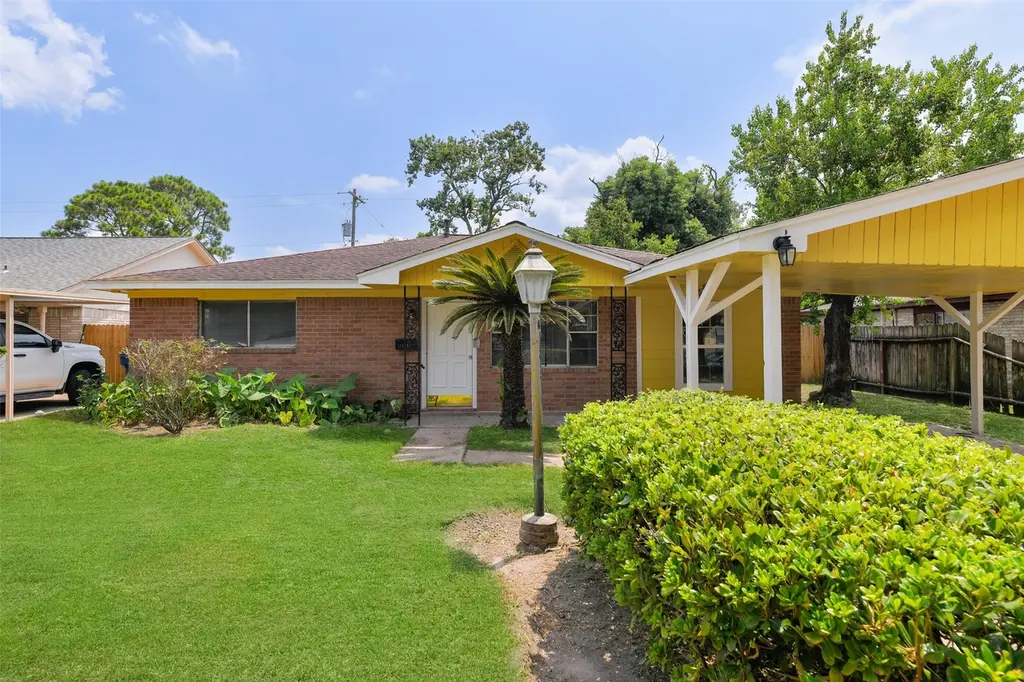
7405 Carver Ave · Texas City, TX
Flood risk 6/10 · Moderate
- FEMA flood zone
- X (unshaded)
- Chance of flooding over 30 yrs
- 0.7%
- Est. flood insurance / yr
- $507 – $1,088
Fire risk 3/10 · Minor
- Est. fire insurance / yr
- $1,222 – $2,270
Heat risk 10/10 · Severe
- Hot days now (above 110°F)
- 7 days/yr
- Hot days in 30 yrs
- 28 days/yr
Wind risk 10/10 · Severe
- Chance of severe wind over 30 yrs
- 99.0%
Air-quality risk 3/10 · Minor
- Unhealthy air days now
- 2 days/yr
- Unhealthy air days in 30 yrs
- 2 days/yr
Risk factors via First Street. Map © Google.
Why this score? — see what drove the D+ grade
The composite is a weighted blend of 9 inputs, each scored 0–100. Each bar is that input's sub-score; the figure is the points it added to the 100-point composite (weight × sub-score).
- Cash flow +18.0/30.0
- DSCR +5.6/10.0
- 1% rule +5.3/10.0
- ARV discount +5.3/15.0
- Rent growth +3.7/5.0
- Livability +3.1/5.0
- Condition / age +2.5/5.0
- Schools +2.4/10.0
- Appreciation +0.0/10.0
$184,900
🖨 Deal sheet 📄 Offer letter ✓ Due diligence
Listing remarks
Are you ready to make that big move into affordable home ownership without MUD taxes? This updated 4 bedroom 2 bathroom home in the desirable South Acre Manor subdivision in Texas City is ready to become your home sweet home! Updates for August 2024 to include paint inside & out, HVAC, some new flooring, 2024 bathroom, 2024 lighting fixtures & ceiling fans. New for 2024 primary bathroom with chic hex tile and rain shower head. Split floorplan with 3 bedrooms and 1 bathroom on one side of the home, while the primary ensuite is on the opposite side. Living room & family room as well as a centrally-located open kitchen ideal for entertaining. Lots of parking space under the c
Key facts
- Chic hex tile
- Primary bathroom
- New flooring
Tags
Property features AI
Finance
- Financial info: Lease not considered
Exterior
- Parking: Attached carport; Additional parking; 2-car carport
- Utilities: Public water; Public sewer
- Home design: Residential property; Single-story (living spaces on first floor); Slab foundation; Facing direction not specified
- Construction: Brick construction; Built in 1979; Composition roof
- Exterior features: Deck; Patio; Fence (back yard); Subdivision lot
Interior
- Kitchen: Gas oven; Gas range; Microwave; Refrigerator
- Bedrooms: Primary bedroom on first floor (10x10); Bedroom on first floor (11x11); Bedroom on first floor (13x9); Bedroom on first floor (13x10)
- Flooring: Laminate; Plank; Tile; Vinyl; Wood
- Bathrooms: 2 full bathrooms
- Heating & cooling: Central heating (electric); Central air (electric)
- Interior features: Breakfast bar; Kitchen/family room combo; Window treatments; Ceiling fans; Combined living and dining area; Window coverings
- Laundry & utility: Washer hookup; Electric dryer hookup; Utility room on first floor (7x4)
Neighborhood map
What this means for you Summary
Snapshot
- This is a 4-bed/1.0-bath single-family listed at $185k.
Deal economics
- At list price, monthly cash flow is $158 ($2k/yr) — positive.
- The deal already cash-flows at list — no discount required.
- Meets the 1% rule at list price ($2k rent vs $185k).
- Recommended offer: $179k (3.0% below list) — sets the bar for market timing.
- Cap rate 7.3% vs local median 4.3% in Texas City — top-decile yield for the area; either an underpriced asset or a hidden risk that comps aren't pricing in. Stress-test before assuming the spread holds.
Location & tenants
- Location reads 62/100 on livability (#907 in TX) — a middle-class / working-renter tenant base. Strengths: cost of living A+, housing A+; Watch: crime D+, amenities F, commute F.
- Texas City ISD (suburban): math 28% / reading 29% proficiency, ranked #655 of 826 in TX (top 79%) — low school quality limits family demand, transient renter base, plan for 1-2y turnover; 66% free/reduced lunch — lower-income household profile, screen leases tightly.
- Zoned schools: Simms El (math 23% / reading 24%, grade F, #3,247 of 4,322 statewide, top 76%, 475 students, 89% FRL); La Marque H S (math 27% / reading 20%, grade F, #1,342 of 1,632 statewide, top 82%, 647 students, 91% FRL) — zoned schools average 90% FRL vs 66% district-wide (24 pts higher); higher-poverty schools than district average — tighter screening recommended.
- Market conditions: Rents rising fast (+4.7%/yr); 240 active listings in the ZIP; 8 comparable units currently listed for rent nearby; rentals at typical pace (median 24d on market — plan ~3-4 weeks tenant-placement turnaround); 3,258 units permitted in Galveston County in 2024 (0 in 5+ unit buildings).
- This rent runs 33% of the median local income ($69k/yr) — at the standard rent-burdened threshold; future hikes will face affordability resistance.
Forward outlook
- Local home prices are declining (-3.0%/yr); year-one equity from $1k of loan paydown is wiped out by about $6k of value loss. Plan a longer hold.
- Galveston County population projected at +43% by 2050 — long-run rental-demand tailwind backs the buy-and-hold thesis.
Negotiation context
- It's been on market 31 days — a 3% lower offer ($179k) is reasonable based on typical stale-listing flexibility.
- 7 sale attempts since 2y ago with the ask held roughly flat each time — persistent listings suggest the price (not the market) is what's stuck; bring a comps-based counter.
Risks & watch-outs
- Climate carrying-cost: major flood risk; severe wind risk, 99% chance of damaging wind over 30y; extreme-heat days projected 7→28/yr by 2055 (HVAC capex compounding) — expect insurance premiums to compound above CPI over the hold.
Questions for the listing agent
- It's been on market 31 days. Have you received any prior offers? Is the seller open to a 3% concession, seller financing, or rate buy-down credit?
- Built in 1979 — when were the roof, HVAC, electrical panel, plumbing, and water heater last replaced?
- Is there a deadline driving the sale (1031 exchange, divorce, estate, relocation)? That informs how much negotiation room exists.
- Schools are F-rated, which usually means shorter tenancies and higher turnover. Who's the typical renter profile here, and what's been the actual vacancy rate?
- Crime grade is D in this area — have there been break-ins, vandalism, or insurance claims at this property in the last 3 years? What carrier currently insures it and at what premium?
- The area grade is low — what's the realistic commute time and amenity access for the typical tenant pool here? Any planned neighborhood developments (good or bad) we should know about?
- What's the average days-on-market for RENTAL listings here right now (not sales)? A rising rental-DOM trend means longer vacancies and softer asking-rent achievability than the comps imply.
- What's the recent tenant-quality profile in this submarket — average credit score on applications, eviction rate, late-payment / NSF rate, and stable-employment percentage? A property-management company in the area should have these aggregated.
- How much new for-sale + rental construction is in the pipeline within 1–3 miles? Heavy new supply typically softens prices + rents 12–24 months out; constrained supply supports both.
Investment metrics
- 1% rule
- 1.03% ✓
- Cap rate
- 7.32%
- Cash-on-cash
- 3.65%
- DSCR
- 1.16
- GRM
- 8.1
CMA / ARV
- ARV (median comp)
- $176,183
- List price
- $184,900
- Delta
- 4.95%
- Verdict
- FAIR
- Comps
- 20 within 1.0 mi
Show comp detail 12 sales within ~0.75 mi
| Address | Dist | Beds/Ba | Sqft | Sold | Price | $/sf | Match |
|---|---|---|---|---|---|---|---|
| 26 W Red Oak Ln | 0.26mi | 4/2.0 | 1,463 (+2%) | 4mo | $219,900 | $150 | 76 |
| 229 S Fulton St S | 0.24mi | 3/1.5 (-1) | 1,474 (+3%) | 1mo | $159,900 | $108 | 75 |
| 7306 Nightingale Cir | 0.29mi | 4/2.0 | 1,502 (+5%) | 6mo | $230,000 | $153 | 69 |
| 7211 Mockingbird Ln | 0.24mi | 3/1.5 (-1) | 1,300 (-9%) | 2mo | $187,600 | $144 | 66 |
| 7806 Jonquil Dr | 0.43mi | 3/2.0 (-1) | 1,512 (+6%) | 3mo | $229,900 | $152 | 58 |
| 3029 Taylor St | 0.58mi | 3/1.0 (-1) | 1,330 (-7%) | 1mo | $135,000 | $102 | 56 |
| 6519 Anderson St | 0.54mi | 3/2.0 (-1) | 1,490 (+4%) | 4mo | $210,000 | $141 | 55 |
| 208 Preston St | 0.69mi | 3/1.0 (-1) | 1,364 (-4%) | 0mo | $157,999 | $116 | 55 |
| 7214 Whippoorwill Ln | 0.51mi | 4/2.0 | 1,292 (-10%) | 2mo | $128,000 | $99 | 55 |
| 6618 Park Ave | 0.49mi | 3/2.5 (-1) | 1,362 (-5%) | 5mo | $204,900 | $150 | 54 |
| 8002 W Red Oak Ln | 0.39mi | 4/2.0 | 1,609 (+13%) | 4mo | $229,000 | $142 | 53 |
| 118 Brown St | 0.62mi | 3/1.0 (-1) | 1,275 (-11%) | 1mo | $205,000 | $161 | 47 |
Match score weights: distance 35% · size 25% · config 20% · recency 20%. Top-matched comps best support the ARV.
Projected returns pro-forma
-3.0% appreciation · 4.67% rent growth · sell at horizon
- IRR
- -8.6%
- Equity multiple
- 0.68×
- Total profit
- $-16,599
- Equity at exit
- $27,569
- IRR
- 3.1%
- Equity multiple
- 1.24×
- Total profit
- $12,568
- Equity at exit
- $15,987
Cash invested: $51,772 (down + closing). Projections, not guarantees.
Landlord ↔ Tenant lean methodology
- Overall (STATE)
- 87 Strongly Landlord-Friendly
- State Texas
- 87 Strongly Landlord-Friendly · R+5
- County
- — inherits STATE
- City
- — inherits STATE
ZIP-level market 77591
- Home prices YoY
- -5.6%
- Rents YoY
- 4.7%
- Active inventory
- 240
- Price-to-rent
- 8.1×
Monthly cashflow live
- Estimated rent
- $1,904 high interval (Pro) →
- Mortgage (P&I)
- −$970
- Tax from tax record
- −$300 /mo · $3,595/yr
- Insurance
- −$77
- HOA
- −$0
- Vacancy / Maint / Mgmt
- −$400
- Net cashflow
- $158
Break-even live
UW: 25.0% down · 7.5% · 30yr · 1.5% tax · 5.0% vac · 8.0% maint · 8.0% mgmt
Financing live
Cash to close
- Down payment
- $46,225
- Closing costs
- $5,547
- Reserves months
- —
- Total cash needed
- —
Loan-product check · same deal, 3 products live
Conventional
25% down · 7.5% · 30yr
- Down + closing
- —
- Monthly P&I
- —
- Monthly cashflow
- —
- DSCR
- —
- Eligible?
- —
Personal DTI + credit; lowest rate.
DSCR
20% down · 8.5% · 30yr
- Down + closing
- —
- Monthly P&I
- —
- Monthly cashflow
- —
- DSCR
- —
- Eligible?
- —
No personal income docs; deal must DSCR.
Hard money
10% down · 12.0% · 12mo
- Down + closing
- —
- Monthly P&I
- —
- Monthly cashflow
- —
- DSCR
- —
- Eligible?
- —
Short-term bridge; refi at stabilization.
Rent comps 8 comps
| Address | Beds | Baths | Sqft | Rent | $/sqft | DOM | Units | Dist |
|---|---|---|---|---|---|---|---|---|
| 7510 Hummingbird Ln Texas City, TX | 3.0 | 1.5 | 1200 | $1,550 | $1.29 | 2d | 1 | 0.10mi |
| 8208 Ash Rd Texas City, TX | 4.0 | 2.0 | 1701 | $1,795 | $1.06 | 43d | 1 | 0.74mi |
| 14403 Daniel Shores Dr La Marque, TX | 4.0 | 3.0–3.5 | 1872 | $2,600 | $1.39 | 1d | 12 | 0.82mi |
| 1006 E Camp Cir La Marque, TX | 3.0 | 1.0 | 1230 | $1,500 | $1.22 | 24d | 1 | 1.07mi |
| 619 N Vionett Ln Texas City, TX | 3.0 | 2.0 | 1204 | $1,550 | $1.29 | 5d | 1 | 1.07mi |
| 1013 Margot St La Marque, TX | 3.0 | 2.0 | 1099 | $1,500 | $1.36 | 18d | 1 | 1.18mi |
| 203 Beatrice St La Marque, TX | 3.0 | 1.0 | 1304 | $1,395 | $1.07 | 24d | 1 | 1.33mi |
| 1401 Austin St La Marque, TX | 4.0 | 3.0 | 1542 | $2,400 | $1.56 | 43d | 1 | 1.36mi |
Listing history 30 events
-
2026-06-15days on market $184,900 Pending 31 DOM
-
2026-06-13days on market $184,900 Pending 30 DOM
-
2026-06-09days on market $184,900 Pending 26 DOM
-
2026-06-08statusdays on market $184,900 Pending 25 DOM
-
2026-06-07days on market $184,900 Active 24 DOM
-
2026-06-04days on market $184,900 Active 21 DOM
-
2026-06-03days on market $184,900 Active 20 DOM
-
2026-06-02days on market $184,900 Active 19 DOM
-
2026-06-01days on market $184,900 Active 18 DOM
-
2026-05-31days on market $184,900 Active 17 DOM
-
2026-05-14$190,999 Active 928-char remark
-
2026-04-06historical $1,619
-
2026-02-27$1,619
-
2026-02-23historical $1,692
-
2026-01-07$1,692
-
2025-12-30soldstatus
-
2025-12-22historical $1,700
-
2025-10-26price $1,700
-
2025-09-26historical
-
2025-09-17$1,750
-
2025-09-05price $196,000
-
2025-08-21status Active
-
2025-08-14historical
-
2025-08-11price $199,900
-
2025-08-05$209,900 Active
-
2024-09-12historical $1,750
-
2024-09-05price $1,750
-
2024-08-27$1,799
-
2024-05-20soldstatus
-
2024-05-16soldstatus
ⓘ Source: listings_history table (triggers on properties + properties_extension) + one-shot
backfill from property_details.listing_events for pre-trigger history.
Tax reassessment forecast TX · Resets to sale price
- Current annual tax
- $3,595 · $300/mo
- Projected year-2 tax
- $3,595 · $300/mo
- Expected delta
- $0/yr ($0/mo · -0.0%)
ⓘ Screening estimate from a state-policy table — verify with the county assessor before closing.
Climate risk First Street
- Flood 6/10 Major FEMA zone X (unshaded) · 70% chance over 30 yrs
- Wildfire 3/10 Moderate
- Heat 10/10 Extreme 7 d/yr ≥110°F today · 28 d/yr by 30 yrs out
- Wind 10/10 Extreme 99% chance of damaging wind over 30 yrs
- Air quality 3/10 Moderate 2 unhealthy d/yr today · 2 by 30 yrs out
Nearby sold comps map
Loading sold comps map…
Walkable amenities ~0.75 mi
Loading nearby amenities…
Taxation est. · year 1
- Rental income
- $22,843
- − Mortgage interest
- −$10,357
- − Property taxes
- −$3,595
- − Insurance
- −$924
- − Repairs & maintenance
- −$1,827
- − Management
- −$1,827
- − Depreciation
- −$5,379
- Taxable loss
- −$1,067
- Est. tax savings @ 24.0%
- +$256
- After-tax cash flow
- $2,148/yr
For passive investors: Depreciation is non-cash, so a rental often shows a tax loss while cash-flowing — sheltering income. Rental losses are passive: they offset passive income freely, and up to $25,000/yr can offset ordinary (W-2) income if you actively participate and your MAGI is under $100k (phasing out to $0 by $150k); unused losses carry forward. On sale, claimed depreciation is recaptured at up to 25%, and gains may owe capital-gains tax (a 1031 exchange can defer both). Figures are a year-1 estimate at your 24.0% rate — not tax advice; consult a CPA.
Schools (NCES district)
- District
- Texas City ISD
- NCES district ID
- 4842510
- Math proficiency
- 28% ▼ -10.00%
- Reading proficiency
- 29% ▼ -4.00%
- Median HH income
- $44,875
- Composite
- 24.47/100
- National rank
- #7664
- State rank
- #655 of 826 in TX
Livability — Texas City
- Score
- 62/100
- State rank
- #907
- US rank
- #16268
Category grades
Schools grade is shown separately in the Schools card above.
Census & demographics
- Census place
- Texas City, TX
- County
- Galveston County · 357,330 people
- City population
- 49,936
- Metro
- Houston-The Woodlands-Sugar Land, TX
- Population (ZIP)
- 18,294
- Household income
- $68,593
- Rent vs Own
- Severe rent burden
- 718.0
Population outlook (Galveston County) Hauer SSP2
- Today (2025)
- 390,640 people
- By 2030
- 425,226 · +8.9%
- By 2040
- 493,765 · +26.4%
- By 2050
- 559,698 · +43.3%
- By 2075
- 719,260 · +84.1%
- By 2100
- 819,628 · +109.8%
Race, ethnicity, and origin ACS 2023
- Neighborhood character
- Diverse neighborhood (Simpson 0.65)
- Race & ethnicity
- Black 50% White 26% Hispanic / Latino 19% Two or more races 9% Asian 2%
- Hispanic origin (detail)
- Mexican 15%
- Common ancestry
- Lithuanian 2% Romanian 1% Slovak 1%
- Foreign-born
- 7% · Canada, China
- Languages at home
- 88% English-only · Spanish 9% Other Indo-European 1% Chinese 1%
Political lean MEDSL · Galveston
- 2024 margin
- Strong R (+27.4) · D 35.7% · R 63.1% · Other 1.2%
- 2008→2024 swing
- -7.9pp toward R · 2008: -19.5pp · 2024: -27.4pp
- All cycles
- 2024: R+27.4 2020: R+22.6 2016: R+22.6 2012: R+26.9 2008: R+19.5
Not yet ingested
- Civics
- —
Market trends
- HPI YoY
- ▼ -14.63%
- Current HPI
- 247.1905
- Rent YoY
- ▲ 4.67%
- Metro
- Houston-The Woodlands-Sugar Land, TX
- State GDP YoY
- ▲ 3.95%
- F500 in state
- 110
Industry mix (Fortune 500 HQ in TX)
| Industry | F500 HQs | Revenue |
|---|---|---|
| Energy | 16 | $1,198B |
|
||
| Technology | 5 | $198B |
|
||
| Engineering / Construction | 4 | $72B |
|
||
| Energy Services | 3 | $60B |
|
||
| Utilities | 3 | $41B |
|
||
| Healthcare | 2 | $330B |
|
||
Price history
+10177.9% since first listed23 events — show timeline
- 2026-06-15 Pending — HARMLS
- 2026-06-08 Pending — HARMLS
- 2026-05-27 Price Changed $184,900 HARMLS
- 2026-05-14 Listed $190,999 HARMLS
- 2026-04-06 Rental Removed $1,619 HARMLS
- 2026-02-27 Listed for Rent $1,619 HARMLS
- 2026-02-23 Rental Removed $1,692 HARMLS
- 2026-01-07 Listed for Rent $1,692 HARMLS
- 2025-12-30 Sold (Public Records) — Public Records
- 2025-12-22 Rental Removed $1,700 HARMLS
- 2025-10-26 Price Changed $1,700 HARMLS
- 2025-09-26 Listing Removed — HARMLS
- 2025-09-17 Listed for Rent $1,750 HARMLS
- 2025-09-05 Price Changed $196,000 HARMLS
- 2025-08-21 Relisted — HARMLS
- 2025-08-14 Listing Removed — HARMLS
- 2025-08-11 Price Changed $199,900 HARMLS
- 2025-08-05 Listed $209,900 HARMLS
- 2024-09-12 Rental Removed $1,750 HARMLS
- 2024-09-05 Price Changed $1,750 HARMLS
- 2024-08-27 Listed for Rent $1,799 HARMLS
- 2024-05-20 Sold (Public Records) — Public Records
- 2024-05-16 Sold (Public Records) — Public Records
Property tax history
+10.6%/yrLatest (2025): $3,595 · +52.4% YoY. Source: county tax records.
Cash-flow waterfall
monthlySold comps — $/sqft
last 12 mo · ≤1 miLoading sold comps…