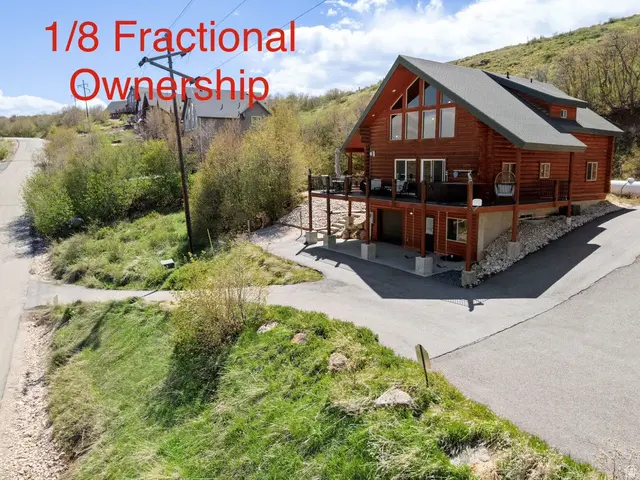
745 N Cambry Dr · Garden City, UT
Flood risk 1/10 · Minimal
- FEMA flood zone
- —
- Chance of flooding over 30 yrs
- 0.0%
- Est. flood insurance / yr
- —
Fire risk 5/10 · Moderate
- Est. fire insurance / yr
- $453 – $841
Heat risk 2/10 · Minimal
- Hot days now (above 89°F)
- 7 days/yr
- Hot days in 30 yrs
- 18 days/yr
Wind risk 1/10 · Minimal
- Chance of severe wind over 30 yrs
- —
Air-quality risk 2/10 · Minimal
- Unhealthy air days now
- 1 days/yr
- Unhealthy air days in 30 yrs
- 1 days/yr
Risk factors via First Street. Map © Google.
Why this score? — see what drove the D+ grade
The composite is a weighted blend of 9 inputs, each scored 0–100. Each bar is that input's sub-score; the figure is the points it added to the 100-point composite (weight × sub-score).
- Cash flow +12.8/30.0
- ARV discount +7.5/15.0
- Appreciation +7.1/10.0
- Schools +4.5/10.0
- 1% rule +4.4/10.0
- DSCR +3.8/10.0
- Livability +3.2/5.0
- Rent growth +2.5/5.0
- Condition / age +2.5/5.0
$150,000
🖨 Deal sheet 📄 Offer letter ✓ Due diligence
Listing remarks
Here's a rare chance to own a 1/8 share of a fully furnished cabin, in the Raspberry Patch community in Garden City. It's an easy way to enjoy Bear Lake without taking on the full cost or upkeep of a second home. Use your scheduled time throughout the year, then rent it out when you're not there. Nightly rentals are allowed, giving you flexibility to offset expenses while still having a place to escape to. The cabin itself is warm and comfortable with a great layout for hosting. Vaulted ceilings, updated finishes, and a fully furnished interior make it ready to go from day one. There's even a theater-style setup with reclining seats perfect for winding down after a day on the lake or trails
Key facts
- Theater style setup
- 0.3 acre lot
- Garage
Tags
Property features AI
Finance
- Other: Zoned single-family with short-term rentals allowed; Subdivision: Raspberry Patch Est.
- HOA & community: Homeowners association present; Annual association fee of $380; Association covers electricity, gas paid, insurance, grounds maintenance, sewer, trash, water, snow removal; Association amenities include barbecue and fire pit; pets not permitted
Exterior
- Parking: One covered garage space; One garage space (total 1); Five open parking spaces; Total of 6 parking spaces; Uncovered parking available
- Utilities: Natural gas connected; Electricity connected; Sewer connected; Water connected (culinary)
- Home design: Cabin architectural style; Fractional ownership; Currently used as single-family; Faces northeast; Metal roof; Built in 2003; Built/standing condition; Log construction; Above-grade finished area approximately 2400
- Construction: Log construction; Metal roof; Built in 2003; Built/standing
- Exterior features: Balcony; Basement entrance with daylight and walk-out access (100% finished); Sliding glass doors; Storm doors; Open patio; Open patio/patio; Hot tub; Private setting; Lake and mountain views; Paved road access; Hilly, steep-sloped terrain
Interior
- Kitchen: Built-in range/oven; Microwave; Refrigerator; Portable dishwasher
- Bedrooms: Two main-level bedrooms; Primary bedroom on first floor
- Flooring: Carpet; Tile; Concrete
- Bathrooms: Three full bathrooms
- Heating & cooling: Forced-air heating (≥95% efficiency); Central air conditioning
- Interior features: Disposal; Great room; Built-in range/oven; Vaulted ceilings; Theater room; Blinds and drapes; Fireplace insert; Projector
- Laundry & utility: Washer; Dryer; Freezer
Neighborhood map
What this means for you Summary
Snapshot
- This is a 4-bed/3.0-bath other listed at $150k.
Deal economics
- At list price, monthly cash flow is $-14 ($-165/yr) — negative.
- To cash-flow at today's rent, offer at most $148k (1.6% below list).
- To meet the 1% rule (rent ≥ 1% of price), the offer needs to be $142k (5.6% below list).
- Recommended offer: $142k (5.6% below list) — sets the bar for 1% rule.
Location & tenants
- Location reads 65/100 on livability (#156 in UT) — a middle-class / working-renter tenant base. Strengths: housing A-, crime B, cost of living B; Watch: employment C-, amenities F, commute F.
- Rich District (rural): math 51% / reading 55% proficiency, ranked #16 of 80 in UT (top 20%) — acceptable for families but not a draw, mixed tenant base, ~2y average lease.
- Zoned schools: North Rich School (math 64% / reading 54%, grade B-, #59 of 585 statewide, top 10%, 113 students, 37% FRL); Rich Middle School (math 52% / reading 57%, grade B-, #13 of 138 statewide, top 9%, 123 students, 33% FRL); Rich High (math 30% / reading 50%, grade F, #63 of 171 statewide, top 37%, 156 students, 30% FRL).
- Market conditions: 480 active listings in the ZIP; 97 units permitted in Rich County in 2024 (19 in 5+ unit buildings).
Forward outlook
- In year one you build about $7k of equity ($1k loan paydown + $6k appreciation (4.3% local appreciation)).
- Rich County population projected to shrink 8% by 2050 — rents likely to lag national; underwrite the cash flow, not the appreciation.
- At projected returns (4.3% appreciation + 3.0% rent growth), your $42k cash investment doubles in ~5 years — after that, you're playing with house money.
- By year 5, paydown + projected appreciation supports a ~$32k cash-out refi (75% LTV) — recoverable capital for the next deal without selling this one.
Negotiation context
- It's been on market 49 days — a 3% lower offer ($146k) is reasonable based on typical stale-listing flexibility.
- 7 sale attempts since 17y ago with the ask held roughly flat each time — persistent listings suggest the price (not the market) is what's stuck; bring a comps-based counter.
Risks & watch-outs
- Climate carrying-cost: moderate wildfire risk — expect insurance premiums to compound above CPI over the hold.
Questions for the listing agent
- What do current leases actually rent for vs. the listed asking? Can we see a recent rent roll and the last 12 months of T-12 income?
- It's been on market 49 days. Have you received any prior offers? Is the seller open to a 6% concession, seller financing, or rate buy-down credit?
- What does the HOA fee cover, when was the last increase, and are there any pending special assessments or reserve-fund shortfalls?
- Is there a deadline driving the sale (1031 exchange, divorce, estate, relocation)? That informs how much negotiation room exists.
- The area grade is low — what's the realistic commute time and amenity access for the typical tenant pool here? Any planned neighborhood developments (good or bad) we should know about?
- What's the average days-on-market for RENTAL listings here right now (not sales)? A rising rental-DOM trend means longer vacancies and softer asking-rent achievability than the comps imply.
- What's the recent tenant-quality profile in this submarket — average credit score on applications, eviction rate, late-payment / NSF rate, and stable-employment percentage? A property-management company in the area should have these aggregated.
- How much new for-sale + rental construction is in the pipeline within 1–3 miles? Heavy new supply typically softens prices + rents 12–24 months out; constrained supply supports both.
Investment metrics
- 1% rule
- 0.94% ✗
- Cap rate
- 6.18%
- Cash-on-cash
- -0.39%
- DSCR
- 0.98
- GRM
- 8.8
CMA / ARV
No comps found within radius.
Projected returns pro-forma
4.28% appreciation · 3.0% rent growth · sell at horizon
- IRR
- 10.7%
- Equity multiple
- 1.66×
- Total profit
- $27,721
- Equity at exit
- $78,559
- IRR
- 12.3%
- Equity multiple
- 3.09×
- Total profit
- $87,849
- Equity at exit
- $130,531
Cash invested: $42,000 (down + closing). Projections, not guarantees.
Landlord ↔ Tenant lean methodology
- Overall (STATE)
- 86 Strongly Landlord-Friendly
- State Utah
- 86 Strongly Landlord-Friendly · R+15
- County
- — inherits STATE
- City
- — inherits STATE
ZIP-level market 84028
- Home prices YoY
- 1.2%
- Active inventory
- 480
- Price-to-rent
- 8.8×
Monthly cashflow live
- Estimated rent
- $1,415 medium interval (Pro) →
- Mortgage (P&I)
- −$787
- Tax from tax record
- −$251 /mo · $3,009/yr
- Insurance
- −$62
- HOA
- −$32
- Vacancy / Maint / Mgmt
- −$297
- Net cashflow
- $-14
Break-even live
UW: 25.0% down · 7.5% · 30yr · 1.5% tax · 5.0% vac · 8.0% maint · 8.0% mgmt
Financing live
Cash to close
- Down payment
- $37,500
- Closing costs
- $4,500
- Reserves months
- —
- Total cash needed
- —
Loan-product check · same deal, 3 products live
Conventional
25% down · 7.5% · 30yr
- Down + closing
- —
- Monthly P&I
- —
- Monthly cashflow
- —
- DSCR
- —
- Eligible?
- —
Personal DTI + credit; lowest rate.
DSCR
20% down · 8.5% · 30yr
- Down + closing
- —
- Monthly P&I
- —
- Monthly cashflow
- —
- DSCR
- —
- Eligible?
- —
No personal income docs; deal must DSCR.
Hard money
10% down · 12.0% · 12mo
- Down + closing
- —
- Monthly P&I
- —
- Monthly cashflow
- —
- DSCR
- —
- Eligible?
- —
Short-term bridge; refi at stabilization.
HOA detail
- Monthly dues
- $32 · $384/yr
Listing history 36 events
-
2026-06-19days on market $150,000 Active 49 DOM
-
2026-06-18days on market $150,000 Active 48 DOM
-
2026-06-17days on market $150,000 Active 47 DOM
-
2026-06-16days on market $150,000 Active 46 DOM
-
2026-06-15days on market $150,000 Active 45 DOM
-
2026-06-14days on market $150,000 Active 43 DOM
-
2026-06-13days on market $150,000 Active 42 DOM
-
2026-06-10days on market $150,000 Active 40 DOM
-
2026-06-09days on market $150,000 Active 39 DOM
-
2026-06-08days on market $150,000 Active 38 DOM
-
2026-06-07days on market $150,000 Active 37 DOM
-
2026-06-03days on market $150,000 Active 33 DOM
-
2026-06-02days on market $150,000 Active 32 DOM
-
2026-06-01days on market $150,000 Active 31 DOM
-
2026-05-31days on market $150,000 Active 30 DOM
-
2026-05-30days on market $150,000 Active 29 DOM
-
2026-05-01$150,000 Active
-
2025-04-01historical
-
2024-06-17price $165,000
-
2024-06-13price $170,000
-
2024-04-11price $179,000
-
2024-03-18$185,000 Active
-
2024-03-15historical
-
2024-02-22price $175,000
-
2023-12-05$170,000 Active
-
2023-10-01historical
-
2023-07-14price $178,000
-
2023-05-16$187,500 Active
-
2023-01-02historical
-
2022-05-31$187,500 Active
-
2022-03-02soldstatus
-
2022-01-22historical Backup
-
2022-01-18$1,080,000 Active
-
2020-01-17soldstatus
-
2009-10-09historical
-
2009-04-09$379,000
ⓘ Source: listings_history table (triggers on properties + properties_extension) + one-shot
backfill from property_details.listing_events for pre-trigger history.
Tax reassessment forecast UT · Resets to sale price
- Current annual tax
- $3,009 · $251/mo
- Projected year-2 tax
- $3,009 · $251/mo
- Expected delta
- $0/yr ($0/mo · 0.0%)
ⓘ Screening estimate from a state-policy table — verify with the county assessor before closing.
Climate risk First Street
- Flood 1/10 Low 0% chance over 30 yrs
- Wildfire 5/10 Major
- Heat 2/10 Low 7 d/yr ≥89°F today · 18 d/yr by 30 yrs out
- Wind 1/10 Low
- Air quality 2/10 Low 1 unhealthy d/yr today · 1 by 30 yrs out
Nearby sold comps map
Loading sold comps map…
Walkable amenities ~0.75 mi
Loading nearby amenities…
Taxation est. · year 1
- Rental income
- $16,985
- − Mortgage interest
- −$8,402
- − Property taxes
- −$3,009
- − Insurance
- −$750
- − Repairs & maintenance
- −$1,359
- − Management
- −$1,359
- − HOA
- −$384
- − Depreciation
- −$4,364
- Taxable loss
- −$2,642
- Est. tax savings @ 24.0%
- +$634
- After-tax cash flow
- $469/yr
For passive investors: Depreciation is non-cash, so a rental often shows a tax loss while cash-flowing — sheltering income. Rental losses are passive: they offset passive income freely, and up to $25,000/yr can offset ordinary (W-2) income if you actively participate and your MAGI is under $100k (phasing out to $0 by $150k); unused losses carry forward. On sale, claimed depreciation is recaptured at up to 25%, and gains may owe capital-gains tax (a 1031 exchange can defer both). Figures are a year-1 estimate at your 24.0% rate — not tax advice; consult a CPA.
Schools (NCES district)
- District
- Rich District
- NCES district ID
- 4900840
- Math proficiency
- 51% ▼ -3.00%
- Reading proficiency
- 55% ▲ 1.00%
- Median HH income
- $51,144
- Composite
- 45.37/100
- National rank
- #2633
- State rank
- #16 of 80 in UT
Livability — Garden City
- Score
- 65/100
- State rank
- #156
- US rank
- #12941
Category grades
Schools grade is shown separately in the Schools card above.
Census & demographics
- Census place
- Garden City, UT
- Population (ZIP)
- 667
Population outlook (Rich County) Hauer SSP2
- Today (2025)
- 2,278 people
- By 2030
- 2,241 · -1.6%
- By 2040
- 2,142 · -6.0%
- By 2050
- 2,085 · -8.5%
- By 2075
- 1,814 · -20.4%
- By 2100
- 1,530 · -32.8%
Race, ethnicity, and origin ACS 2023
- Neighborhood character
- Predominantly White (76%)
- Race & ethnicity
- White 76% Hispanic / Latino 17% Two or more races 8%
- Hispanic origin (detail)
- Mexican 16%
- Common ancestry
- Italian 17% Portuguese 2% Slovak 1%
- Foreign-born
- 14% · Canada
- Languages at home
- 80% English-only · Spanish 18% German/W. Germanic 1%
Political lean MEDSL · Rich
- 2024 margin
- Solid R (+68.9) · D 14.8% · R 83.7% · Other 1.5%
- 2008→2024 swing
- -1.6pp toward R · 2008: -67.3pp · 2024: -68.9pp
- All cycles
- 2024: R+68.9 2020: R+71.7 2016: R+62.2 2012: R+82.5 2008: R+67.3
Not yet ingested
- Civics
- —
Market trends
- HPI YoY
- ▲ 4.28%
- Current HPI
- 347.1291
- Rent YoY
- —
- Metro
- —
- State GDP YoY
- ▲ 3.54%
- F500 in state
- 2
Industry mix (Fortune 500 HQ in UT)
| Industry | F500 HQs | Revenue |
|---|---|---|
| Financial Services | 1 | $3B |
|
||
Price history
-60.4% since first listed20 events — show timeline
- 2026-05-01 Listed $150,000 WFRMLS
- 2025-04-01 Listing Removed — WFRMLS
- 2024-06-17 Price Changed $165,000 WFRMLS
- 2024-06-13 Price Changed $170,000 WFRMLS
- 2024-04-11 Price Changed $179,000 WFRMLS
- 2024-03-18 Listed $185,000 WFRMLS
- 2024-03-15 Listing Removed — WFRMLS
- 2024-02-22 Price Changed $175,000 WFRMLS
- 2023-12-05 Listed $170,000 WFRMLS
- 2023-10-01 Listing Removed — WFRMLS
- 2023-07-14 Price Changed $178,000 WFRMLS
- 2023-05-16 Listed $187,500 WFRMLS
- 2023-01-02 Listing Removed — WFRMLS
- 2022-05-31 Listed $187,500 WFRMLS
- 2022-03-02 Sold (Public Records) — Public Records
- 2022-01-22 Contingent — WFRMLS
- 2022-01-18 Listed $1,080,000 WFRMLS
- 2020-01-17 Sold (Public Records) — Public Records
- 2009-10-09 Listing Removed — WFRMLS
- 2009-04-09 Listed $379,000 WFRMLS
Property tax history
+1.2%/yrLatest (2025): $3,009 · -1.5% YoY. Source: county tax records.
Cash-flow waterfall
monthlySold comps — $/sqft
last 12 mo · ≤1 miLoading sold comps…